Avalanches and Self-Organized Criticality in Superconductors
Abstract
We review the use of superconductors as a playground for the experimental study of front roughening and avalanches. Using the magneto-optical technique, the spatial distribution of the vortex density in the sample is monitored as a function of time. The roughness and growth exponents corresponding to the vortex ‘landscape’ are determined and compared to the exponents that characterize the avalanches in the framework of Self-Organized Criticality. For those situations where a thermo-magnetic instability arises, an analytical non-linear and non-local model is discussed, which is found to be consistent to great detail with the experimental results. On anisotropic substrates, the anisotropy regularizes the avalanches.
I Introduction
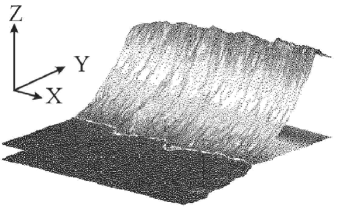
In this review we discuss the penetration of magnetic flux in thin type-II superconducting slabs subject to an increasing magnetic field oriented normal to the slab. In type-II superconductors, magnetic flux penetrates in the form of vortices, which behave as repulsive particles moving in the plane of the slab. The vortices can only enter (or leave) at the edge of the slab. Their motion, however, is hindered by pinning (due to disorder in the sample), which leads to a gradient in vortex density, somewhat similar to the slope of a sand pile, see Fig. 1. This analogy was already noted a long time ago by de GennesDeGennes1950 . In the present paper, however, this analogy is extended to the surface roughness of the pile and to the avalanches occurring on its surface.
The growth and roughness exponents of this rough surface are determined. Also the properties of the avalanches occurring on the surface are measured and it will be shown that they have a power law size distribution function and obey ”finite size scaling”. In addition, we find that exponent scaling relations of Paczuski, Maslov and BakPMB1996 are obeyed to reasonable accuracy. All these observations together make a strong case for the vortex pile system to belong to the class of Self-Organized Criticality (SOC)BakHNW systems. To investigate the role of disorder, we also study thin films of Niobium, which are slowly subjected to a hydrogen atmosphere. Hydrogen is absorbed by Niobium and locally destroys the superconductivity, thus increasing the amount of disorder. We find that a minimum amount of disorder is necessary for SOC to occur. In other superconductors, the properties of huge thermo-magnetic avalanches are studied. These are described very nicely by a recently developed modelAranson2005 and can be simulated to high degree of correspondence.
II Experimental technique
Images of the 2-dimensional (i.e. in the plane of the thin film sample) density of vortices are made using a magneto-optical techniqueKoblWijngMORev . On top of the sample and in immediate contact with it, a mirror layer and (directly above this) a 4 thick Yttrium Iron Garnet film with large Faraday effect are placed. The sample assembly is placed on a custom built insert with -controls for proper alignment, which fits in a commercial or Oxford instruments cryostat. The insert is equipped with lenses, a semi-transparent mirror and polarizers, making it effectively a polarization microscope. Where ever there is a local magnetic field in the sample, the incoming polarization vector is turned, thereby increasing the detected intensity. Thus the intensity in the camera yields directly the magnetic field and hence vortex density for each position in the sample. Using a modulation schemeRWMOLI ; RWOystese this intensity map becomes linear in field and much more sensitive.
III Roughening of the vortex landscape
As mentioned above, the vortex density map of the sample is generally not smooth (see Fig. 1) but displays some roughness. For example, one may define a flux front as the ‘foot’ of the vortex ‘mountain’ as indicated by the white line in Fig. 1. The exact position is determined by the cross section between the vortex ‘mountain’ and a horizontal plane at a level of 3 times the noise in the vortex-free region. GenerallyBaraStan , for such fronts, the r.m.s. width growths initially with time as . After some time , however, lateral correlations extend over the whole area of the pile and does not increase anymore: it is limited to a pile-size dependent value where is the linear size of the pile and is the roughness exponent. At , both relations hold from which
| (1) |
To find and to higher accuracy, we use the correlation functionBaraStan
| (2) |
where and is the height of the interface at position and time , where and denotes an average over . From this correlation function, one determines the growth exponent and roughness exponent usingBaraStan and .
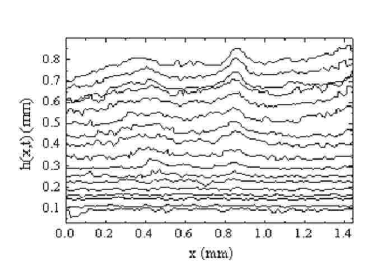
For YBa2Cu3O7-samples of 80 thick that were deposited on NdGaO3 substrates, we recently found for the roughness of the 2-dimensional surface of the pileWellingEPL2004 ,AegerterPA2005 :
| (3) | ||||
The values of these exponents are consistent with the Q-EW (quenched-disorder Edwards–Wilkinson) model. Apparently the vortices move on a substrate with randomly distributed quenched pinning sites, as is indeed expected for a high-Tc superconductor. Similar values for and for the flux fronts in YBa2Cu3O7 thin films were previously obtained by Surdeanu et al.SurdeanuPRL1999 and for in Niobium thin films by Vlasko-Vlasov et al.VlaskoVlasov2004 . In general, the values of the exponents for the 2-dimensional surface are lower than for the fronts. The reason for obtaining similar values for and for the 1-d and 2-d case is the higher number of defects in the sample used for 2-d case.
IV Small vortex avalanches
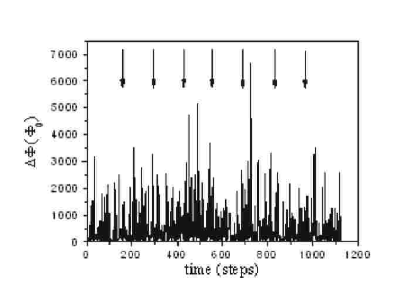
From a closer inspection of the growth process of the vortex ‘mountain’, shown on Fig. 1, it is clear that the formation of this ‘mountain’ and hence the flux penetration process is not continuous, but takes place in the form of avalanches. In our experimental procedure, the external field is increased in steps of and after each such increase an image of the vortex density in the sample is obtained. The size of each avalanche is calculated from
| (4) |
where is the difference between two consecutive images minus the increase of the external field. The resulting time series of avalanches is shown in Fig. 3.
The size distribution of the avalanches is shown for differently sized windows of observation in Fig. 4 as a log-log plot. From the straight line behavior in the limit of large systems (viz. large windows of observation), it is clear that the avalanche sizes are power law distributed with , just like earthquakes and many more natural phenomenaBakHNW .
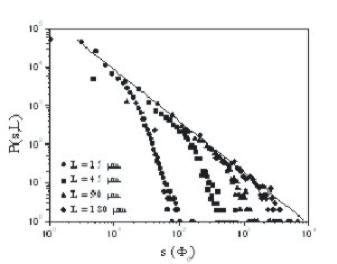
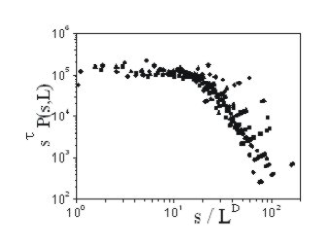
The ubiquitous occurrence of power laws in many natural phenomena lead Bak to the idea of Self-Organized CriticalityBakHNW , a model where slowly driven systems organize themselves automatically to be in a metastable state where small disturbances can lead to a response of arbitrary size. The archetypal example is the sand pile with its critical slope (metastability) and the avalanches of sand sliding down its surface. Within the SOC framework (and otherwise too), the volume of an avalanche with fractal dimension and linear extension is given by Since the linear size of the avalanche is limited by the system size (by neccesity ), one expects that the finite size effect-induced deviations from the straight line in Fig. 4 scale as . Indeed the finite size scaling (FSS) plot of Fig. 5 shows a nice data collapse and yieldsWellingEPL2004 and .
Apart from the FSS and the power law behavior there is another check one can make for SOC. This is based on the exponent relations of Paczuski, Maslow and BakPMB1996 . We discuss and use two such relations.
The first scaling relation is found by calculating the volume of the fractal avalanche. By definition, . Also, this volume equals the fractal surface times the fractal height. The fractal surface area is the projection of the avalanche cluster on an average (flat) plane through the pile surface. This area is where is the surface fractal dimension of the avalanche cluster. The height or thickness of an avalanche is obtained by subtracting the heights (in the direction perpendicular to ) of the piles before and after the avalanche. Since the avalanche modifies the pile only locally, this fractal thickness scales as the surface roughness and is proportional to . Hence . Combining both expressions for yields from which we obtain the scaling relation
| (5) |
The second scaling relation follows from the fact that the deviation from power law behavior seen in Fig. 4 occurs because avalanches above a certain size ‘feel’ that the pile is finite.
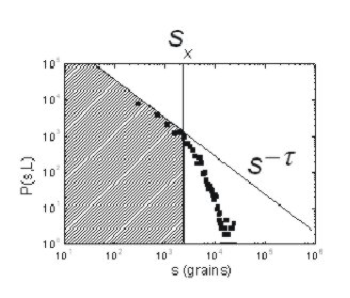
This, of course, occurs at a time (see eq. 1), when correlations and avalanches start to span the whole ‘mountain’. By definition the size of such an avalanche is . Since we increase the external field at constant rate, also is proportional to the number of vortices we must add to the pile to obtain such a ‘mountain’-spanning avalanche. However, before we create an avalanche of size , many smaller avalanches have occurred, adding to the number of vortices that we have to add before a ‘mountain’-spanning avalanche takes place. Thus is equal to the integral of the size distribution function up to , i.e. the shaded area in Figure 6. This gives
| (6) |
In the FFS analysis we found that , hence we obtain
| (7) |
Combination with eq.1 yields the exponent relation
| (8) |
Equations 5 and 8, which were previously derived by Paczuski et al.PMB1996 , offer an interesting possibility: one can calculate the roughness and growth exponents, and , from the avalanche properties only. In the table below we compare the values from such an analysis with those obtained above from a direct roughness analysis of the surface of the pile:
from roughness analysis from avalanche analysis
Clearly, a good agreement is found, which supports the underlying assumption i.e. that SOC theory yields a valid description of the avalanche behavior in this superconductor.
V Transition from non-SOC to SOC
Naturally, one may wonder whether the avalanche and roughness properties in all superconductors are governed by SOC. To investigate this question, we study these properties as a function of quenched disorder. As a sample we use a 500 nm thick Niobium thin film on an -plane () sapphire substrate, which is a superconductor with , but which also absorbs hydrogen from the surrounding atmosphere. The hydrogen enters the Niobium lattice interstitially and at low temperatures precipitates in small non-superconducting clusters, that (like other defects) constitute strong pinning centers. The hydrogen gas absorption was always done at room temperature by applying a certain hydrogen gas pressure for hour. Typical flux penetration patterns are shown in Fig. 7.
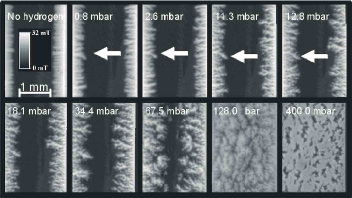
Avalanches are observed during the slow increase of the externally applied magnetic field, in similar manner as described above. The avalanches in the hydrogen-free sample are quite compact and all of similar size, while those in the hydrogenated sample (e.g. at 18.1 ) are more fractal and have a large range of sizes. As a consequence, a finite size scaling analysisWellingNbH2004 does work for the hydrogenated sample, but not for the hydrogen free sample. This, together with a significant change in fractal dimensionWellingNbH2004 , indicates that (at least for these samples) SOC occurs only if a minimal amount of static disorder is present. We conjecture that this is a more general phenomenon and that also on granular piles SOC behavior depends on the possibility that disorder (randomness) can develop on its surface.
VI Avalanches in patterned superconductors
If a superconductor is perforated with a square array of tiny holes ( in diameter and designated as ‘anti-dots’), the moving vortices tend to be guided in the direction of the lattice vector of these holesPannetier2003 . In this case, avalanches are still possible, but they are guided in similar manner, reducing their fractal dimension, see Fig. 8. However, still a power law distribution of avalanche sizes is observedMenghini2005 : the guiding apparently does not destroy SOC behavior.
VII Thermomagnetic Avalanches
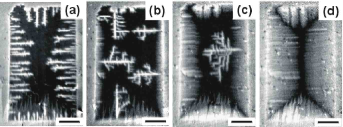
Interestingly, in very similar samples, 500 nm thick Niobium thin films on an -plane () sapphire substrate (and without anti-dots), a completely different behavior is observed, see Fig. 9.
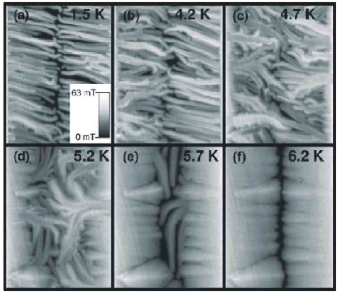
At low temperatures (), upon increasing the field after cooling in zero field, initially, the vortex density is rather smooth, but somewhat plume-like, similar to what is shown in Fig. 9f. After exceeding a certain distance from the edge, however, large avalanches occur, which span immediately nearly half of the width of the sample. At low temperature (Fig. 9a) these avalanches are much more narrow and less branched than at higher temperature (Fig. 9e). After each avalanche, the ‘smooth’ front starts again from the sample edge and runs over the previous, still existing, vortex landscape. As soon as it is close to the previous front, a new avalanche may occur. The avalanches do not reproduce in the same spot from one experiment to the next, indicating that the phenomenon is due to an intrinsic instability and not to defects in the samples. Recently Aranson et al.Aranson2005 developed a nice theoretical model, which was also used as the basis for numerical simulations, which very closely resemble the experimental results (similar experimental results were obtained before, see refs 3-9 of ref. Aranson2005 , while similar models were developed by Shantsev et al.Shantsev2003 and Baggio et al.Baggio2005 ). In this model, the system is described by two coupled differential equations:
| (9) | ||||
where is a reduced temperature, is the current density and the resistivity of the superconductor, is a local magnetization, defined by . For thin film samples, like ours, the second equation is highly non-local, which is described by the kernel . The parameter contains the thermal properties of the film and its contact to the substrate, while the parameter is the ratio between magnetic and thermal diffusion times. Small values of make the system more unstable. For a detailed comparison between model and experiment see ref. AronsonAdditional .
VIII Conclusion
We find evidence for SOC behavior of avalanches on the vortex landscape of many different superconductors, provided that enough (quenched) disorder is present. This SOC (avalanche) behavior is preserved in the presence of a square array of strong pins (anti-dots). For superconductors close to thermal runaway, only large avalanches occur, all of similar size (non-SOC behavior).
IX Acknowledgment
We thank I.S. Aranson, A. Gurevich, V.K. Vlasko-Vlasov, V.M. Vinokur, U. Welp, A. Silhanek, S. Raedts and V. Moshchalkov for fruitful discussions. This work was supported by FOM (Stichting voor Fundamenteel Onderzoek der Materie), which is financially supported by NWO (Nederlandse Organisatie voor Wetenschappelijk Onderzoek). We acknowledge the VORTEX program of the European Science Foundation for support.
——————
References
- (1) P.G. de Gennes, Superconductivity of Metals and Alloys, (W.A. Benjamin Inc., New York, N.Y., 1966).
- (2) M. Paczuski, S. Maslov and P. Bak, Phys. Rev. E 53 (1996) 414 .
- (3) P.Bak, How Nature Works, Springer Verlag (New York, 1996).
- (4) I.S. Aranson, A. Gurevich, M.S. Welling, R.J. Wijngaarden, V.K. Vlasko-Vlasov, V.M. Vinokur, and U. Welp, Phys. Rev. Lett. 94 (2005) 037002.
- (5) M.R. Koblischka and R.J. Wijngaarden, Supercond. Sci. and Technol. 8 (1995) 199.
- (6) R.J. Wijngaarden, K. Heeck, M. Welling, R. Limburg, M. Pannetier, K. van Zetten, V.L.G. Roorda, A.R. Voorwinden, Rev. Sci. Instrum. 72 (2001) 2661.
- (7) R.J. Wijngaarden, C.M. Aegerter, M.S. Welling and K. Heeck in: Magneto-Optical Imaging, T.H. Johansen, D.V. Shantsev (eds.), NATO SCIENCE SERIES: II: Mathematics, Physics and Chemistry (Kluwer Academic Publ. Dordrecht 2003), Vol. 142, p 61.
- (8) A.-L. Barabási and H. E. Stanley, Fractal Concepts in Surface Growth, Cambridge University Press (Cambridge, 1995).
- (9) C.M. Aegerter, M.S. Welling and R.J. Wijngaarden, Europhys. Lett.65 (2004) 753.
- (10) C.M. Aegerter, M.S. Welling and R.J. Wijngaarden, Physica A 347 (2005) 363.
- (11) R. Surdeanu, R.J. Wijngaarden, E. Visser, B. Dam, J. Rector and R. Griessen, Phys. Rev. Lett. 83 (1999) 2054.
- (12) V.K. Vlasko-Vlasov, U. Welp, V. Metlushko and G. W. Crabtree, Phys. Rev. B 69 (2004) 140504.
- (13) M.S. Welling, C.M. Aegerter, R.J. Westerwaal, S. Enache, R.J. Wijngaarden, and R. Griessen, Physica C 406 (2004) 100.
- (14) M. Pannetier, R.J. Wijngaarden, I. Fløan, J. Rector, B. Dam, R. Griessen, P. Lahl, R. Wördenweber, Phys. Rev. B 67 (2003) 212501.
- (15) M. Menghini, R. J. Wijngaarden, A. V. Silhanek, S. Raedts, and V. V. Moshchalkov, Phys. Rev. B 71 (2005) 104506.
- (16) D.V. Shantsev, P.E. Goa, F.L. Barkov, T.H. Johansen, W.N. Kang and S.I. Lee, Supercond. Sci. Technol. 16 (2003) 566.
- (17) C. Baggio, R.E. Goldstein, A.I. Pesci and W. van Saarloos, Phys. Rev. B 72 (2005) 060503.
- (18) See EPAPS No. E-PRLTAO-94-002506 for an extensive collection of movies. This may be reached via http://www.aip.org/pubservs/epaps.html or directly from ftp://ftp.aip.org/epaps/phys_rev_lett/E-PRLTAO-94-002506/