Glass-like low frequency ac response of ZrB12 and Nb single crystals in the surface superconducting state
Abstract
We report experimental studies of the low frequency electrodynamics of ZrB12 and Nb single crystals. AC susceptibility at frequencies 3 - 1000 Hz have been measured under a dc magnetic field, , applied parallel to the sample surface. In the surface superconducting state for several the real part of the ac magnetic susceptibility exhibits a logarithmic frequency dependence as for spin-glass systems. Kramers-Kronig analysis of the experimental data, shows large losses at ultra low frequencies ( Hz). The wave function slope at the surface was found. The linear response of the order parameter to the ac excitation was extracted from the experimental data.
pacs:
74.25.Nf; 74.60.EcI Introduction
Nucleation of the superconducting phase in a thin surface sheath in a decreasing magnetic field parallel to the sample surface was predicted by Saint-James and de Gennes some years ago PG . They showed that nucleation of the superconducting phase occurs in a magnetic field , where is the thermodynamic critical field and is the Ginzburg-Landau (GL) parameter. Experimental confirmations of this prediction were done in numbers of publications STR ; PAS ; BURG ; ROLL ; SWR . It was found that in the in surface superconducting state (SSS) at low frequencies, the superconducting compounds are lossy materials. However, the losses in the SSS, which exceed the losses of the normal state, shows a peak at external fields , when . This peak exists even at frequencies of a few Hertz. In general, the response is nonlinear, and frequency dependent. The critical state model was found adequate for the description of the experimental data ROLL .
In the last few years the SSS has attracted renewed interest from various directions TS2 ; JUR ; GM ; SCOL ; RYDH ; LEV2 ; FINK1 . The stochastic resonance phenomena in the SSS for Nb single-crystal, were observed in the nonlinear low-frequency response to ac fields, TS2 . In JUR it was assumed that at the sample surface consists of many disconnected superconducting clusters and subsequently the percolation transition takes place at . The paramagnetic Meissner effect is also related to the SSS GM . Voltage noise and surface current fluctuations in Nb in the SSS has been investigated SCOL . Surface superconducting states were detected also in single crystals of MgB2 RYDH and ZrB12 LEV2 . A new theoretical approach, based on a generalized form of the GL functional, was developed in FINK1 . Surface superconductivity in three dimensions was studied theoretically in XN ; MOG . It was found ROLL ; LEV2 that, in general, the wave form of the surface current in an ac magnetic field has a non-sinusoidal character. The latter one can be described by a simple phenomenological relaxation equation for transitions between metastable states LEV2 . The relaxation time in this equation depends on the deviation from equilibrium and increases with decreasing of the excitation frequency LEV2 .
In spite of the extensive study, the origin of low frequency losses in SSS under weak ac fields, is not clear yet. The critical state model implies that if the amplitude of the ac field is smaller than some critical value, the losses are absent. Indeed, the experimental results for Pb-2In alloy confirm this prediction ROLL . On the other hand, the observed response JUR for an excitation amplitude of 0.01 Oe (that, is considerably smaller than that used in ROLL ), shows losses in SSS of Nb at 10 Hz. Our measurement on Nb single crystal at 733 Hz also has shown that the out-of-phase part of the ac susceptibility, , is independent of the amplitude, and is finite at low amplitude values. We consider these results as confirming that the losses in SSS are caused by essentially linear phenomena and thus the critical state model cannot be used for an adequate description of the ac response.
In this paper we present detailed experimental study of the linear low-frequency response of ZrB12 ( K, ) and Nb ( K, ) single crystals in the SSS, for frequencies Hz. We show that already at 3 Hz the ac susceptibility does not equal , where is the dc equilibrium magnetization. For some dc magnetic fields , which resembles spin-glass systems SG . The Kramers-Kronig analysis of our experimental data predicts that for several dc magnetic fields huge loss peak should exist at very low frequencies. It is believed that the observed response presents the average value over many clusters, each of which is governed by a second order differential equation, with individual relaxation parameters. This is unlike a spin-glass system where the first order differential equation can be used LUN . The observed ratio of for our crystals differs from the predicted value - 1.69. It is believed that this is due to the nonzero slope of the wave function at the surface, . The increased ratio of shows that the sign of is unexpectedly negative ANG .
The order parameter, , in the SSS has the form:
| (1) |
where equals zero inside the bulk of the sample (-axis is assumed normal to the sample surface, parallel to -axis) and is some as yet undetermined constant. In general case for any dc magnetic field there is a band of possible values for for which the solution of the GL equations can be found. These solutions describe the metastable surface states with nonzero total surface current and only the solution with zero current corresponds to the equilibrium state. In this state the dc magnetic moment equals zero for . On the other hand, in the presence of an ac field, the nonzero response in SSS shows that the ac moment is not zero, thus the system is not in equilibrium. In the linear approximation
| (2) |
where the external magnetic field is . The function characterizes the response of the order parameter to an ac field and is determined in this paper.
II Experimental Details
The measurements were carried out on ZrB12 and Nb single crystals, which were grown in the Institute for Problems of Materials Science NAS, Ukraine, and in the Institute of Solid State Physics RAS, Russia, respectively. The dimensions of the crystals are mm3 for ZrB12 and mm3 for Nb. The details of the sample preparation and their magnetic characteristics were published previously TS1 ; TS2 . All the magnetization curves were measured using a SQUID magnetometer. Ac susceptibility, in-phase, , and out-of-phase, , components were measured using the pick-up coils method SH ; ROLL . Each sample was inserted into one of a balanced pair coils. The unbalanced signal as a function of the external parameters: temperature, dc magnetic field, frequency and amplitude of excitation, was measured by a lock-in amplifier. The experiment was carried out as follows. The crystal was cooled down at zero magnetic field (ZFC). Then the magnetic field was applied. The amplitude and the phase of the unbalanced signal were measured in a given magnetic field, including zero field, at all frequencies. The amplitude of excitation was Oe. We have supposed that in zero dc magnetic field the ac crystal susceptibility is equal to the dc susceptibility in the Meissner state with negligible losses. It permits us to find an absolute value of the in-phase and out-of-phase components of the ac magnetic susceptibility for all applied fields and frequencies. A ”home-made” measurement cell of the experimental setup was adapted to a commercial SQUID magnetometer. The block diagram of the experimental setup has been published elsewhere LEV2 .
For the Fourier component of the magnetization in the linear approximation one can write
| (3) |
where is the susceptibility of the normal core of the sample, and is the Fourier component of the surface supercurrent, . This equation takes into account the magnetic moment of the normal core of the bulk and the magnetic moment of the surface supercurrent ROLL . With Eq. (3) we can find and the surface susceptibility defined as . The measured susceptibility , and surface susceptibility , , are connected to each other as follows:
| (4) |
where is the magnetic field at which the sample is in the normal state. These quantities, ( and ), characterize the response of the surface current and eliminate the contribution of the normal core in the bulk and the small unbalanced signal of the empty coils
III Experimental results
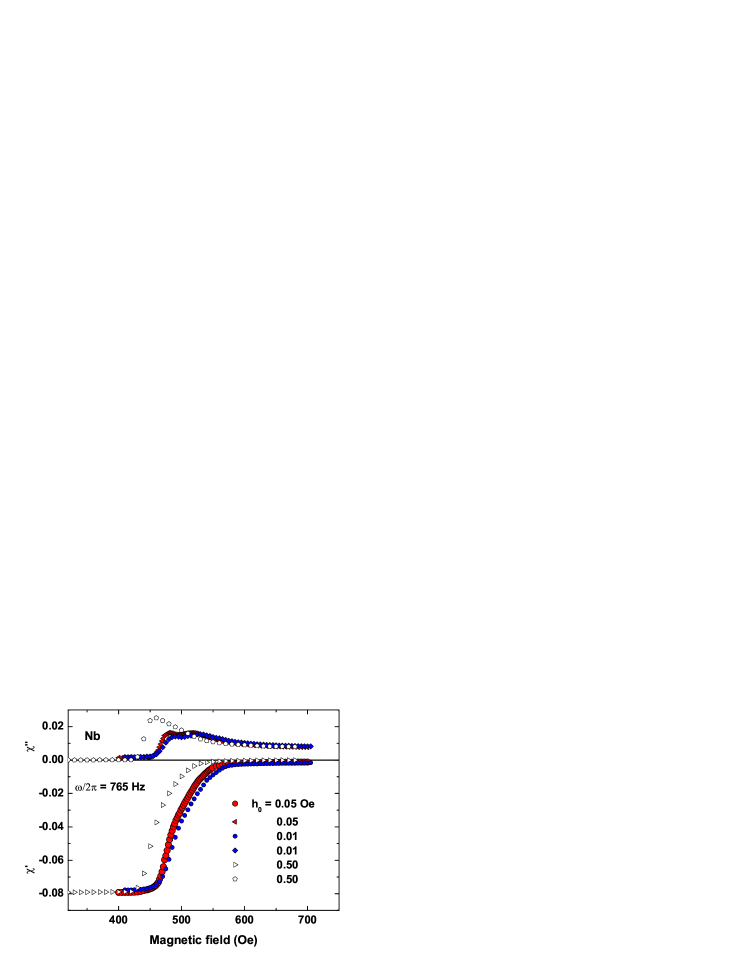
The field dependencies of the ac susceptibility , of Nb single crystal at different excitation amplitudes () are presented in Fig. 1. The data show clearly that at the low amplitudes , are almost independent on the . Similar results were obtained for the ZrB12 crystal. We consider that at Oe the observed response in both Nb and ZrB12 crystals has a linear origin.
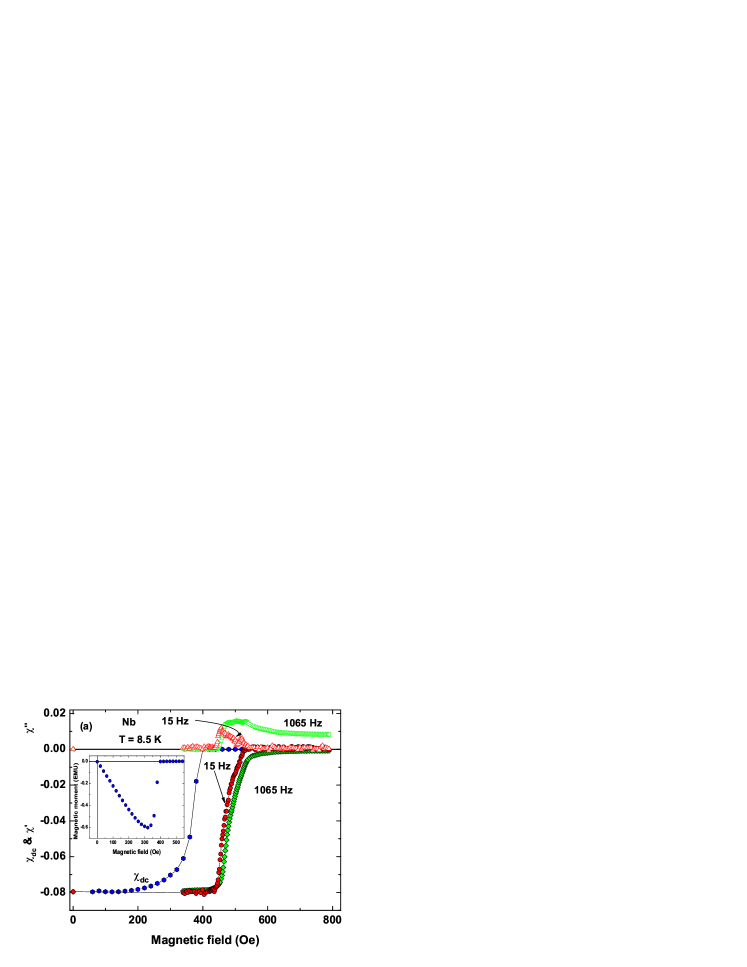
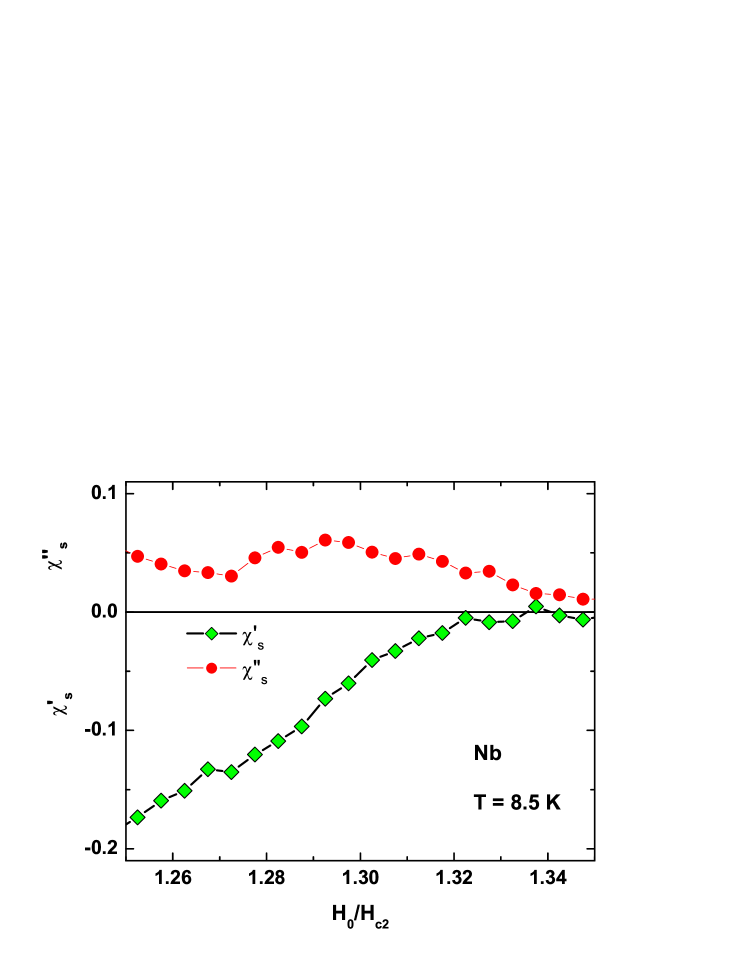
Figs. 2a and Fig. 2b show the , and the ZFC dc susceptibility, , as a function of the dc field () of Nb and ZrB12 respectively. The insets in Figs. 2a and 2b present the ZFC isothermal magnetization curve.
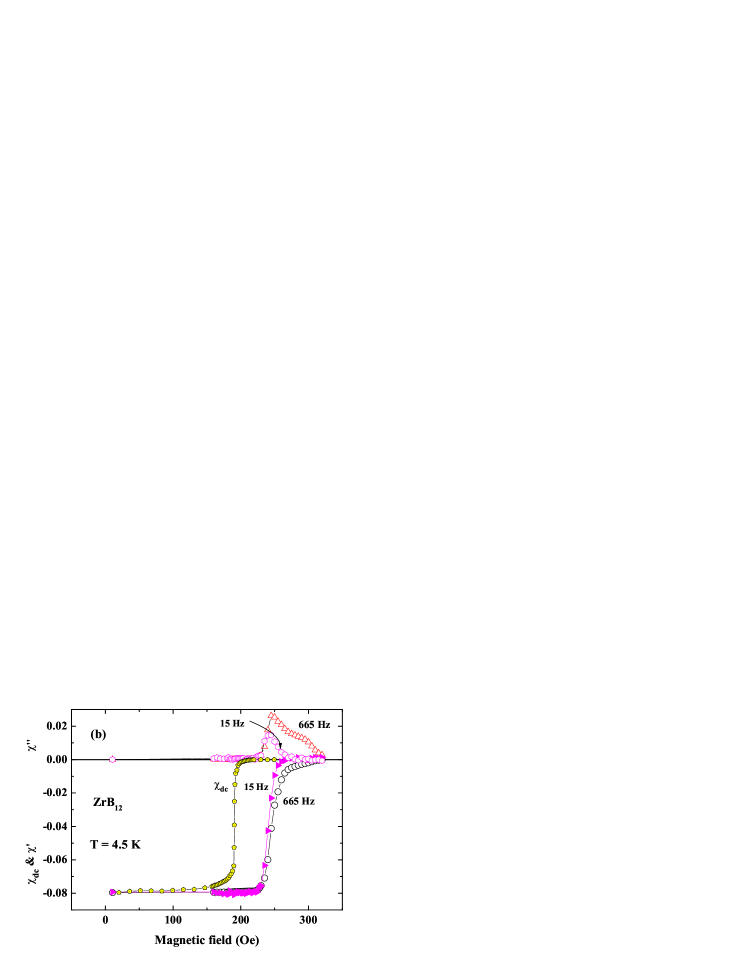
(b) Magnetic field dependencies of , and for ZrB12 at K.
Note, that for both crystals, at the dc susceptibility in the SSS is zero, whereas a large and diamagnetic ac susceptibility signal is observed, see Fig. 2. The difference between the dc and the in-phase ac susceptibility signals remain even at Hz (the lowest frequency in our set up). The out-of-phase component, , has a broad maximum for .
In the normal state, for , the losses for Nb are greater than for ZrB12 (see Fig. 2a for 1065 Hz), because the normal state conductivity of Nb is larger than that of ZrB12. The out-of-phase susceptibility is proportional to as expected for the normal skin effect in the limit , where is the skin depth and is the sample thickness LL . For both crystals, when , is field independent. However in SSS, (see Fig. 2), the losses for Nb are lower than for ZrB12. Both, the in- and out-of-phase components of the ac susceptibility, , do not show any clear peculiarities as the dc magnetic field passes through . Therefore, it is difficult to extract the value from the experimental data. More sensitive measurement of can be done by using the curves (see below).
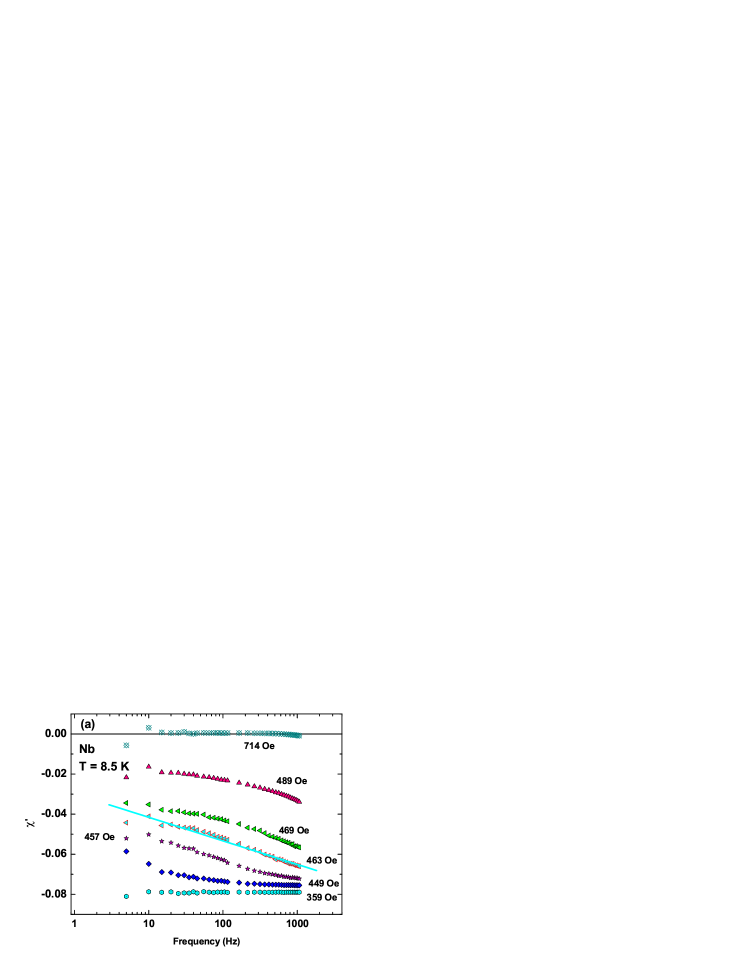
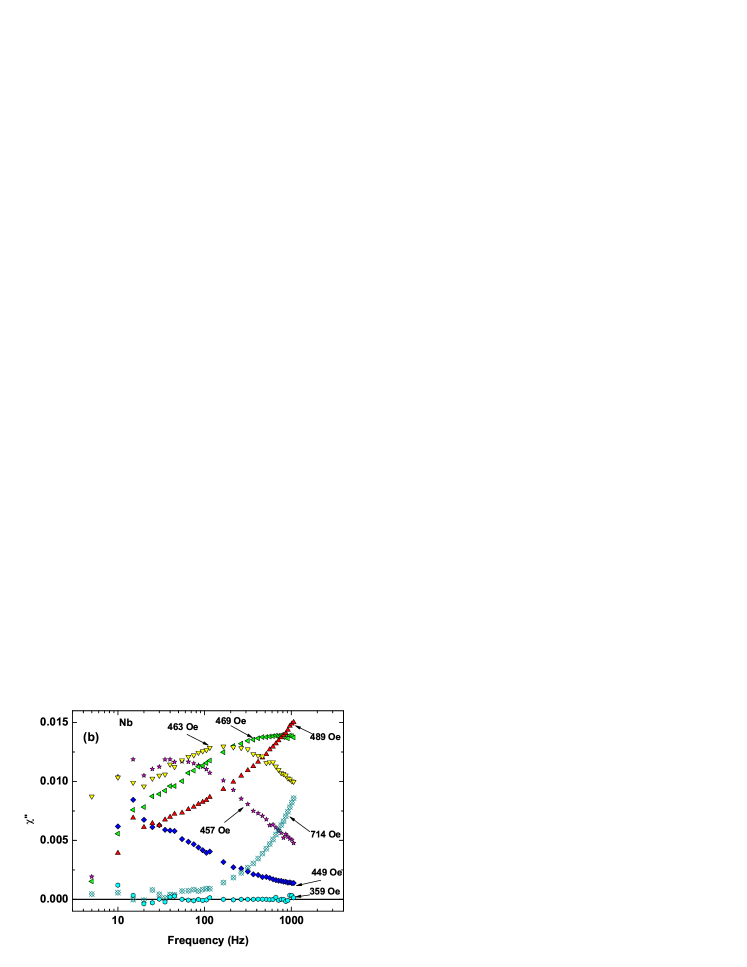
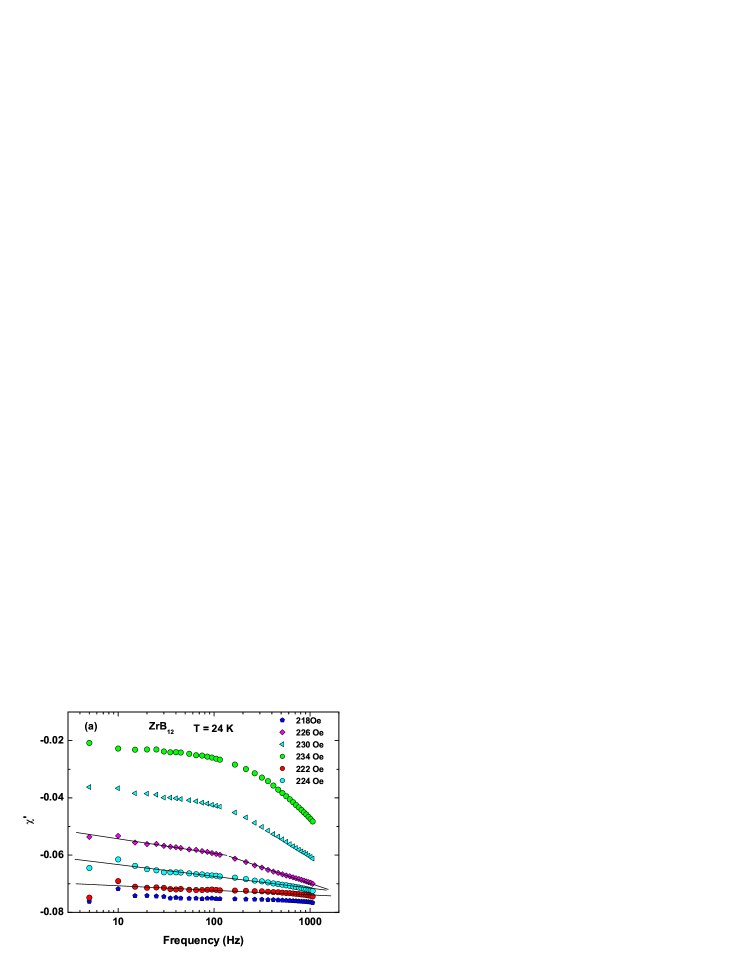
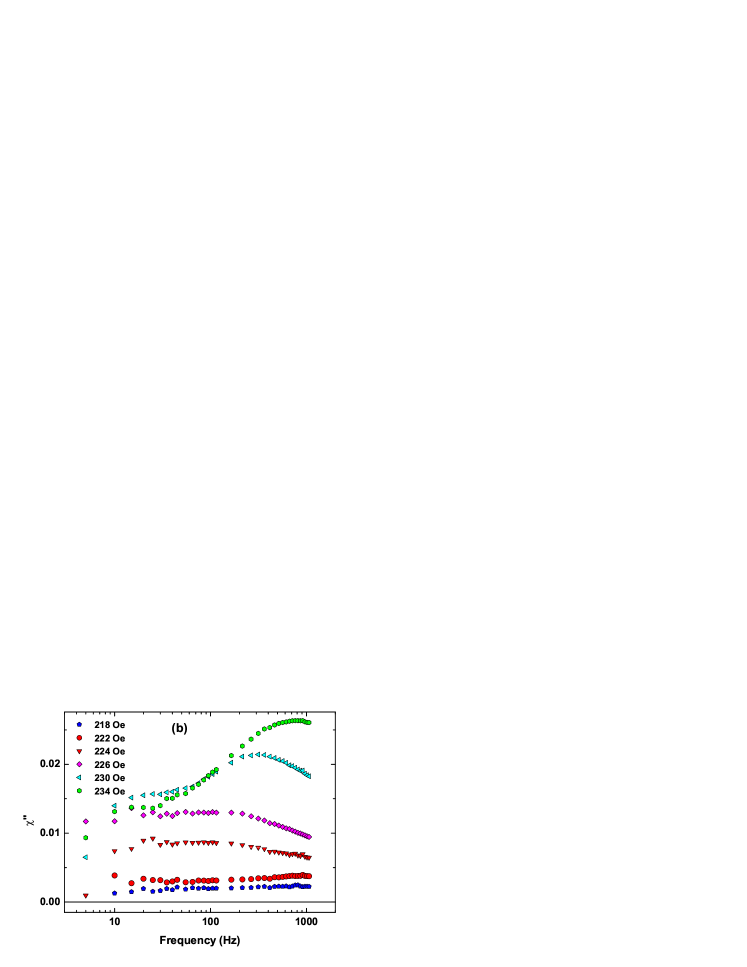
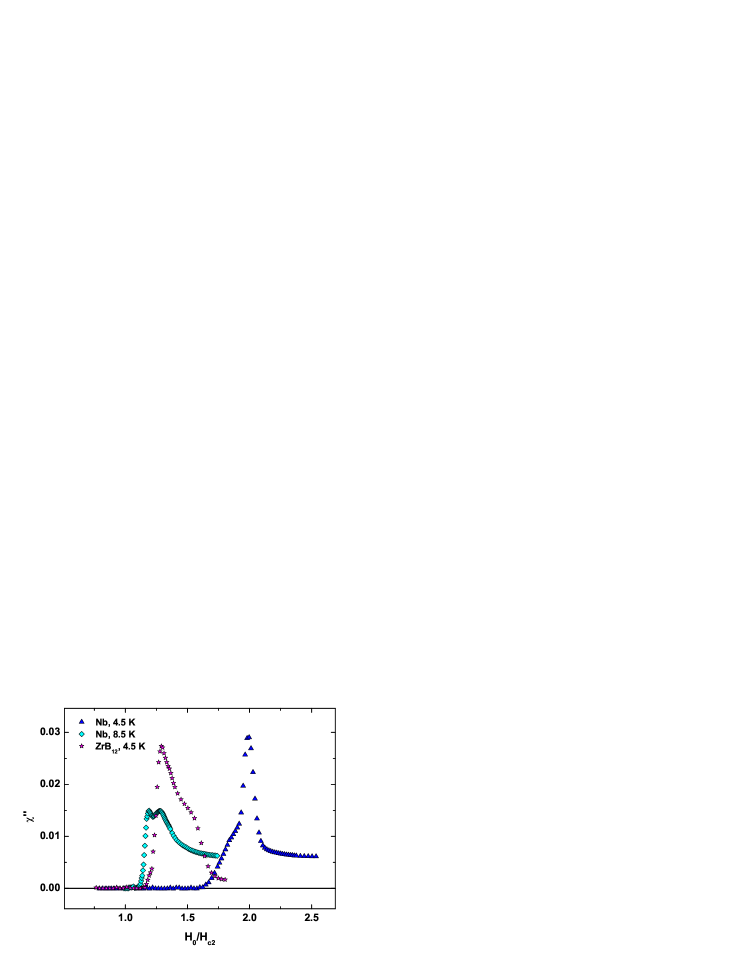
Figs. 3 and 4 demonstrate the frequency dependence of and for both Nb and ZrB12 crystals at dc magnetic field above . The character of these curves depends on the field. Thus is a concave function of at fields close to and is a convex function close to . For some fields, for both samples. Such a logarithmical dependence is typical of spin glasses which are completely different physical systems SG . Fig. 5 presents as a function of the reduced magnetic field, for two frequencies and temperatures for Nb and ZrB12 crystals. The ratio is temperature dependent as previously reported for Nb (e.g. HOP ).
IV Theoretical background
For interpretation of the experimental data we used the numerical approach to the normalized stationary GL equations
| (5) |
for an external magnetic field parallel to the sample surface. The order parameter, , is normalized with respect to its value at zero magnetic field, the distances with respect to the London penetration length , and the vector potential with respect to , where is the thermodynamic critical field. Assuming that the order parameter has the form of Eq. (1) with the yet as undetermined parameter , we see that is the integral constant of these equations, if the sample thickness considerably exceeds the coherence length and the superconductor is homogeneous. The relaxation time in the time-dependent version of GL theory is of the order of s and we can use the stationary version of the GL theory, Eq. (5), for the ac experiments. Equations (5) with proper boundary conditions and the requirement that the order parameter differs from zero only near the surface, have the solution for a whole band of values. But only one value of corresponds to the total surface current equals zero and this describes the equilibrium state with the minimal free energy. These nonlinear equilibrium surface solutions have been discussed in detail in FINK . The ac response for superconductors in fields differs from the normal one. This means that in an ac field the superconductor is in a nonequilibrium state with finite surface current and nonequilibrium . Generally speaking, the total surface current depends on both: the instant values of external magnetic field and on ,thus . If a small ac magnetic field is superimposed upon a dc field , the amplitude of the surface current in the linear approximation is
| (6) |
where is the equilibrium value of in a dc magnetic field , and describes the linear response of to an ac field Eq. (2). The partial derivatives in Eq. (6) ( and ) can be calculated numerically and in Fig. 6 we show the results for Nb (GL parameter HOP ) and ZrB12 ( TS1 ).
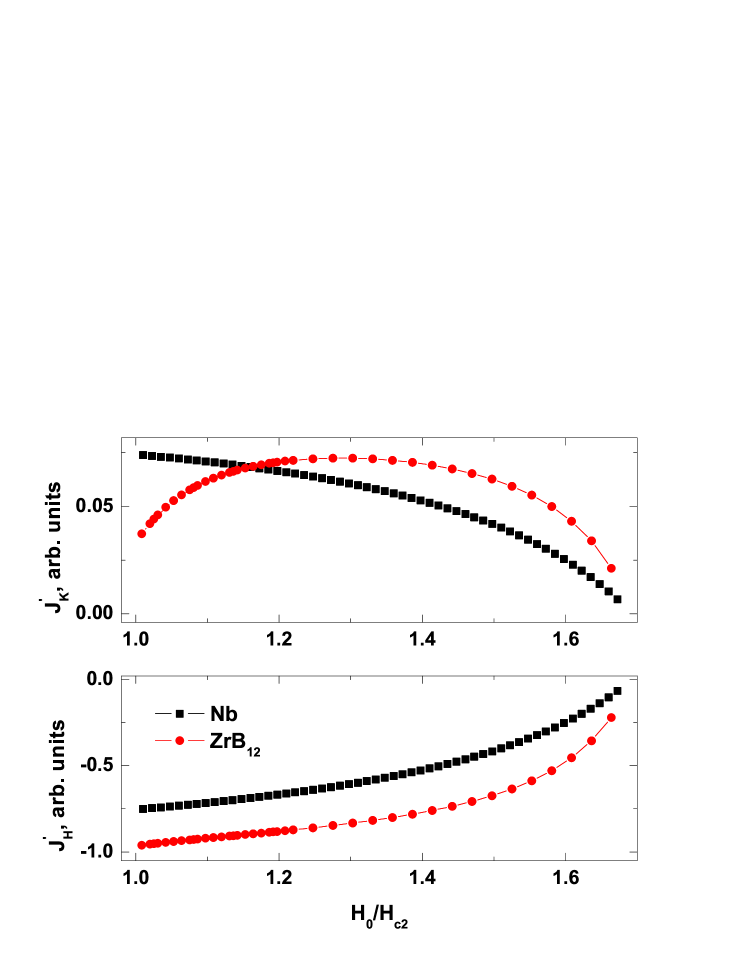
Equation (6) describes the linear response of the surface current to an external ac magnetic field. If does not change during an ac cycle, we see from Fig. 6 that only a smooth decrease of the surface current without any losses should be observed, as the dc magnetic field increases. The critical current model assumes that for , where is some critical ac field, the surface current follows the external magnetic field without any delay, , and therefore surface losses are absent.
V Discussion
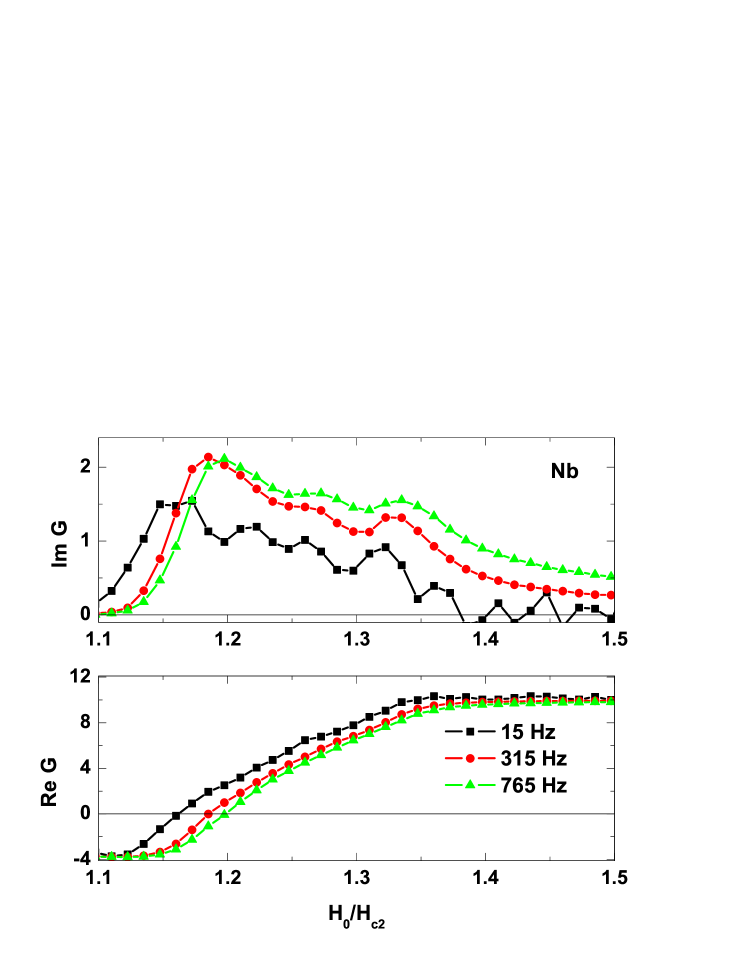
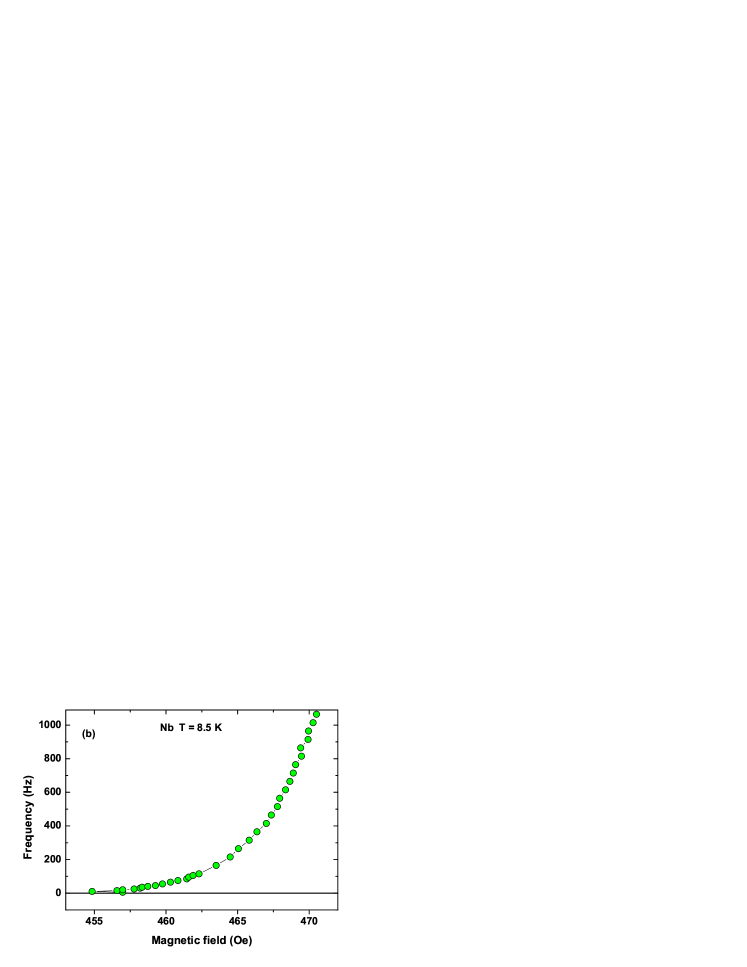
It is clear that the experimental data show the existence of SSS in our crystals. Usually is defined by the onset of the surface screening, i. e. by the appearance of the deviation of the ac response from its normal value, as the dc field decreases from some large value. Because in the SSS the ac response is frequency dependent, using of low frequencies could give the underestimated value of . As an example, in Fig. 7a we show a set of data obtained for Nb sample at 8.5 K, at frequencies 115, and 765 Hz.
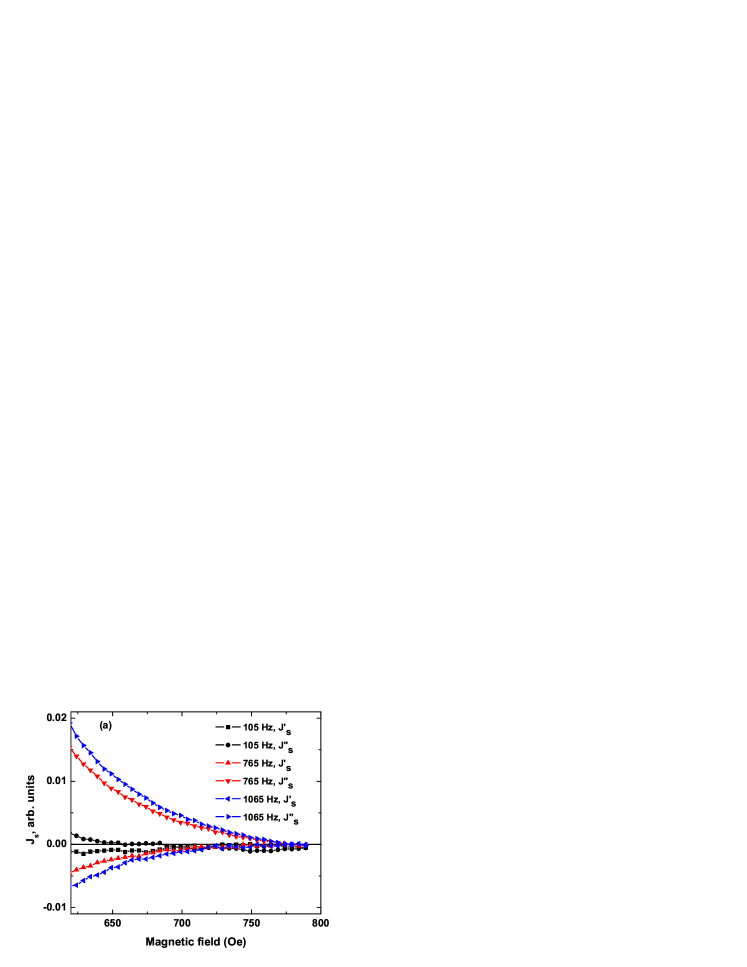
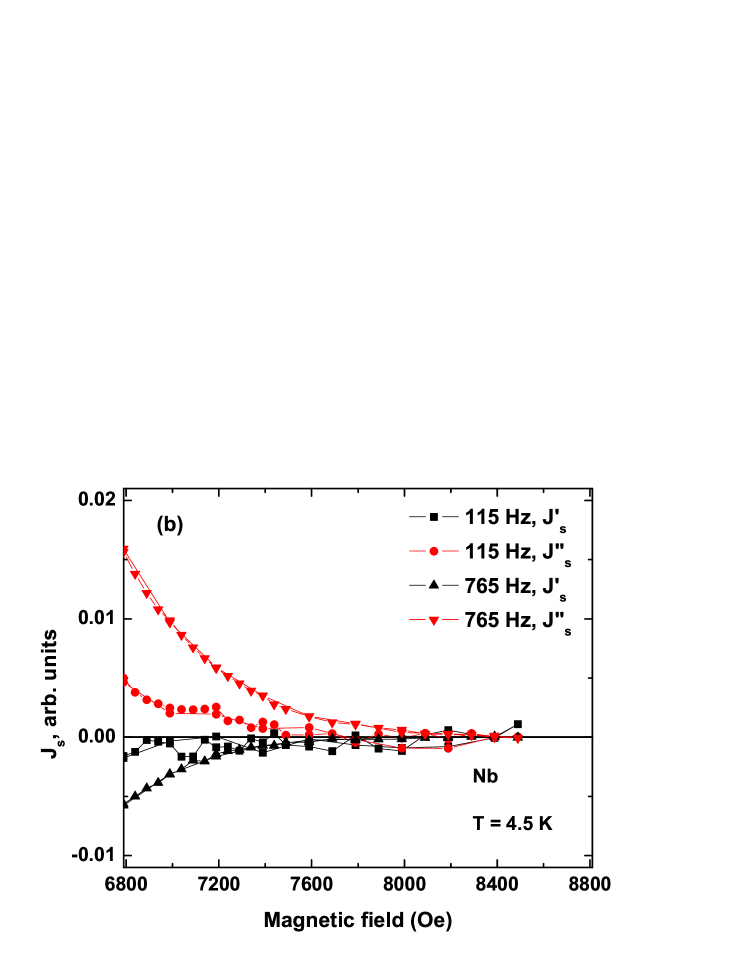
The imaginary part of surface current is more sensitive for determination (obviously, the experimental setup sensitivity is higher at higher frequencies). The data at a frequency of about 100 Hz yield Oe, while at higher frequencies ( Hz) we obtain Oe, in the later case . This value is considerably larger than the value predicted 1.69 in Ref. PG With decreasing the temperature, the discrepancy between the theoretical prediction PG and the experimental values increases and the ratio at K becomes (Fig. 7b). The decrease of this ratio for temperatures in the vicinity of , was found in several experiments HOP ; OST and it was associated with the decrease of near the surface HU . In the framework of the GL theory the ratio can be changed only if (i) either in the surface layer differs from the bulk value, or (ii) the slope of the wave function at the surface differs from zero ANG ; JOI . In Fig. 8 we show the calculated () for these two cases.
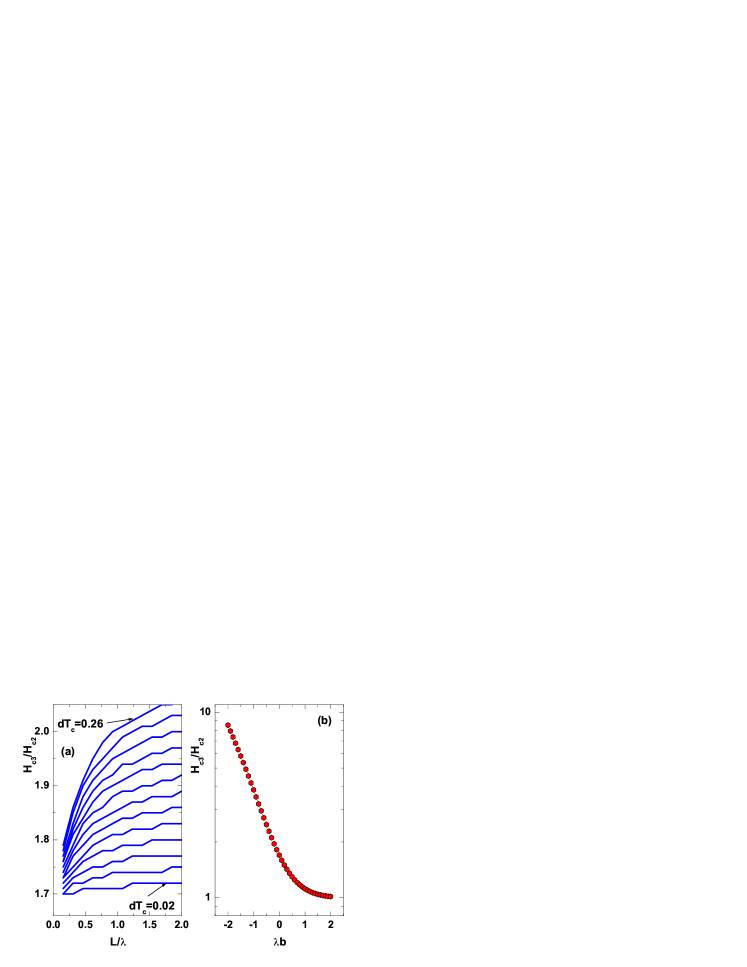
(a) in the surface layer (of thickness L) is higher than in the bulk value see Eq. (7));
(b) the slope of the wave function, , at the surface is different from zero ().
The boundary condition for the first case is but the values of a surface layer with thickness , increases as:
| (7) |
(Fig. 8a). In the second one,(when ), we assume that (Fig. 8b). The ratio of at 8.5 K, this can be a result of either the enhanced by 0.13 K () at the surface layer with the thickness of , or, by assuming . Decreasing the temperature results in an increase of both: and the ratio. At K, and from Fig. 8a, one finds that the value of the ratio cannot exceed 1.75. Therefore, if the GL theory is applicable, than, at K, the growth of the ratio to 2.34 in Nb crystal is due to , and the absolute value of increases with decreasing temperature.
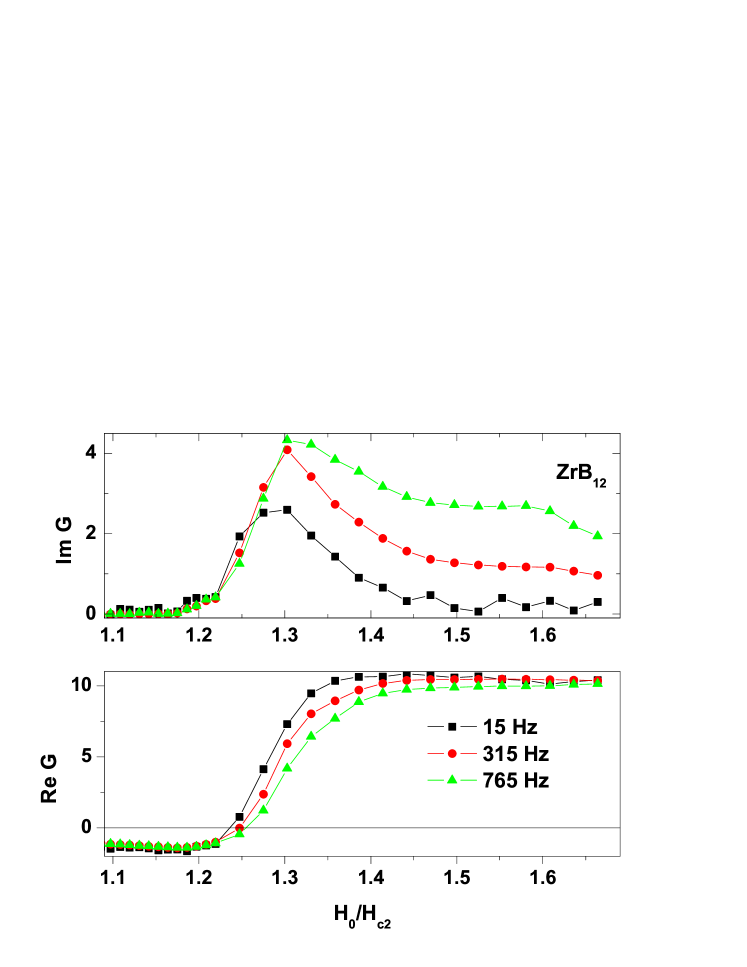
The behavior of the ZrB12 crystal is similar. The ratio increases from 1.5 at 5.5 K to 1.75 at 4.5 K. Since the ratio at 5.5 K is smaller than 1.69, it is possible that of the surface layer is smaller than that of the bulk. Our calculation shows that this value (1.5) can be obtained, for example, if and . For K the dimensionless is equals to 0.05 and ratio does not exceed 1.65. We notice that in order to explain the ratio, one has to take into account the nonzero slope of the wave function at the surface.
In general, with decreasing the dc field from its maximal value, both the real and imaginary parts of the surface current appear simultaneously, but at the beginning the imaginary part increases faster than the real one. On the other hand, at a complete screening takes place and the absolute value of reaches its maximal value, , while . So at some dc magnetic field will be equal to . This point was identified in Ref. JUR as the percolation transition from noncoherent SSS to the coherent one in the Nb sample. For our Nb crystal, at K and frequency 20 Hz it occurs at , a value which is slightly smaller than the value 0.81 reported in JUR . However, our data presented in Fig. 9 does not permit us to consider this point as a phase transition, due to a smooth maximum at this field and the absence of any peculiarity in .
The response of to an ac field is described by the function which can be found from Eq. (6). Figs. 10a, 10b show as a function of a reduced magnetic field at several frequencies.
Generally, depends on the frequency. Moreover, the real part of , changes its sign with increasing the dc field. The frequency dependence of of the Nb crystal for several magnetic fields near the loss peak, presented in Fig. 10 is shown in detail in Fig. 11a.
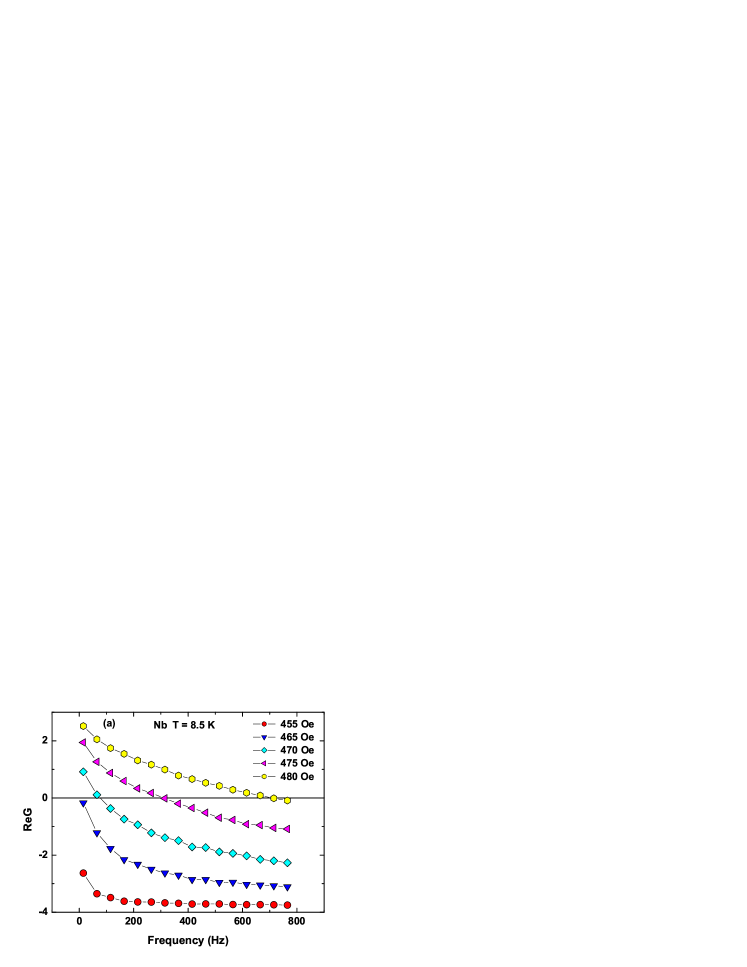
(b) Dispersion relation of the surface mode, for Nb sample at K
For some magnetic fields changes its sign as the frequency increases. The zero in the real part of the response function can be considered as the manifestation of the existence of unknown collective mode in the system. In Fig. 11b we show the frequency of this hypothetical surface mode as a function of the dc field for Nb at 8.5K. The dynamics of cannot be described by the first order linear differential equation:
| (8) |
with some relaxation constant and . Equation (8) gives the real part , which does not change its sign with frequency. One could expect that the second order differential equation will give adequate description of the observed response. But our experimental data show, that cannot be obtained from a differential equation of comparatively low order.
The observed logarithmic frequency dependence of , Fig. 4a for some dc fields, resembles the response of a spin-glass system. But in spin-glass materials is a slow function of the frequency as compared to . Our data show that the and values, both depend on the frequency. Probably, similar to the spin-glass systems, we have here a lot of clusters which are governed by the second order differential equation, thus the observed response is the average over all clusters. The second order differential equation
| (9) |
with has a response that changes its sign at . Assuming that for all clusters increases with the dc field, we find, that the dc field value for which must increase with the frequency, as observed in Fig. 10. The quantity in this case will be the frequency of the surface collective mode. The dispersion relation of this mode, , for Nb is shown in Fig. 11b.
Further insight into the low-frequency response can be obtained from the Kramers-Kronig relation LL
| (10) |
where . If we chose then:
| (11) |
The left side of this equation can be extracted from the available experimental data. By presenting it as a linear function of one can obtain the averaged imaginary part at low frequency, defined as:
| (12) |
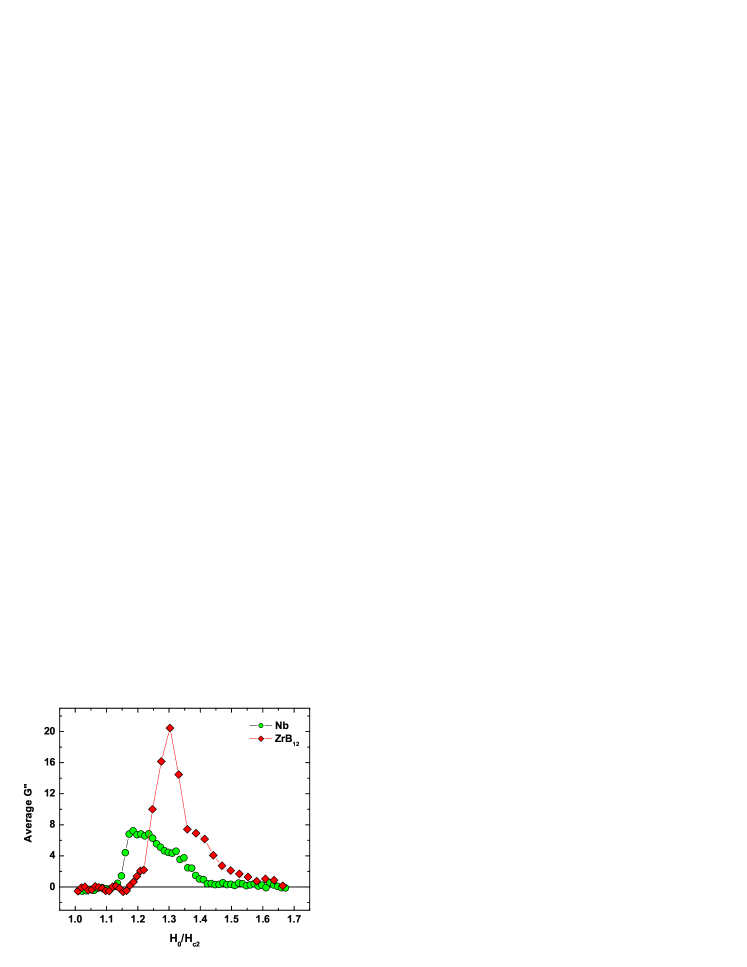
In Fig. 12 we have shown the averaged imaginary part of (), obtained for Nb at K, using s-1, s-1. in Fig. 12, is considerably larger than any value shown in Fig. 10. So the Kramers-Kronig relations predict the existence of large loss peak at low frequencies. This prediction needs a further experimental evidence.
The observed ac response of SSS has a very complex character. Partially, it can be the result of non-homogeneity of the samples. The parameter, as it was introduced by Eq. (1), corresponds to the wave function of the whole sample. In real samples, due to inhomogeneity, is not the integral constant of the GL equations and the exact wave function is the superposition of states with different . Those states can relax with different relaxation times as in spin-glass systems SG , and therefore we observe such complicated responses. In addition, the dynamics of the surface state is not described by a first order simple relaxation equation. As a result, we obtain the logarithmic frequency dependence of the real part of the susceptibility, as in spin-glass systems, but the imaginary part shows a maximum at some frequency.
VI Conclusions
In this paper we have presented investigation of the linear ac susceptibility of Nb and ZrB12 single crystals in the surface superconducting state. Losses in this state have a linear origin, and the critical state model for the surface current does not apply here. Similar to spin-glass systems (where finite losses at considerably low frequencies exist), the real part of susceptibility exhibits a logarithmic frequency dependence. But the out-of-phase component has a frequency dispersion. This dispersion in SSS differs from that of the spin-glass systems. We assume that the sample surface presents a lot of superconducting clusters, which are governed by second order differential equation, and the observed response is an average over these clusters. The Kramers-Kronig analysis of experimental data reveals huge absorption peak at low frequencies. The response of to the ac magnetic field defined by Eq. (1), , has been measured.
VII Acknowledgments
This work was supported by the INTAS program under the project No. 2001-0617 and by the Klatchky foundation for superconductivity. We wish to thank Professors M. Gitterman, B. Rosenstein, and B.Ya. Shapiro for many helpful discussions.
References
- (1) D. Saint-James and P.G. Gennes, Phys. Lett. 7, 306 (1963).
- (2) M. Strongin, A. Paskin, D. G. Schweitzer, O. F. Kammerer, and P. P. Craig, Phys. Rev. Lett. 12, 442 (1964).
- (3) A. Paskin, M. Strongin, P. P. Craig, and D. G. Schweitzer, Phys. Rev. 137, A1816 (1965).
- (4) J. P. Burg, G. Deutscher, E. Guyon, and A. Martinet, Phys. Rev. 137, A853 (1965).
- (5) R.W. Rollins and J. Silcox, Phys. Rev. 155, 404 (1967).
- (6) H.R. Hart, Jr. and P.S. Swartz, Phys. Rev. 156, 403 (1967).
- (7) M.I. Tsindlekht, I. Felner, M. Gitterman, B.Ya. Shapiro, Phys. Rev. B, 62, 4073 (2000).
- (8) J. Kötzler, L. von Sawilski, and S. Casalbuoni, Phys. Rev. Lett. 92, 067005-1 (2004); S. Casalbuoni, E.A. Knabbe, J. Kötzler et al., Nucl.Instr. Meth. Phys. Res., A538(2005),pp.45-64.
- (9) A. K. Geim, S. V. Dubonos, J. G. S. Lok, M. Henin, J. C. Maan, Nature bf 396, 144, (1998).
- (10) J. Scola, A. Pautrat, C. Goupil, L. Mechin, V. Hardy, and Ch. Simon, Phys. Rev. B 72, 012507 (2005).
- (11) H.J. Fink and S.B. Haley, Int. J. Mod. Phys. B 17, 2171 (2003), cond-mat/0303121.
- (12) Xing-Bin Pan Commun. Math. Phys. 228, 327, (2002).
- (13) Y. Almog, J. Math. Phys. 45, July (2004).
- (14) A. Rydh, U. Welp, J.M. Hiller, A.E. Koshelev, W.K. Kwok, G.W. Crabtree, K.H. P. Kim, K.H. Kim, C.U. Jung, H.-S. Lee, B. Kang, and S.-I. Lee, Phys. Rev. B 68, 172502 (2003).
- (15) G.I. Leviev, V.M. Genkin, M.I. Tsindlekht, I. Felner, Yu.B. Paderno, V.B. Filippov, Phys. Rev. B71, 064506 (2005).
- (16) K. H. Fischer and J. A. Hertz, Spin Glasses, (Cambridge University Press, Cambridge, 1993).
- (17) L. Lundgren, P. Svedlindh and O. Beckman, JMMM, 25, 33 (1981).
- (18) E.A. Andrushin, V.L. Ginzburg, A.P. Silin, UFN 163, 105 (1993).
- (19) M.I. Tsindlekht, G.I. Leviev, I. Asulin, A. Sharoni, O. Millo, I. Felner, Yu.B. Paderno, V.B. Filippov, and M.A. Belogolovskii, Phys. Rev. B 69, 212508 (2004).
- (20) D. Shoenberg, Magnetic oscillations in metals, (Cambridge University Press, Cambridge, 1984).
- (21) L.D. Landau, E.M. Lifshits, Electrodynamics of Continuous Media (Pergamon Press, Inc., Oxford, 1984).
- (22) J.R. Hopkins and D.K. Finnemore, Phys. Rev. B 9, 108 (1974).
- (23) H.J. Fink, R.D. Kessinger, Phys. Rev. 140, A1937 (1965).
- (24) J.E. Ostenson and D.K. Finnemore, Phys. Rev. Lett. 22, 188 (1969); F. Cruz, M.D. Maloney and M. Cardona, Phys. Rev. 187, 766 (1969).
- (25) C.R. Hu, Phys. Rev. 187, 574 (1969).
- (26) H.J. Fink, W.C.H. Joiner, Phys. Rev. Lett. 23, 120 (1969).