Oxygen isotope effect and phase separation in the optical conductivity of (La0.5Pr0.5)0.7Ca0.3MnO3 thin films
Abstract
The optical conductivities of films of (La0.5Pr0.5)0.7Ca0.3MnO3 with different oxygen isotopes (16O and 18O) have been determined in the spectral range from 0.3 to 4.3 eV using a combination of transmission in the mid-infrared and ellipsometry from the near-infrared to ultra-violet regions. We have found that the isotope exchange strongly affects the optical response in the ferromagnetic phase in a broad frequency range, in contrast to the almost isotope-independent optical conductivity above . The substitution by 18O strongly suppresses the Drude response and a mid-infrared peak while enhancing the conductivity peak at 1.5 eV. A qualitative explanation can be given in terms of the phase separation present in these materials. Moreover, the optical response is similar to the one extracted from measurements in polished samples and other thin films, which signals to the importance of internal strain.
I Introduction
Few compounds manifest a so ample variety of phases as the manganite perovskites when conditions such as magnetic field, temperature, or doping are changed. La1-xCaxMnO3, a particular well studied family of manganites, is an example of this as can be seen from its phase diagram given in Fig. 1a.millis-review It is evident that the particular ground state of the manganites depends on the ratio of Mn3+ to Mn4+ given by the hole doping . At a doping between about 0.17 and 0.5 the low-temperature phase is metallic and ferromagnetic, which is commonly attributed to the double exchange mechanism. zener
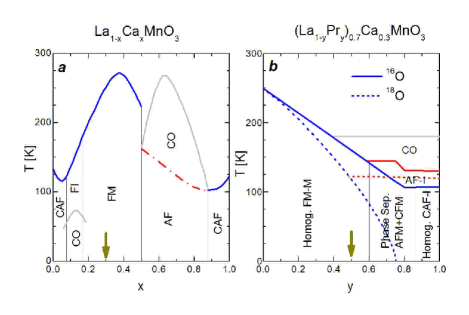
The ground state also depends on specific lattice characteristics: Mn-O and cation-O bond lengths, and cation-O-cation bond angles. These bond characteristics depend, in turn, on the average cation radius, .hwang At a given hole doping, the direct influence of can be studied by replacing the rare earth with another. However, this replacement can also induce disorder if exceeds certain critical value.rodriguez (La1-yPry)0.7Ca0.3MnO3 is particularly suitable to study the effect of the average cation radius as it always remains below the critical value.balagurov-prb64 Neutron diffraction experiments in this systembalagurov-prb64 have revealed the phase diagram shown in Fig. 1b (solid lines). At low temperatures, as the Pr concentration increases, the system goes from a homogeneous ferromagnetic metal to a homogeneous canted antiferromagnetic insulator. Between these two extremes, the neutron diffraction databalagurov-prb64 suggests the presence in the system of two different phases, one is antiferromagnetic while the other is canted ferromagnetic.
Phase separation seems, indeed, to be a common feature of strongly correlated systems (see Ref. khomskii, and references therein). For example, the double-exchange model has a natural tendency towards phase separation at low doping.khomskii ; moreo ; kagan The regions formed in this way are one of an undoped antiferromagnet and one of higher electron (or hole) concentration which is ferromagnetic (or strongly canted) and metallic.khomskii However, the long-range Coulomb forces compete against phase separation forcing the phase domains to be rather small.khomskii ; moreo It is important to mention that there can also be phase separation between electron rich regions and charge ordered regions. khomskii Several experimental techniques yield a strong evidence for phase separation in the manganites (see Refs. khomskii, and moreo, for a review, and Ref. phase-sep-films, for experiments specific to thin films).
Another striking phenomenon observed for certain compositions is the strong oxygen isotope effect. zhao-nature ; babushkina-nature For instance, the effect of oxygen isotope substitution (16O 18O) has been studied in various members of the (La1-yPry)0.7Ca0.3MnO3 family. babushkina-jpcm11 ; babushkina-nature In the paramagnetic state neither the lattice parameters, balagurov-prb60 nor the DC conductivities babushkina-jpcm11 ; babushkina-nature are noticeably modified by the isotope exchange. At low temperatures, however, the situation is drastically different. Samples containing heavier 18O atoms present lower ’s and less metallic conductivity. In particular, for , the isotope substitution does even induce a metal-insulator transition.babushkina-nature Thus the lattice dynamics clearly plays an important role in the charge transport and spin ordering in manganites.
Several mechanisms have been formulated to explain the isotope effect. Alexandrov and Bratkovsky described the isotope dependence in terms of polaron-bipolaron dynamics.alexandrov Alternatively, it has been attributed to a slight oxygen-mass dependence of the lattice Debye-Waller factor and, therefore, the hopping parameter and bandwidth , which is close to the critical value.babushkina-jap83 In order to be so sensitive to the oxygen mass, the system has to be at the verge of the metal-insulator transition. This sensitiveness can also be related to phase separation.khomskii As seen in Fig. 1b, (La0.25Pr0.75)0.7Ca0.3MnO3 (with 16O) seems to be in a phase-separated state. Then, the small changes produced by the isotope substitution would favor one phase over the other producing the metal-insulator transition.
The isotope effect has also been studied in thin films of (La0.5Pr0.5)0.7Ca0.3MnO3 grown in either LaAlO3 (LAO) and SrTiO3 (STO). babushkina-prb59 ; babushkina-epjb19 For the films grown in LAO, the isotope substitution produces a metal-insulator transition similar to the one seen in ceramic samples of (La0.25Pr0.75)0.7Ca0.3MnO3. babushkina-epjb19 ; babushkina-prb59 Although for films grown in STO no metal-insulator transition was observed, the samples with 18O exhibit a much lower and the value of the DC conductivity () at low temperatures is one order of magnitude lower than those containing 16O. The sensitivity to the substrate material arises from the different strains they support due to mismatches between the lattice parameters of the film and the substrate. babushkina-epjb19 When grown in LAO, the films are contracted in plane but stretched perpendicularly. The opposite is true for films grown in STO. These deformations are reflected in the magnitude of the Mn-O-Mn bond angles. Compared to the ceramic samples, this angle is increased for films in STO and decreased for LAO. This structural difference puts the films grown in LAO at an angle closer to the critical value corresponding to localization of carriers (remember that the conduction bandwidth depends on the cosine of the Mn-O-Mn angle). babushkina-epjb19
Optical spectroscopy, which probes charge dynamics, has played an important role in studying the physics driving the behavior of manganites. millis-sw-cmr It has been found okimoto ; quijada that the metal-insulator transition is accompanied by a large redistribution of optical spectral weight, mainly below 4 eV. It indicates the energy scale of the most important electronic interactions making up the phase diagram, such as the on-site Hunds’s rule interaction or polaron activation energy. The value of the electronic kinetic energy, derived from the integrated optical conductivity, has been a key ingredient of the quantitative verification of the double-exchange scenario in manganites.millis-sw-cmr ; michaelis
Optical conductivity has also offered some indications of phase separation occurring at some specific concentrations. moreo For example, let us consider La7/8Sr1/8MnO3 jung-lsmo which remains insulating even below . Its optical conductivity does not show any Drude contribution but a mid-infrared (MIR) peak appeared at around 0.4 eV below . jung-lsmo This peak was assigned to a small polaron absorption and it was noticed that the temperature dependence of its spectral weight resembles a percolation-type transition. jung-lsmo In fact, Moskvin et al. moskvin-effmedium have been able to describe the temperature dependence of the optical conductivity in this compound by using an effective medium approximation assuming that metallic spherical regions are embedded into an insulating matrix (LaMnO3). In this approximation the MIR peak is a geometric resonance whose position is mainly determined by the shape of the metallic regions. moskvin-effmedium
Such MIR peak has also been seen in the FM metallic part of the phase diagram. kim-lcmo ; kim-lpcmo ; jung-lcmo It is already visible at high temperatures but below its intensity increases being also accompanied by a narrow Drude peak. This behaviour suggested the change from a small to a large polaron. kim-lcmo However, in contrast to the experiments performed on polished samples, experiments on cleaved single crystals takenaka-cleaved show, the development of only a broad zero-centered peak. The difference in the results emphasize the sensitivity of the manganites to static imperfections and/or structural strain. takenaka-cleaved
Optical experiments in thin films have also shown the presence of a narrow Drude-like mode and a MIR peak in FM-metallic samples (see, for example, Refs. quijada, and hartinger, ). These MIR peaks have also been assigned to polaronic absorptions. Particularly, it was possible to distinguish between small and large polarons in La2/3Ca1/3MnO3 and La2/3Sr1/3MnO3, respectively. hartinger In contrast to the work of Kim et al.kim-lcmo (discussed above), Hartinger and collaborators made the assignment by fitting the optical conductivity to the corresponding theoretical expressions. hartinger Evidence of phase segregation has also been inferred from measurements of the absorption coefficient in manganite thin films (see Refs. moskvin-jt, ; moskvin-lcmo, ; loshkareva-isotope, and references therein).
In the present article we present for the first time, to our knowledge, the optical conductivity of manganites containing two different oxygen isotopes. Specifically, we studied films of (La1-yPry)0.7Ca0.3MnO3 () grown on SrTiO3. We will see that the isotope substitution produces changes in the optical conductivity at energies much larger than the phonon region. Both samples show a strong MIR infrared peak whose intensity decreases when temperature is increased. The spectral weight lost by this peak is mainly transferred to a peak lying at around 1.5 eV. By a detailed study of their temperature dependence we will argue that this behavior is consistent with phase separation.
II Experiment
II.1 Sample Preparation
Thin films of (La0.5Pr0.5)0.7Ca0.3MnO3 were grown on SrTiO3 using the aerosol MOCVD technique (for the details of the preparation and characterization see Ref. babushkina-epjb19, ). The films had a nominal thickness of 60 nm which was extracted more accurately from the optical measurements. For the isotope exchange two strips of mm2 were annealed simultaneously in different atmospheres. One of them was heated in a 16O2 atmosphere, while the other was heated in an oxygen atmosphere containing 85% of 18O2. Hereafter, these samples will be referred to as S16 and S18, respectively. The XRD analysis shows that the films are highly strained. babushkina-epjb19 As mentioned in the introduction, the STO lattice constants are larger than the film, which produces an in-plane expansion of the perovskite cube. In contrast, perpendicularly to the plane, the film is contracted. In this conditions, a buckling of the MnO6 octahedrons is expected. babushkina-epjb19
II.2 Optical Experiments
II.2.1 Transmission
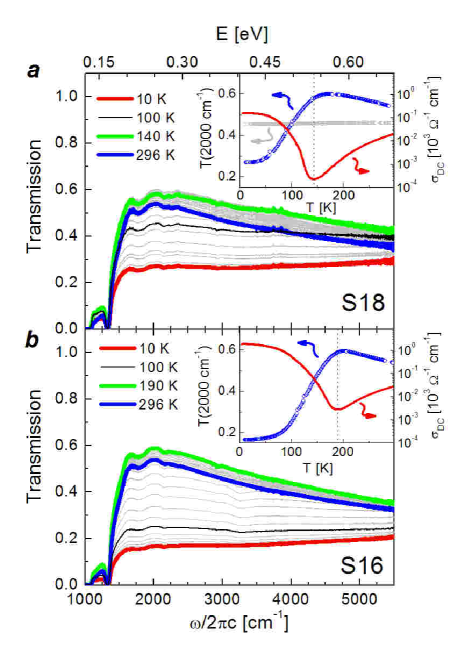
In the frequency region 1000 - 5000 cm-1 the optical transmission was measured using a Bruker 113v FT-IR spectrometer. Below this frequency the STO substrate is not transparent. The transmission was calibrated at room temperature against an aperture of the same size. For the temperature dependence of the transmitted intensity a home-built cryostat was used, the special construction of which guarantees the stable and temperature independent optical alignment of the sample. The measured intensities where then normalized to the room-temperature transmission. The results of these measurements are summarized in Fig. 2. The main panels show the absolute transmission measured while the temperature was increased. The insets show the temperature dependence of the transmissions at 2000 cm-1 and measured also in heating mode. in both films shows hysteresis, being rather large in the S18 samplebabushkina-epjb19 , which is probably an indication of the phase separation (see below).
II.2.2 Substrate
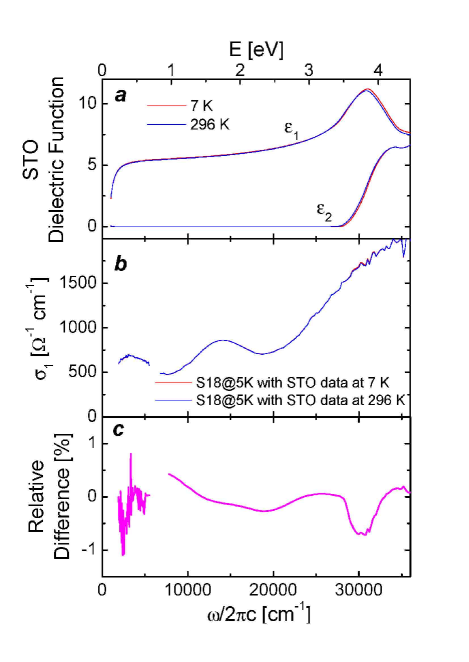
The optical properties of the STO substrate were determined below 6000 cm-1 using the combination of reflectivity and transmission. The complex dielectric function was then determined by numerically inverting the corresponding Fresnel equations. heavens Moreover, the temperature dependencies of transmission and reflectivity were measured. However, the dependence is much smaller than the changes in the films. As an example, the transmission of STO at 2000 cm-1 is shown in the inset of Fig. 2. Above 6000 cm-1, we have used ellipsometry in combination with transmission in order to obtain the dielectric function. The results at room temperature and 7 K are shown in the top panel of Fig. 3.
II.2.3 Ellipsometry
Ellipsometry of the samples was performed in the range 6000 to 36000 cm-1. We used a commercial (Woollam VASE32) ellipsometric spectrometer in combination with a home-made ultra high vacuum cryostat working at a pressure of about mbar. At this pressure, the effects of ice growth were not observable during the experiment.
The ellipsometry experiment was carried out in a grazing reflectivity configuration at an angle of incidence of 80∘. The necessary alignments were only performed at room temperature since the special construction of the cryostat allows only a small displacement of the cold-finger ( mm) in the whole temperature range. This displacement is much smaller than the size of the sample ( mm2). Moreover, the quartz windows used in the cryostat had a very small depolarizing effect of less than 1∘ for both and (see below) as it was checked separately. This small depolarization is achieved by an special mounting that minimizes mechanical strains.
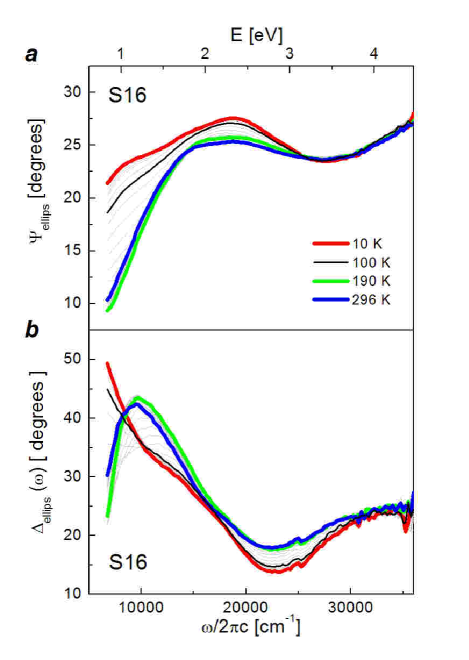
The outcome of the ellipsometry experiment are the ellipsometric parameters and that define the ratio between the Fresnel reflection coefficients for the - and -polarized light, . As an example of the results, we show in Fig. 4 the corresponding ellipsometric parameters for S16. The ratio , obviously, depends on the dielectric functions of both, substrate and film. Since we know the optical properties of the substrate, the complex dielectric function of the film, , was obtained by inverting numerically the analytical expression corresponding to for a two-layer system. heavens At different temperatures we used only the room temperature data for the substrate and also assumed a semi-infinite substrate. The real part of the optical conductivity, , obtained from this inversion is shown in Fig. 5.
II.2.4 Optical Conductivity in the MIR Range
Below 6000 cm-1, the complex dielectric function of the film was obtained using a similar approach to the one used in our previous experiments. mena-ms As a first step we performed a simultaneous fit to the DC conductivity, transmission of the film+substrate system (via the Fresnel equations), and the dielectric function of the film at higher frequencies. The fit used a model dielectric function which is the combination of one Drude and a limited number of Lorentz oscillators:
| (1) |
where , (plasma frequency), and (scattering rate) give respectively the position, strength, and width of the oscillator. is the high-frequency dielectric constant. This Drude-Lorentz (DL) fit sets extrapolations below and above the measured range. Finally, a Kramers-Kronig constrained variational fitting of spectra is used where every detail of the measured data is reproduced by introducing an arbitrary number of oscillators on top of the previous fit reffit-manual .
The real part of the optical conductivities obtained in this way are plotted in Fig. 5. As in the usual KK transformation, the obtained optical conductivity depends on the extrapolations. Since we have used the dielectric function obtained from ellipsometry at a rather broad energy range, the most influential are the low frequency extrapolations. To estimate the uncertainties coming from this factor, we have repeated the described procedure using different extrapolations (all of them congruent with the DC conductivity). The associated error bars are small for though rather large for the low-frequency . This is not a surprise since the transmission is mostly determined by the absorptive part of the optical conductivity, . Moreover, we have repeated the same calculations assuming an error as large as 5% in the measured transmission. The total uncertainty related with both sources of errors is indicated by the error bars of Fig. 5.
The last point we would like to comment in this section is the influence of the temperature-dependent variation of the substrate. This is indeed important as it turns out that the penetration depth of the films is of the order of the film thickness. Therefore, we have made a complete analysis of such effect in our data. With the raw data of the substrate+film system at 5K, we repeated the calculations described above but using the dielectric function of STO at low temperatures. The result of this analysis is presented in the middle and bottom panels of Fig. 3, which shows a variation smaller than 1% of the film optical conductivity. Consequently we may exclude any spurious effect on the dielectric function displayed in Fig. 5 due to the temperature dependence of the substrate.
III Results and Discussion
III.1 Optical Conductivity and Assignment of Peaks
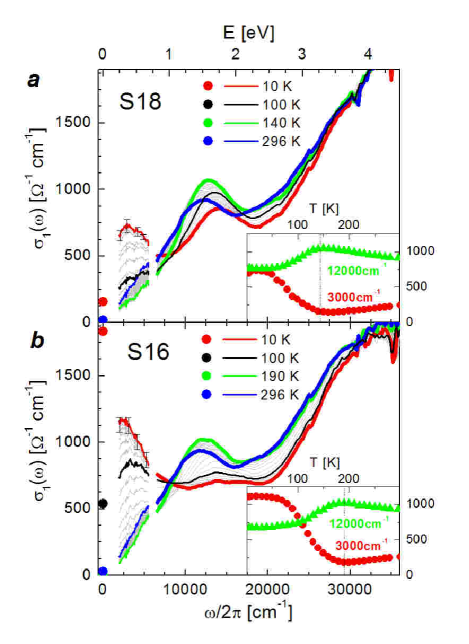
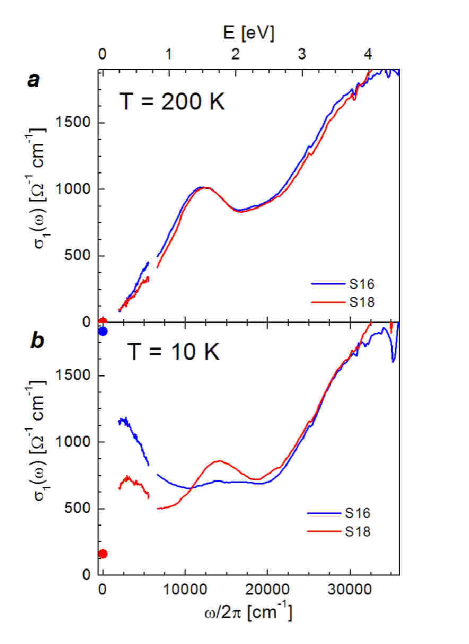
The obtained optical conductivities are shown in Figures 5 and 9. The most important observation is that, while above the samples with 16O and 18O have almost identical (Fig. 9a), at low temperatures significant differences appear (Fig. 9b). Nevertheless, even at low temperatures, the conductivities of the two isotope-substituted samples demonstrate qualitatively the same set of peaks (Fig. 6). This allows us to discuss the provenance of the main spectral features for the two samples.
In agreement with previous measurements (see, for example, Ref. quijada, ), we observe a significant transfer of spectral weight from the high-frequency region (1 - 4 eV) to low frequencies as the system goes from the paramagnetic to FM state (see the opposite trends in the temperature dependence of at 3000 cm-1 and 12000 cm-1, shown in the insets of Fig. 5). Also notice that at 3000 cm-1 the optical conductivity increase below is larger in the more metallic S16 sample. Other point to mention is that the frequency dependence of the optical conductivity, at different temperatures, is similar to that obtained from reflectivity measurements on polished samples. jung-lsmo ; kim-lcmo ; kim-lpcmo ; jung-lcmo ; okimoto In particular, both samples exhibit an MIR peak which seems to be accompanied by a narrow zero-frequency mode in the S16 sample. Note that Takenaka et al. takenaka-cleaved ; takenaka-L825S175MO ; takenaka-LSMO claimed that non-polished (cleaved) single crystals do not demonstrate any separation of the Drude and MIR peaks.
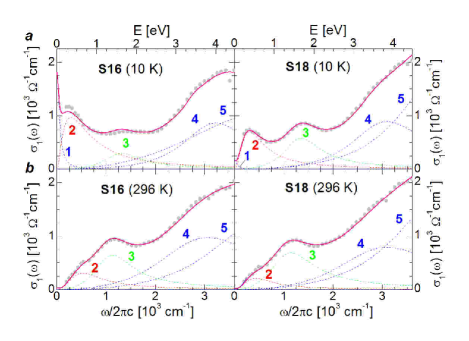
The DL oscillator fit described in Section II.2 allowed us to separate the different contributions to the optical conductivity and their temperature dependencies. At all temperatures and in both samples, we used the same number of oscillators. For example, at 10 and 296 K, the oscillators used in the fit can be seen in Fig. 6 while the fit parameters at 10 K are given in Table 1. The limited spectral range of our measurements did not allow us to extract the exact shape of the narrow Drude peak. Therefore we had to keep the width of the Drude peak constant at a small value and adjust its strength according to the value of . In our case the width of the Drude peak is largely an ad hoc assignment but it is in agreement with what has been seen in polished samples kim-lcmo and thin films hartinger . Nevertheless, it does not affect the main conclusions presented below. We have also fixed the position of the highest-frequency oscillator, which falls outside our spectroscopic window.
| Sample | ||||||||
|---|---|---|---|---|---|---|---|---|
| S16 | 8320 | 632 | 2853 (0.35) | 21154 | 7725 | 13155 (1.63) | 12872 | 9300 |
| S18 | 2449 | 632 | 3054 (0.38) | 15999 | 6132 | 13559 (1.68) | 18091 | 9426 |
| Sample | ||||||
|---|---|---|---|---|---|---|
| S16 | 32236 (3.99) | 29631 | 16843 | 43600 (5.41) | 55234 | 47633 |
| S18 | 30930 (3.84) | 31347 | 18300 | 43600 (5.41) | 53329 | 24540 |
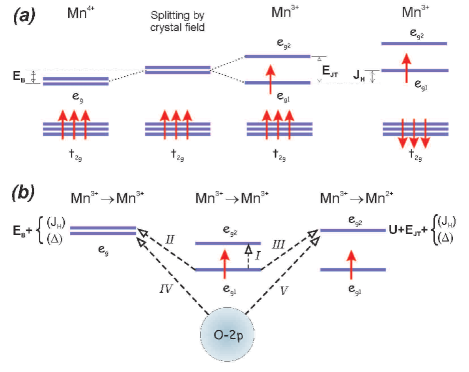
To facilitate further discussion, we reproduce in Fig. 7a the energy diagram proposed for the manganites (see the figure caption for details). millis-review ; quijada The possible transitions, depicted in Fig. 7b, are:
-
I: A transition between different levels in the same site. This transition is not dipole allowed and, therefore, is expected to be weak. quijada ; millis-Fl2polaron However, it has been argued noh ; chen that due to the strong hybridization between the and O- bands, and the strong local distortion of the Mn-O octahedra, these transitions can be allowed.
-
II, III: Interatomic transitions, i.e. from a Mn3+ ion to either another Mn3+ ion or to a Mn4+ ion. In both cases, the promoted electron can end up being parallel or antiparallel to the core spin.
-
IV, V: Charge transfer transitions, O-.
Now we address the possible assignments to the peaks recognized by the DL fit (see Fig. 6). Let us start from the high frequency features. The strong absorption starting at around 2.5 eV is represented by peaks 4 and 5 which, taken together, show a small temperature dependence and almost no isotope effect. There is a general consensus that this feature stems from the charge-transfer transitions (IV and V) from the O- band to bands of Mn- character, namely the unoccupied levels. quijada ; noh ; okimoto
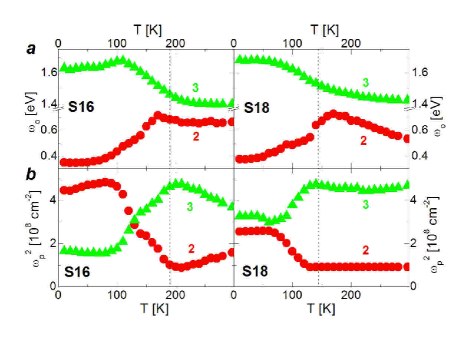
The most interesting oscillators are the two low-frequency peaks, 2 ( 0.5 eV) and 3 ( 1.5 eV), which show a strong temperature dependence (see Fig. 6). At high temperatures, in both samples, only peak 3 is clearly visible and does not significantly change down to . From this point its intensity decreases in favor of peak 2. This transfer of spectral weight is accompanied by a small displacement of peak 2 to low frequencies and some shift of peak 3 towards high frequencies. This process stops at around 100 K in S16 and 75 K in S18. Thus, one can conclude that peak 2 is more favored in the metallic state, while peak 3 is characteristic of the insulating phase.
Peak 2 most likely corresponds to the processes II or III, where the spin of the final state is parallel to the core. The fact that it does not form a Drude peak is due to its polaronic nature, probably enhanced by strains present in films and polished samples. There has also been some discussion about whether it transforms from small to large polaron or remains small in the whole temperature range (the first has been suggested from studies in La1-xCaxMnO3kim-lcmo and several compounds of the form A0.7R0.3MnO3 (A = Nd, La; R = Sr, Ca)quijada ; millis-Fl2polaron while the second has been proposed by studying La2/3Ca1/3MnO3 thin films). A careful fit to the corresponding analytical expressions allowed to recognize, at least in La2/3Ca1/3MnO3, as always being a small polaron. hartinger The temperature dependence of its position was found to be much larger than in the case of La2/3Sr1/3MnO3 where the polaron seems to be large. The temperature dependence of the position of peak 2, in both S16 and S18, is more similar to the one found for the small polaron case.
Peak 3 has been given two interpretations. From studies in various samples of La1-xCaxMnO3jung-lcmo , it has been assigned to a transition of type I (see also the theoretical analysis given in Ref. chen, ). This kind of transition, though not allowed, can be enhanced by local distortions and strong hybridization. It was also argued that its spectral weight decreases with temperature lowering because lattice distortions also become weaker. noh However, a dipole forbidden transition is unlikely to have such a large spectral weight possessed by peak 3. To our point of view, a more probable candidate is an interatomic transition II or III where the final state is antiparallel to the core spin. okimoto This gives a rather small value of of about 0.75 eV. Recent dynamical mean-field calculations michaelis of the critical temperature, spin-wave stiffness, and optical spectral weight changes provided a two times larger value of , which is nevertheless much closer to 0.75 eV compared to initial estimates. chatto In a homogeneous fully spin-polarized state the antiparallel process should disappear. However, we observe, that even at low temperatures the intensity of peak 3 remains finite. We will see later, that this can ascribed to the formation of an phase-separated state, which consists of insulating and conducting domains.
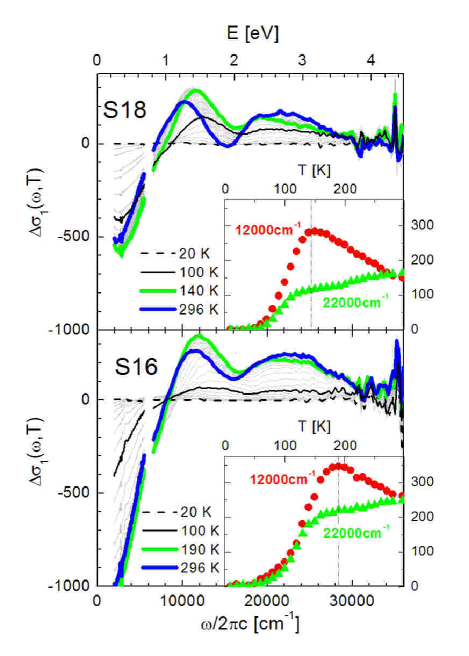
Regarding this assignment of peak 3, we have to mention that in their study of compounds of the form A0.7R0.3MnO3 (A = Nd, La; R = Sr, Ca), Quijada et al.quijada associated the antiparallel transitions with a feature at 3 eV (giving eV) observed on the differential conductivity spectra. Following the same procedure, we plot the difference between at any given temperature and at 10 K (see Fig. 8). As in Ref. quijada, , we can also see that the conductivity in a broad region around 2.7 eV (22000 cm-1) is suppressed below . However, the temperature dependence of conductivity at 2.7 eV, seen in the insets in Fig. 8, does not show any feature at that would be natural to expect from transitions which are so sensitive to the magnetic order. On the other hand, the temperature dependence at about 1.5 eV (12000 cm-1) does show a clear feature at , giving extra support for our assignment.
Another relevant issue is the importance of the correlation (or Hubbard-) effects. A large value of would shift the energy of the process of type III or V to higher energies. For the configuration, which is the case for the Mn3+ atoms, the lower estimate of is about 1.3 eV if a full metallic screening is assumed. marel_sawatzky In manganites the screening is expected to be smaller, thus giving an even larger value of . The analysis of photoemission and X-ray absorption spectroscopy park ; saitoh yields at least larger than 3 eV. Then we have to conclude that transitions of the type III and V are located at rather high frequencies. However, in Ref. michaelis, it has been argued that the integrated conduction-band spectral weight agrees well with the band calculations, meaning that the spectral weight transfer due to the Hubbard- effects is small.
III.2 Phase Separation
Substitution of 16O with 18O makes the system less metallic in the FM state, without affecting it noticeably above . In accordance, as can be seen in Fig. 9b, the conductivity of the sample S18 shows at low temperature a much larger peak at 1.5 eV (characteristic of the insulating state) and much smaller peak at 0.5 eV (characteristic of the ferromagnetic metallic state) compared to the sample S16. What is interesting, however, is that the effect of the isotope exchange on finite-frequency conductivity is yet much smaller than the one on the DC conductivity (the ratio of ’s amounts to more than one order of magnitude for our samples). In view of numerous indications of the phase separation in manganites (see Ref. moreo, and references therein; see also Ref. phase-sep-films, ), it is reasonable to associate the different scale of the isotope dependence of with the percolation of conducting domains.
The idea of phase separation is intimately related with the oxygen isotope effect itself. In this scenario, khomskii at high temperatures the insulating phase is dominating. When the temperature is lowered, there is first tendency to charge ordering (with ) in the insulating phase. Below , FM metallic droplets start to form until their relative volume ratio stabilizes. The temperature variation of the spectral weights of peaks 2 and 3 are consistent with this interpretation (see Fig. 10). That is, at low temperatures, the intensity of both peaks tends to saturate. Moreover, this temperature dependence is similar to the one seen in the MIR peak of La7/8Sr1/8MnO3 where it was also suggested to be caused by phase separation. jung-lsmo
The changes in the optical conductivity produced by the isotope substitution are also consistent with phase separation. In this picture, the large isotope effect seen in these compounds results from the fact that the small change induced by the isotope substitution shifts the relative stability of one phase over the other, especially close to the phase boundary. babushkina-jap83 In the present case, the substitution favors the insulating phase. Accordingly, we can see this effect when comparing the strengths of peaks 2 and 3 between S16 and S18 at the lowest temperature. In S18 (the less metallic of the two), the former oscillator is weaker while the latter is stronger.
As discussed in Ref. babushkina-jap83, , the isotope substitution changes the effective hopping integral, , which actually determines the relative stability of the different phases. The change produced by the isotope substitution is small but can be enhanced if the charge carriers have polaronic nature. This, as we have seen in the previous section, is the case in the samples studied here, and may help to explain the large isotope effect.
We also would like to remark that the phase separation scenario seems to be relevant only to samples with 16O and somewhat low content of 18O.babushkina-prb62 Studies of the effect of partial 16O-18O substitution on (La0.25Pr0.75)0.7Ca0.3MnO3 ceramic samplesbabushkina-prb62 indicate that the increasing of 18O enrichment produced a percolation-like transition to the insulating at a concentration of around 60%. Moreover, magneticbabushkina-prb62 and neutron diffractionbalagurov-prb60 measurements indicate that above 60% there exists only a pure antiferromagnetic insulating phase. In the same fashion, it is expected that samples of (La0.5Pr0.5)0.7Ca0.3MnO3 with 18O content larger than 85% should be antiferromagnetic without phase separation.
III.3 Spectral Weight
Finally, we discuss the integrated spectral weight, which can be conveniently expressed in terms of the effective number of carriers:
| (2) |
where and are the electron mass and charge, respectively, and is the volume of one formula unit. By applying this formula to the optical conductivity, we obtain the results presented in Fig. 11. The amount and energy scale of the spectral weight redistribution caused by the metal-insulator transition can be assessed by the comparison of for different temperatures. To facilitate this comparison, in the insets of the same Figure we have also plotted the temperature dependence of at two different frequencies.
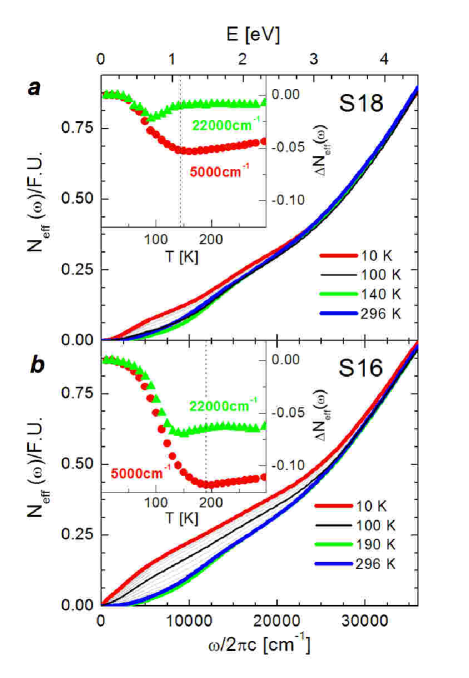
According to the discussion in the previous sections, at temperatures larger than , the spectral weight is approximately the same for both samples and shows also small temperature dependence. Below their respective , the spectral weight at low frequencies of both samples increase but, at the lowest temperature, is much smaller in S18 which is also the sample with smaller . However, we have not found scaling between at 0.5 eV and as seen for (La1-yPry)0.7Ca0.3MnO3 samples with different Pr concentrations. kim-lpcmo Another point to notice is that the spectral weight in the S18 sample is recovered in a smaller frequency range than the one containing 18O.
It is also interesting to compare different compounds where the distribution of spectral weight has also been studied. In the manganites studied here, the increase of spectral weight at low frequencies due to the formation of the metallic state is recovered at around 4 eV. This is an indication of the width of the bands involved in the physical process. In heavy fermion systems, the spectral weight is recovered in an energy range of 0.2 eV which indicates the narrowness of the f-bands participating in the process of forming the heavy fermion coherent state. degiorgi On the other hand, in FeSi the spectral weight lost in the formation of the Kondo insulating phase is not recovered below 4 eV. This is also an indication of the width of the -bands describing its behavior. schlesinger
IV Conclusions
We have presented the optical properties of two (La0.5Pr0.5)0.7Ca0.3MnO3 films, grown on SrTiO3 substrate, each of one contains different oxygen isotopes. The mismatch between the film and substrate lattice constants makes the films to be under high strains that change the their properties and make them more susceptible to phase separate. Evidence of this behavior was found in the observed optical response at low frequencies. In the paramagnetic insulating phase the optical conductivity of both films is similar and is dominated by a large peak at 1.5 eV, most probably corresponding to the transition II [] where the moved electron ends up being antiparallel to the core. At temperatures below , it looses intensity until it saturates at around 100 K. In the less metallic sample (the one containing 18O), the intensity of this peak at low temperatures is larger than the more metallic one (the one with 16O). On the other hand, the decrease in intensity of this transition is accompanied by the increase of another peak located at about 0.5 eV. This latter peak has been identified as the same kind of transition but where the excited electron ends up being parallel to the spin of the electrons. The intensity of this peak is larger in the more metallic sample. These observations taken together suggest that below the samples separate in two phases, one ferromagnetic metallic and one paramagnetic insulating. The relative volume of these phases is dependent on the isotope content, the metallic phase being more abundant in the sample containing 16O.
Acknowledgements
We would like to thank D. I. Khomskii and A. J. Millis for fruitful discussions, and E. van Heumen for their help in performing the ellipsometry measurements in STO. This investigation was supported by the Netherlands Foundation for Fundamental Research on Matter (FOM) with financial aid from the Nederlandse Organisatie voor Wetenschappelijk Onderzoek (NWO). It was also partially supported by MaNEP (Switzerland).
References
- (1) A. J. Millis, Nature 392, 147 (1998).
- (2) C. Zener, Phys. Rev. 82, 403 (1951);
- (3) H. Y. Hwang, S-W. Cheong, P. G. Radaelli, M. Marezio, and B. Batlogg, Phys. Rev. Lett. 75, 914 (1995).
- (4) L. M. Rodriguez-Martinez and J. P. Attfield, Phys. Rev. B 54, R15622 (1996).
- (5) A. M. Balagurov, V. Yu. Pomjakushin, D. V. Sheptyakov, V. L. Aksenov, P. Fischer, L. Keller, O. Yu. Gorbenko, A. R. Kaul, and N. A. Babushkina, Phys. Rev. B 64, 24420 (2001).
- (6) D. Khomskii, Physica B 280, 325 (2000).
- (7) A. Moreo, S. Yunoki, and E. Dagotto, Science 283, 2034 (1999).
- (8) Moon-Ho Jo, N. D. Mathur, N. K. Todd, and M. G. Blamire, Phys. Rev. B 61, 14905R (2000). M. Bibes, Ll. Balcells, S. Valencia, J. Fontcuberta, M. Wojcik, E. Jedryka, and S. Nadolski, Phys. Rev. Lett. 87, 67210 (2001).
- (9) M. Yu. Kagan, D.I. Khomskii, and M. V. Mostovoy, Eur. Phys. J. B 12, 217 (1999).
- (10) N. A. Babushkina, L. M. Belova, A. N. Taldenkov, E. A. Chistotina, D. I. Khomskii, K. I. Kugelk, O. Yu. Gorbenko, and A. R. Kaul, J. Phys.: Condens. Matter 11, 5865 (1999).
- (11) N. A. Babushkina, L. M. Belova, E. A. Chistotina, O. Yu. Gorbenko, A. R. Kaul, B. Güttler, and K. I. Kugel, Eur. Phys. J. B 19, 409 (2001).
- (12) G.M. Zhao, K. Conder, H. Keller, and K. A. Mueller, Nature 381, 676 (1996).
- (13) N. A. Babushkina, L. M. Belova, O. Yu. Gorbenko, A. R. Kaul, A. A. Bosak, V. I. Ozhogin, and K. I. Kugel, Nature 391, 159 (1998).
- (14) A. M. Balagurov, V. Yu. Pomjakushin, D. V. Sheptyakov, V. L. Aksenov, N. A. Babushkina, L. M. Belova, A. N. Taldenkov, A. V. Inyushkin, P. Fischer, M. Gutmann, L. Keller, O. Yu. Gorbenko and A. R. Kaul, Phys. Rev. B 60, 383 (1999).
- (15) A. S. Alexandrov and A. M. Bratkovsky, J. Phys.: Condens. Matter 11, 1989 (1999).
- (16) N. A. Babushkina, L. M. Belova, V. I. Ozhogin, O. Yu. Gorbenko, A. R. Kaul, A. A. Bosak, D. I. Khomskii, and K. I. Kugel, J. App. Phys. 83, 7369 (1998).
- (17) N. A. Babushkina, L. M. Belova, D. I. Khomskii, K. I. Kugel, O. Yu. Gorbenko, and A. R. Kaul, Phys. Rev. B 59, 6994 (1999).
- (18) A. J. Millis, J. El. Spec. and Rel. Ph. 114 116, 669 (2001).
- (19) Y. Okimoto, T. Katsufuji, T. Ishikawa, T. Arima, and Y. Tokura, Phys. Rev. B 55, 4206 (1997).
- (20) M. Quijada, J. Černe, J. R. Simpson, H. D. Drew, K. H. Ahn, A. J. Millis, R. Shreekala, R. Ramesh, M. Rajeswari, and T. Venkatesan, Phys. Rev. B 58, 16093 (1998).
- (21) B. Michaelis and A. J. Millis, Phys. Rev. B 68, 115111 (2003).
- (22) J. H. Jung, K. H. Kim, H. J. Lee, J. S. Ahn, N. J. Hur, T. W. Noh, M. S. Kim, and J.-G. Park, Phys. Rev. B 59, 3793 (1999).
- (23) A. S. Moskvin, E. V. Zenkov, Yu. D. Panov, N. N. Loshkareva, Yu. P. Sukhorukov, and E. V. Mostovshchikova, Phys. Sol. St. 44, 1519 (2002).
- (24) K. H. Kim, J. H. Jung, and T. W. Noh, Phys. Rev. Lett. 81, 1517 (1998).
- (25) K. H. Kim, J. H. Jung, D. J. Eom, T. W. Noh, J. Yu, and E. J. Choi, Phys. Rev. Lett. 81, 4983 (1998).
- (26) J. H. Jung, K. H. Kim, T. W. Noh, E. J. Choi, and Jaejun Yu, Phys. Rev. B 57, 11043 (1998).
- (27) K. Takenaka, K. Iida, Y. Sawaki, S. Sugai, Y. Moritomo, and A. Nakamura, J. Phys. Soc. Jpn 68, 1828 (1999).
- (28) Ch. Hartinger, F. Mayr, J. Deisenhofer, A. Loidl, and T. Kopp, Phys. Rev. B 69, 100403 (2004).
- (29) A. S. Moskvin, Physica B 252, 186 (1998).
- (30) A. S. Moskvin, E. V. Zenkov, Yu. P. Sukhorukov, E. V. Mostovshchikova, N. N. Loshkareva, A. R. Kaul, and O. Yu. Gorbenko, J. Phys.: Condens. Matter 15, 2635 (2003).
- (31) N. N. Loshkareva, Yu. P. Sukhorukov, E. A. Gan shina, E. V. Mostovshchikova, R. Yu. Kumaritova, A. S. Moskvin, Yu. D. Panov, O. Yu. Gorbenko, and A. R. Kaul, J. Exp. Th. Phys. 92, 462 (2001).
- (32) For the corresponding Fresnel equations see for example: O. S. Heavens, Thin Film Physics (Methuen, London , England, 1970).
- (33) F. P. Mena, D. van der Marel, A. Damascelli, M. Fäth, A. A. Menovsky, and J. A. Mydosh, Phys. Rev. B 67, 241101 (2003).
- (34) A. Kuzmenko, Rev. Sci. Instrum. 76, 083108 (2005).
- (35) K. Takenaka, Y. Sawaki, R. Shiozaki, and S. Sugai, Phys. Rev. B 62, 13864 (2000).
- (36) K. Takenaka, R. Shiozaki, and S. Sugai, Phys. Rev. B 65, 184436 (2002).
- (37) A. J. Millis, R. Mueller, and Boris I. Shraiman, Phys. Rev. B 54, 5405 (1996).
- (38) T. W. Noh, J. H. Jung, and K. H. Kim, in Physics of Manganites, edited by T. A. Kaplan and S. D. Mahanti (Kluwer Academic, New York, 1999).
- (39) Y. R. Chen, V. Perebeinos, and P. B. Allen, Phys. Rev. B 65, 205207 (2002).
- (40) Y. Okimoto and Y. Tokura, J. of Supercond., 13, 271 (2000).
- (41) A. Chattopadhyay, A. J. Millis, and S. Das Sarma Phys. Rev. B 61, 10738 (2000).
- (42) D. van der Marel and G. A. Sawatzky, Phys. Rev. B 37, 10674 (1988).
- (43) T. Saitoh, A. E. Bocquet, T. Mizokawa, H. Namatame, A. Fujimori, M. Abbate, Y. Takeda, M. Takano, Phys. Rev. B 51, 13942 (1995).
- (44) J.-H. Park, C. T. Chen, S-W. Cheong, W. Bao, G. Meigs, V. Chakarian, and Y. U. Idzerda, Phys. Rev. Lett. 76, 4215 (1996).
- (45) N. A. Babushkina, A. N. Taldenkov, L. M. Belova, E. A. Chistotina, O. Yu. Gorbenko, A. R. Kaul, K. I. Kugel, D. I. Khomskii, Phys. Rev. B 62, 6081R (2000).
- (46) For a review in the optical properties of heavy fermion systems see L. Degiorgi, Rev. Mod. Phys. 71, 687 (1999).
- (47) Z. Schlesinger, Z. Fisk, H. T. Zhang, M. B. Maple, J. F. DiTusa, and G. Aeppli, Phys. Rev. Lett. 71, 1748 (1993).