Electronic states and cyclotron resonance in -type InMnAs and InMnAs/(Al,Ga)Sb at ultrahigh magnetic fields
Abstract
We present a theoretical and experimental study on electronic and magneto-optical properties of p-type paramagnetic InMnAs dilute magnetic semiconductor alloys and ferromagnetic p-type InMnAs/(Al,Ga)Sb thin films in ultrahigh ( 100 T) external magnetic fields B. We use an 8 band Pidgeon-Brown model generalized to include the wavevector dependence of the electronic states along B as well as - and - exchange interactions with localized Mn -electrons. In paramagnetic p-InMnAs alloys, we compute the spin-dependent electronic structure as a function of Mn doping and examine how the valence band structure depends on parameters such as the sp-d exchange interaction strength and effective masses. The cyclotron resonance (CR) and magneto-optical properties of InMnAs are computed using Fermi’s golden rule. In addition to finding strong CR for hole-active polarization in p-type InMnAs, we also find strong CR for electron-active polarization. The electron-active CR in the valence bands results from transitions between light and heavy hole Landau levels and is seen in experiments. In ferromagnetic p-InMnAs/(Al,Ga)Sb, two strong CR peaks are observed which shift with position and increase in strength as the Curie temperature is approached from above. This transition takes place well above the Curie temperature and can be attributed to the increase in magnetic ordering at low temperatures.
pacs:
75.50.Pp, 78.20.Ls, 78.40.FyI Introduction
Electronic and optical properties of In1-xMnxAs dilute magnetic semiconductors (DMS) are important for designing ferromagnetic heterostructures, which may in turn prove useful in the fabrication of spintronic devices Munekata et al. (1992); Ohno et al. (1992, 1996); Matsukura et al. (1998); Kikkawa and Awschalom (1998); Ohno et al. (1999). Since InMnAs is a narrow gap semiconductor, it can serve as a prototype for studying electronic, spin, and ferromagnetic properties of dilute magnetic semiconductor alloys. The results for InMnAs can easily be generalized to the other dilute magnetic semiconductors. Up to now, ferromagnetism in III-V ferromagnetic semiconductors has only been observed in -doped samples and it is believed that the ferromagnetic exchange is mediated by itinerant holes Sanvito et al. (2001); Konig et al. (2001). Ferromagnetism strongly depends on the hole density and has been observed in -doped InMnAs samples having hole densities greater than . The nature of these itinerant holes is still an open question. Therefore, studying the properties of the valence bands in InMnAs is of fundamental importance in fully understanding the exchange mechanism in dilute magnetic semiconductors.
Cyclotron resonance (CR) is a powerful method for determining band parameters, especially in a DMS alloy, whose bandstructure is very sensitive to external magnetic fields. However, owing to strong disorder and scattering by Mn impurities in InMnAs, one needs to go to ultrahigh magnetic fields (50-100 Tesla) where in order to observe CR. Megagauss CR studies have been performed on -type CdMnTe Matsuda et al. (2002) and - and -type InMnAs Matsuda et al. (2001); Zudov et al. (2002); Khodaparast et al. (2003a, b); Sanders et al. (2003a, b) and have shown that the Mn impurities have a significant effect on the electronic structure of DMS alloys.
In order to study the electronic and optical properties of DMS alloys, we utilize a modified 8 band Pidgeon-Brown effective mass Hamiltonian Pidgeon and Brown (1966) which is generalized to include the dependence of the bandstructure on the wavevector parallel to B as well as the exchange interaction between the itinerant carriers and localized Mn spins.
This paper is organized as follows. In section II, the theory used in this paper will be discussed in detail including the effective mass Hamiltonian and the magneto-optical absorption. In section III, we will discuss our results and investigate cyclotron resonance absorption in bulk paramagnetic DMS samples and ferromagnetic DMS thin films. Finally, our conclusions will be given in section IV. In the appendix, we discuss the validity of the 8 band theory for magnetic fields up to 100 T.
II Theory
In this section, we describe the theoretical model we use to analyze Megagauss CR data in bulk dilute magnetic semiconductor alloys. Our effective mass treatment of InMnAs was described in Ref. Sanders et al., 2003a where n-type dilute magnetic semiconductors were considered. Cyclotron resonance in p-type dilute magnetic semiconductors is more complicated owing to the greater complexity of the valence bands. The formalism however follows our previous work on -type systems and the reader is referred to this reference for details of the effective mass formalism. Here we simply outline the important points.
The effective mass Hamiltonian for InxMn1-xAs in a magnetic field directed along the axis can be expressed as the sum of three Hamiltonians which account for the Landau, Zeeman, and exchange interactions between and electrons and localized Mn electrons. Thus,
| (1) |
where explicit expressions for effective mass Hamiltonians, , , and are given in Ref. Sanders et al., 2003b.
Following Pidgeon and Brown, we find it convenient to separate the eight Bloch basis states into an upper set and a lower set which decouple at the zone center, i.e. . The Bloch basis set we choose for the upper set are
| (2a) | |||||
| (2b) | |||||
| (2c) | |||||
| (2d) | |||||
which correspond to electron spin up, heavy hole spin up, light hole spin down, and split off hole spin down. Likewise, the Bloch basis states for the lower set are
| (3a) | |||||
| (3b) | |||||
| (3c) | |||||
| (3d) | |||||
corresponding to electron spin down, heavy hole spin down, light hole spin up, and split off hole spin up.
For the vector potential, we choose the Landau gauge
| (4) |
from which we obtain . With the choice of Landau Gauge (4), translational symmetry in the direction is broken while translational symmetry along the and directions is maintained. Thus and are good quantum numbers and the envelope of the effective mass Hamiltonian (1) can be written as
| (5) |
In Eq. (5), is the Landau quantum number associated with the Hamiltonian matrix, labels the eigenvectors in order of increasing energy, is the cross sectional area of the sample in the plane, are complex expansion coefficients for the -th eigenstate which depend explicitly on , and are harmonic oscillator eigenfunctions evaluated at . The magnetic length, , is
| (6) |
where is the Bohr magneton and is the free electron mass.
Substituting from Eq. (5) into the effective mass Schrödinger equation with given by Eq. (1), we obtain a matrix eigenvalue equation
| (7) |
that can be solved for each allowed value of the Landau quantum number, , to obtain the Landau levels . The components of normalized eigenvectors, , are the expansion coefficients, . Since the harmonic oscillator functions, , are only defined for , it follows from Eq. (5) that is defined for . In solving the effective mass Schrödinger equation (7), rows and columns for which are deleted in the effective mass Hamiltonian. The energy levels are denoted where labels the Landau level and labels the eigenenergies belonging to the same Landau level in ascending order.


The magneto-optical absorption coefficient at the photon energy is Bassani and Parravicini (1975)
| (8) |
where is the imaginary part of the dielectric function and is the index of refraction. The imaginary part of the dielectric function is found using Fermi’s golden rule as described in Ref. Sanders et al., 2003b and the material parameters we use are listed in Table I of Ref. Sanders et al., 2003b.
III Results and Discussion
In1-xMnxAs was the first III-V DMS material in which ferromagnetism was observed Ohno et al. (1992); Munekata et al. (1993). While Curie temperatures can be above 50 K, in many instances, the Curie temperature in InMnAs is below 5 K. In our experiments the samples can be considered as paramagnetic and we consider this limit in what follows using the formalism described in Ref. Sanders et al., 2003b.
III.1 Valence subband structure
Solving the effective mass Schrödinger equation (7), we obtain the valence subband structure as a function of Mn concentration, and wavevector, . The valence subband structure in In1-xMnxAs for K and Tesla is shown in Fig. 1 for and %. Comparing Fig. 1 (a) and (b), we see that doping with Mn leads to large splitting of the valence bands due to the exchange interaction between itinerant holes and localized Mn magnetic moments. In this subband structure, the Landau level with (obtained by diagonalizing a effective mass Hamiltonian) is a pure heavy hole (HH) spin down state with a simple parabolic dispersion relation, which we label .
As seen in Fig. 1 (b), the most pronounced effect of Mn doping on the computed valence band Landau levels is the reversal in energy of two states, namely the pure heavy hole state and the state which is primarily a light hole spin up state near the zone center. These two states are the lowest-lying hole levels in undoped and doped samples, respectively, so in the limit of low carrier density, they will be the only occupied states. Thus, a major effect of Mn doping is to change the spin state of the system through the exchange interaction between the itinerant holes and the localized Mn spins.
III.2 Cyclotron resonance absorption


Our theoretically computed CR absorption in undoped InAs for h-active circularly polarized radiation with photon energy at is shown in Fig. 2(b) for a hole concentration of . The CR absorption spectrum is broadened with a FWHM linewidth of meV which is narrower than in the experimental situation.
To help us understand the origin of the CR absorption peaks, the Landau levels at are shown as a function of the applied magnetic field in the fan diagram in Fig. 2 (a). The Fermi level for is indicated by the dashed line in the fan diagram. At a hole density of only Landau levels very close to the valence band edge are occupied by holes. The transitions responsible for the strong CR absorption peaks are indicated by the vertical arrows. Holes excited from the low-lying Landau levels give rise to three CR peaks. The CR absorption peak near 40 Tesla is due to a transition between the Landau subbands and . Near the zone center, the level is primarily HH spin down which accounts for our use of the designation for this subband. The CR peak near 150 Tesla is due to a transition between the and states where indicates the states are primarily LH in character at .
There is another CR absorption peak around 350 Tesla, labeled ’C’, which can be resolved into a closely spaced pair of HH and LH peaks indicated by the two vertical arrows in the fan diagram in Fig. 2 (a), i.e. a light hole to transition and a heavy hole to transition. The to transition demands some explanation since it would appear from the fan diagram that both initial and final states are below the Fermi level and contain no holes. So how can there be a CR absorption peak for this transition? The answer can best be seen by plotting the k-dependent Landau level subband structure at 350 Tesla. This is done in Fig. 2 (c) where Fermi levels are shown for hole concentrations of , , and . The Landau subband exhibits a camel back structure and at a hole concentration of only states near are occupied while states at the point are empty. It is clear that the to transition takes place between states near . As an aside, our analysis reveals that the transition at the point between the two states is actually forbidden while mixing of states away from the point gives rise to nonvanishing optical matrix elements.
Finally, we should note that for Tesla, higher order Landau levels become occupied and excitations of holes from these subbands are responsible for the downward sloping plateau seen in the cyclotron resonance absorption in Fig. 2 (b) for .
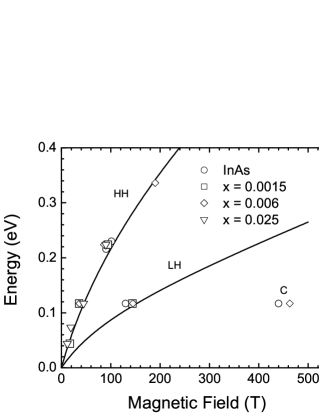
We find that for the low Mn concentrations encountered in experiments, the CR peak positions in In1-xMnxAs are insensitive to . In Fig. 3, we plot the lowest lying HH, LH and ’C’ CR peak positions as functions of magnetic field for in four samples having Mn concentrations from to . The solid curves are the theoretically computed CR peak positions for the HH and LH CR peaks for InAs in the paramagnetic limit. Thus, doping with low Mn concentrations does not alter the band structure significantly.
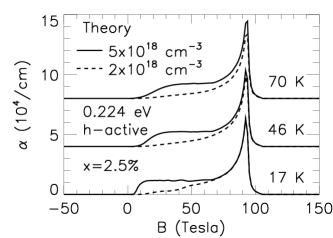
While the CR peak positions may be insensitive to the Mn concentration, the CR spectra depend sensitively on the hole density due to Fermi filling effects. Fig. 4 shows theoretical h-active CR absorption spectra in In0.975Mn0.025As for photon energies having . We plot the CR absorption at two different hole concentrations, and and at three different temperatures, namely , and assuming a narrow FWHM linewidth of 4 meV.
The CR absorption spectra exhibit asymmetric peaks with a broad tail at low fields. Note that the width of the low field tail depends on the free hole concentration. The curves with a hole density of have a broad tail at low fields, while the curves with a hole density of have a narrow tail. The width of the low field tail results from the population of higher order Landau levels and the sharpness of the low field cutoff is attributed to the sharpness of the Fermi distribution at low temperatures. The HH to HH transition will take place even if the hole density is low, because the state is very close to the valence band edge and is almost always occupied, partially or fully. The higher order transitions need higher free hole densities to have the corresponding levels occupied.
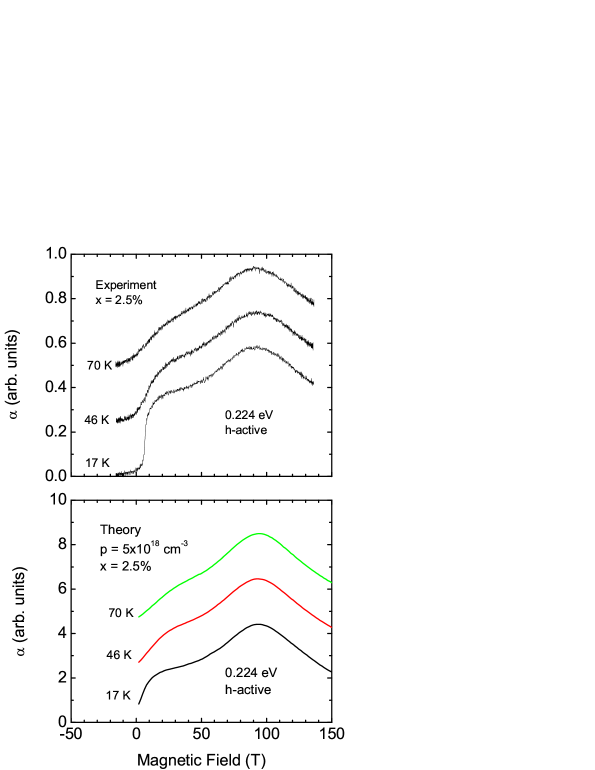
Due to the nonparabolicity of the valence subbands, most CR spectra are generally not symmetric. The asymmetry of the CR absorption curves in Fig. 4 is seen very clearly. Changes in temperature can also bring about changes in the spectral lineshape due to Fermi level sharpening at low temperatures. This can be seen in the experimental data shown in Fig. 5 (a) where the 17 K curve has an abrupt cutoff at low magnetic fields. Fig. 5 (b) shows the results of our theoretical CR absorption spectra, in which the broadening of the CR absorption curves is based on the experimental hole mobilities.
III.3 Sensitivity of cyclotron resonance energies to model parameters


The material parameters used in the effective mass Hamiltonian can drastically change the valence band structure and the resulting CR absorption spectra. Figs. 6 and 7 shows the heavy-hole and light-hole cyclotron resonance energy shift in In1-xMnxAs due to a change in a number of material parameters. We denote this shift in the cyclotron resonance energy by . The material parameters include the Luttinger parameters , , , Kane’s parameter , and the effective electron mass . Shifts in the cyclotron resonance photon energy are plotted as a function of the resonance field. It should be remarked that the resonance photon energy is not constant but varies with the resonance field. As expected, shifts in the cyclotron resonance photon energy vanish if the resonance field vanishes. In all cases the temperature is taken to be 30 K and results are plotted for Mn concentrations of 0% and 5%.
Comparing Figs. 6 (a) and 7 (a) we find that the LH transition in InAs is more sensitive to small changes in the material parameters than the HH transitions. For instance, a change in will result in a shift in the LH cyclotron resonance energy, which in turn will result in about a 100 T change in the cyclotron resonance field. In Figs. 6 (b) and 7 (b) the sensitivity of the CR energy to changes in the material parameters in In0.95Mn0.05As are plotted. We find that 5% Mn doping doesn’t strongly alter the sensitivity to small changes in the material parameters.
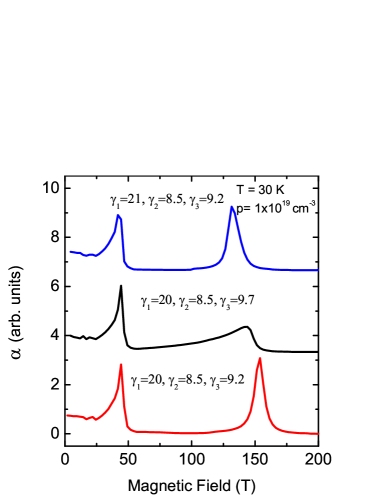
It is instructive to demonstrate how the CR absorption depends on the valence band Luttinger parameters. The nominal values of the Luttinger parameters in InAs Vurgaftman et al. (2001) are , and . In Fig. 8 we plot theoretical CR absorption spectra in InAs for three different sets of Luttinger parameters while fixing all other material parameters at their nominal values. The bottom curve in Fig. 8 is based on the nominal InAs Luttinger parameters. The upper curve illustrates what happens when is increased by 5% and the middle curve shows what happens when is increased by 5%. In all three simulations, we assume that the temperature and that the the hole concentration . ¿From Fig. 8 it is clear that the HH CR resonance peak near 40 Tesla is relatively insensitive to small changes in the Luttinger parameters while the position and shape of the LH CR feature near 150 Tesla is very sensitive to changes in the Luttinger parameters. It can be thus be seen that the CR spectra depends sensitively on the material parameters and may furnish an effective way to refine these parameters.
III.4 Selection rules, valence band mixing and e-active CR in -type semiconductors
Selection rules for CR are a direct result of the conservation of energy and angular momentum. For a free gas of electrons or holes, CR can only be observed for certain circular polarizations. For instance, in a free electron gas, CR transitions occur for circular polarization while for a free hole gas, CR occurs only for circular polarization. As a result, CR in polarization is often called electron-active (e-active) and polarization is referred to as hole-active (h-active).
The situation in real semiconductors, however, differs from that of a gas of free positive or negative carriers. Recently, we have experimentally observed e-active CR in -doped InAs and InMnAs. The temperature was quite low (12K) and the hole concentration was high enough () to safely eliminate the possibility that the e-active CR comes from the thermally excited electrons in the conduction band. We excluded the existence of electrons in the interface or surface inversion layers. Thus, the results suggest that e-active CR comes from the valence band holes, in contradiction to the simple picture of a free hole gas.
With a full treatment of the semiconductor energy band structure within our modified Pidgeon-Brown model, it is easy explain the e-active CR results in terms of the degeneracy of the valence band states. Specifically, having multiple valence band states (heavy hole: ; light hole: ) allows one to satisfy conservation of angular momentum in cyclotron absorption for both and polarizations. Note that this is not a consequence of valence band mixing between the heavy and light hole states (though mixing between the conduction and valence bands is needed to pick up oscillator strength for the transitions). It is simply required to have degenerate valence band states with differing quantum numbers.
The effective mass wavefunction is a product of the rapidly oscillating periodic part of the Bloch basis functions at the zone center and the slowly varying envelope function ,
| (9) |
where the ’s refer to the oscillator functions multiplied by dependent coefficients, and the subscript ’s refer to the quantum numbers and in Eq. (5). The summation is performed over different energy bands. The optical matrix element is given by
| (10) |
where we used and to refer to and , respectively.
Two terms appear in Eq. (10). The second term, proportional to the momentum matrix element between the envelope functions describes optical transitions within the one-band model and corresponds to that in the free electron gas. The first term, being proportional to the momentum matrix element between periodic parts of the Bloch functions, has interband nature and is present only if conduction band - valence band mixing takes place. As shown in Ref. Kacman and Zawadzki, 1971, the first term dominates in both narrow and wide gap semiconductors.
Substituting the wavefunctions in Eq. (5) into Eq. (10), the selection rules for optical transitions in e-active and h-active polarizations are obtained from
| (11) |
We need to stress that in Eq. (10), both terms will result in the same selection rules. This means that the CR selection rules do not depend on the degree of conduction-valence band mixing. As a result of the selection rules, we see that illumination leads to transitions which increase the manifold quantum number by one () while leads to transitions which decrease the manifold quantum number by one ().
In the conduction band, increasing the manifold quantum number always increases the energy. As a result, only transitions with increasing may take place in absorption, that is, only e-active () CR can be observed in the conduction band.

The valence band, however, consists of two types of carriers: heavy holes () and light holes (). Each of them has their own Landau ladder in a magnetic field. An increase of always implies a decrease in energy but only within each ladder. Like the conduction band case, transitions within a ladder ( or ) can take place only in h-active () polarization. However, the relative position of the two ladders can be such that interladder transitions () in e-active polarization are allowed. This process is schematically shown in Fig. 9. Note that this figure is extremely simplified and should be used only as a qualitative explanation of the effect.

We’ve examined e-active CR at a photon energy of 0.224 eV in -type InAs at with a free hole density of . In Fig. 10 (a) a fan diagram consisting of the computed valence band energies is plotted as a function of the magnetic field. The field-dependent Fermi level is shown as a nearly horizontal dashed line and the three strongest e-active CR transitions are indicated by vertical arrows whose relative thicknesses correspond to the strengths of the three CR absorption transitions. The corresponding e-active CR absorption spectra is shown in Fig. 10 (b). The most pronounced e-active transition near 95 Tesla is the sharp interladder transition . Another strong interladder transition is seen near 60 Tesla. This interladder transition has a lot of oscillator strength but is broader by virtue of the high degree of nonparabolicity in the valence bands.
We now consider the effects of Mn doping on the computed e-active cyclotron resonance absorption spectra in Fig. 10. As in Fig. 10 we will assume that the samples remain paramagnetic in the presence of Mn doping. In section III.1, the Mn doping effect on the valence band structure of In1-xMnxAs was briefly addressed. It was noted that increasing the Mn doping concentration, , can shift the first HH state to the top of the valence band and shift the LH state to a lower position, thus changing the average spin state of the carriers in the system. The Mn doping has further effects on CR absorption. Doping with Mn impurities greatly enhances carrier scattering thus increasing the line width and reducing the strength of the CR absorption. Manganese doping also shifts the CR peak positions since the exchange Hamiltonian, changes the valence subband structure. Finally, we note that Mn doping is also responsible for the observed ferromagnetism and this will be discussed in the next section.

In Fig. 11, we illustrate the effect of Mn doping on the strong e-active interladder CR transition in Fig. 10. Two e-active CR absorption peaks are plotted for two different values of the Mn concentration, namely and . The strong e-active transition seen in InAs (solid line) in the absence of Mn doping has been discussed previously and is also show in Fig. 10. The e-active CR absorption peak in In0.95Mn0.05As (dashed line) is shifted relative to the corresponding InAs feature and reduced in strength by about a factor of 30. The reduction in strength in going from x=0% to x=5% comes primarily from the Fermi filling effect since the state contains fewer holes when the sample is doped with Mn ions at a hole density of . We note that absorption takes place not only near the point, but also in regions away from the zone center. Even though we broaden both CR absorption peaks by the same line width (4 meV), the Mn doped sample has a much broader line shape due to the change in the nonparabolic Landau level subband structure brought about by the exchange interaction.

We have performed CR transmission measurements on bulk In1-xMnxAs samples with Mn concentrations x=0% and x=0.6% at several temperatures. In all cases, the samples were found to be in the paramagnetic phase. The calculated and the experimental CR transmission spectra are shown in Fig. 12 for both e-active (right panel) and h-active (left panel) polarizations. As seen in Fig. 12, there is good agreement between theory and experiment. As discussed above, the e-active CR absorption is determined by the transitions. The main contribution to the h-active CR absorption (left panel in Fig. 12) comes from the transitions within the heavy hole ladder.
Using both h and e-active CR in p-type dilute magnetic semiconductors, one may hope to fully characterize the complicated valence band structure in these important materials.
III.5 Cyclotron resonance in ferromagnetic thin films
In addition to studying bulk paramagnetic p-type InMnAs, we also studied thin ferromagnetic films consisting of InMnAs on (Al,Ga)Sb. The ferromagnetic films are interesting since they can provide insight into the interaction of the free carriers and Mn spins. The interaction of free carriers with localized spins plays an important role in a variety of physical situations in metals Anderson (1961); Kittel (1968); Hewson (1993). Carriers near a magnetic ion are spin-polarized, and can mediate an indirect exchange interaction between magnetic ions. The hole-induced ferromagnetism realized in Mn-doped III-V semiconductors Munekata et al. (1991, 1993); Ohno et al. (1996) has provided a novel system in which to study itinerant carriers interacting with localized spins in the dilute limit. Various mechanisms have been suggested but the microscopic origin of carrier-induced ferromagnetism is still controversial Dietl et al. (2000); König et al. (2000); Kaminski and Sarma (2002); Zarand and Jankó (2002). One of the unanswered questions is the nature of the carriers, i.e., whether they are in the impurity band (-like), the delocalized valence bands (-like), or some type of mixed state.
In our studies on the films, we found a clear observation of hole cyclotron resonance (CR) in ferromagnetic InMnAs/(Al,Ga)Sb. This demonstrates the existence of at least some delocalized -like carriers. In addition, this is the first CR study in any ferromagnet covering temperatures both below and above the Curie temperature () Goy and Grimes (1973); Chin and Sievers (1981). In all samples studied, we observed two resonances, both of which exhibited an unusual temperature dependence in their position, intensity, and width. The lower-field resonance showed an abrupt reduction in width with a concomitant decrease in the resonance field above . The higher-field resonance, which was absent at room temperature, suddenly appeared above , rapidly grew with decreasing temperature, and became comparable in strength to the lower-field resonance at low temperature. We ascribe these resonances to the two fundamental CR transitions expected for delocalized holes in the valence band of a Zinc-Blende semiconductor in the magnetic quantum limit.
In our 8-band kp theory ferromagnetism is treated within a mean-field approximation. Our results show that the temperature dependent CR peak shift is a direct measure of the carrier-Mn exchange interaction.
| Sample No. | 1 | 2 | 3 | 4 |
|---|---|---|---|---|
| (K) | 55 | 30 | 40 | 35 |
| Mn content | 0.09 | 0.12 | 0.09 | 0.12 |
| Al content | 0 | 0 | 0 | 1 |
| Thickness (nm) | 25 | 9 | 31 | 9 |
| Density (cm-3) | 1.11019 | 4.81019 | 1.11019 | 4.81019 |
| Mobility (cm2/Vs) | 323 | 371 | 317 | 384 |
| / | 0.0508 | 0.0525 | 0.0515 | 0.0520 |
| / | 0.122 | 0.125 | 0.125 | 0.127 |
The samples were In1-xMnxAs/AlyGa1-ySb single heterostructures containing high densities (1019 cm-3) of holes. They were grown by low temperature molecular beam epitaxy on GaAs (100) substrates Slupinski et al. (2002). Unlike the - and -type films we studied earlier Matsuda et al. (2001); Zudov et al. (2002); Khodaparast et al. (2003b); Sanders et al. (2003a), the samples in the present work were ferromagnetic.
Table 1 summarizes the characteristics of the four In1-xMnxAs/AlyGa1-ySb samples used in our study. Sample 1 was annealed at 250 ∘C after growth, which increased the Curie temperature, , by 10 K Hayashi et al. (2001); Potashnik et al. (2001). We performed CR measurements using ultrahigh pulsed magnetic fields generated by the single-turn coil technique Zudov et al. (2002); Nakao et al. (1985). We used circularly-polarized radiation with wavelengths of 10.6 m, 10.2 m, 9.25 m (CO2 laser), and 5.527 m (CO laser), and the transmitted radiation was detected using a fast HgCdTe detector. A multi-channel digitizer recorded the signals from the pick-up coil and the detector.
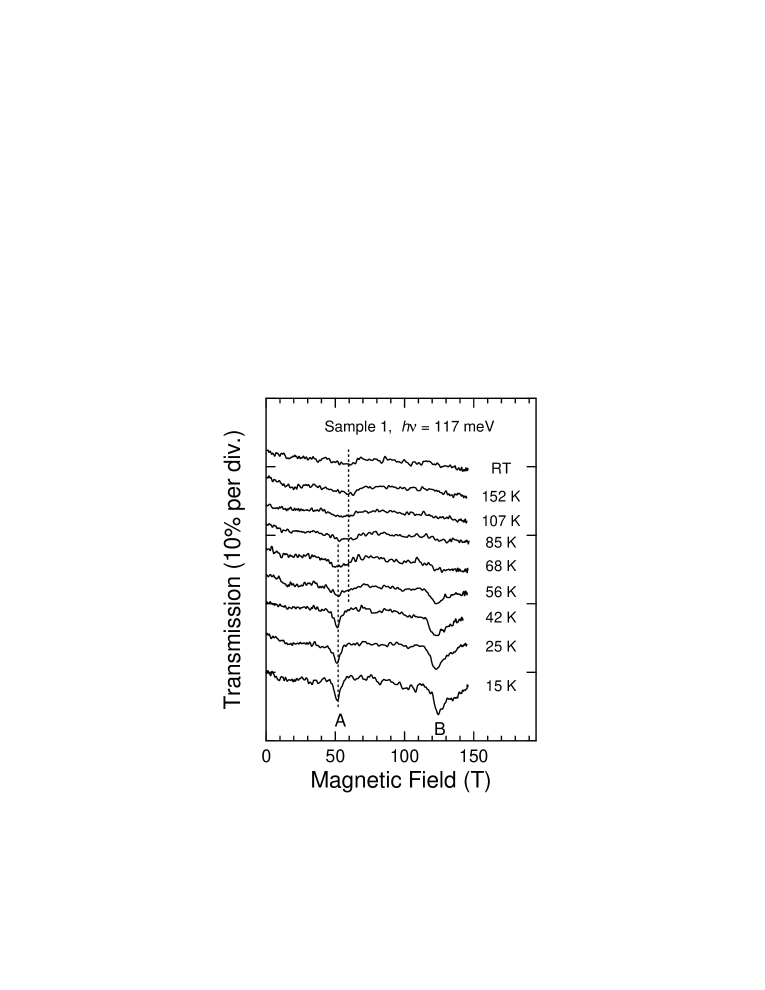
Figure 13 shows the transmission of the 10.6 m (photon energy ) beam through sample 1 at various temperatures as a function of the magnetic field. From room temperature down to slightly above the Curie temperature, , a broad feature (labeled ‘A’) is observed with almost no change in the line intensity, position, and width with decreasing temperature. However, at 68 K, which is sill above , we observe an abrupt and dramatic change in the spectra. As the temperature decreases, a significant reduction in the linewidth and a sudden shift to a lower magnetic field are observed along with a rapid increase in the line intensity. In addition, a second feature (labeled ‘B’) suddenly appears at a magnetic field of 125 Tesla, which also rapidly grows in intensity with decreasing temperature and saturates at low temperature in a manner similar to that observed in feature A. Note that the temperature at which these unusual sudden CR changes occur () is higher than .
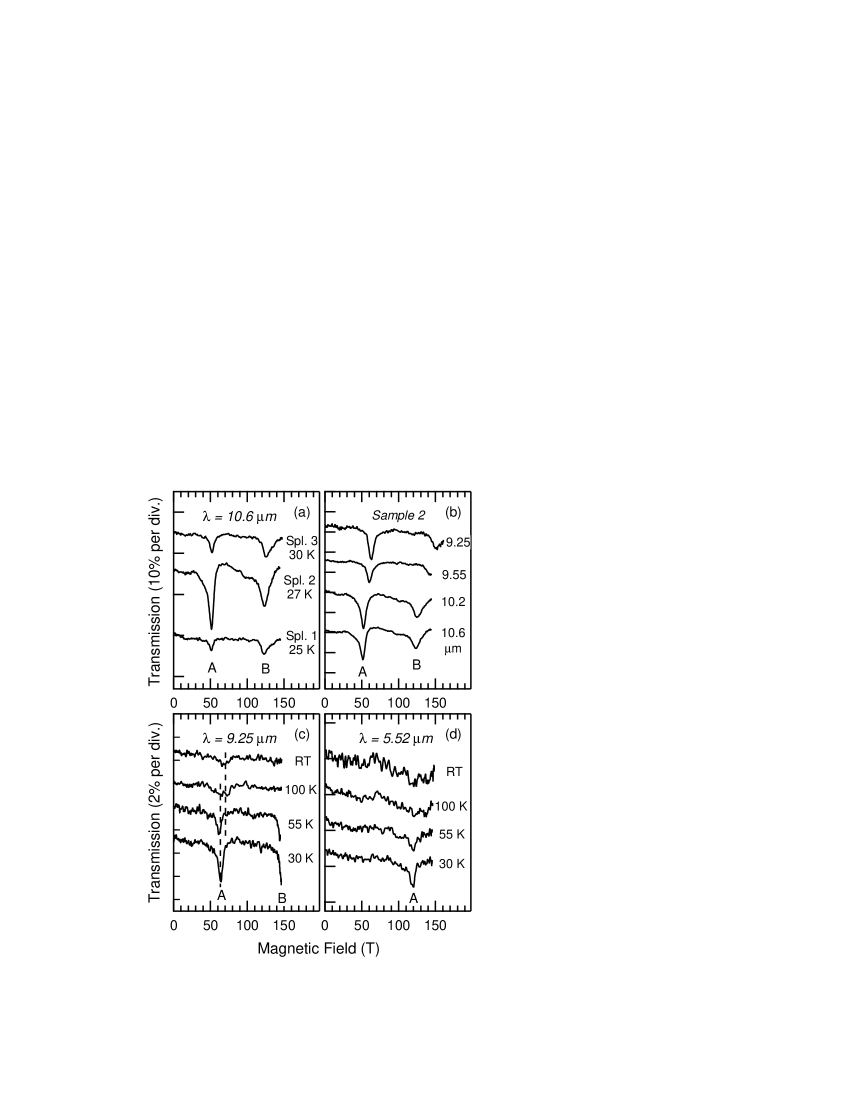
The observed unusual temperature dependence is neither specific to the particular wavelength () used or the sample measured. We observed essentially the same temperature dependent behavior in all the samples studied. Figure 14 (a) shows low temperature CR traces for three samples at 10.6 m. Both features A and B are clearly observed but their intensities and linewidths vary from sample to sample. Figure 14 (b) displays the wavelength dependence of the CR spectra for sample 2. We can see that both lines shift to higher magnetic fields with decreasing wavelength (i.e., increasing photon energy), as expected. Figures 14 (c) and 14 (d) show data at different temperatures for sample 1 measured at wavelength of 9.25 m and 5.52 m, respectively. The temperature dependence observed at these shorter wavelengths is similar to what was observed at 10.6 m. The observations of CR with essentially the same masses in samples with different buffer layers (GaSb or AlSb) exclude the possibility that we are observing hole CR in the buffer. We also confirmed the absence of CR in a control sample which consisted of only a GaSb layer grown on GaAs. All these facts confirm the universality of the effects we observed and their relevance to ferromagnetic order.
The clear observation of CR indicates that at least a fraction of the holes are delocalized. This is in agreement with our measurements on low- films Khodaparast et al. (2003b); Sanders et al. (2003a) which shows that the two resonance spectra are similar although the resonances were much broader and the temperature dependence was much weaker. However, extensive earlier attempts to observe CR in GaMnAs Matsuda et al. (1997) did not detect any sign of resonant absorption within the magnetic field and wavelength ranges in which both light hole (LH) and heavy hole (HH) CR in GaAs were expected. This fact may indicate that the holes in GaMnAs are strongly localized, that the mixing of - and -like states makes the effective masses of holes extremely large, or that scattering is too strong for the cyclotron resonance condition, , to hold. In any case, it appears that the carriers mediating the Mn-Mn exchange interaction are considerably more localized in GnMnAs than in InMnAs, consistent with recent optical conductivity Hirakawa et al. (2002) and photoemission experiments Okabayashi et al. (2002).
Feature A becomes strikingly narrow at low temperatures. The estimated CR mobility is 45 103 cm2/Vs, which is one order of magnitude larger than the low temperature mobilities measured by the Hall effect (see Table 1). We speculate that this is associated with the suppression of localized spin fluctuations at low temperature. A similar effect has been observed in (II,Mn)VI systems Brazis and Kossut (2002). Spin fluctuations become important when a band carrier simultaneously interacts with a limited number of localized spins. This occurs, for example, for magnetic polarons and for electrons in (II,Mn)IV quantum dots. The strong in-plane localization by the magnetic field may also result in a reduction of the number of spins which a band carrier feels, thus increasing the role of spin fluctuations.
It is important to emphasize that the temperature at which significant spectral changes start to appear () is consistently higher than in all the samples. This fact may be explainable in light of a recent Monte Carlo study Schliemann et al. (2001) which suggested that short-range magnetic order and finite local carrier spin polarization are present for temperatures substantially higher than . A more recent theoretical study Alvarez et al. (2002) explicitly predicts the existence of , corresponding to clustering. Any such local order should result in modifications in band structure, which in turn modify CR spectra.
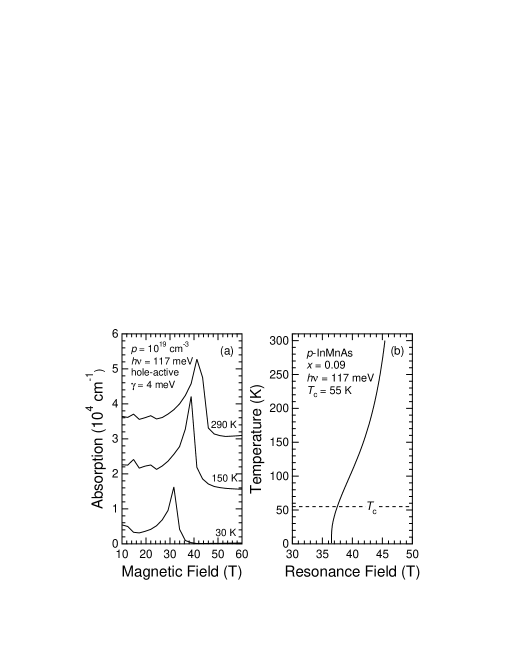
In our theoretical model, peak A can be identified as the H-1,1 H0,2 transitionSanders et al. (2003a, c). We attribute the temperature dependent peak shift to the increase of carrier-Mn exchange interaction resulting from the increase of magnetic ordering at low temperature. The carrier-Mn exchange interaction interaction is governed by the Hamiltonain in Eq. 1 and depends explicitly on the expectation value of the Mn spin, , in the mean field approximation. Our calculated CR spectra are shown in Fig. 15 (a) for bulk In0.91Mn0.09As with only a minimal broadening of 4 meV. The figure shows the shift of peak A with decreasing temperature. Note that the peak in a bulk system occurs at room temperature at a magnetic field of 40 T as opposed to the heterostructures where the resonance occurs at a magnetic field of 50 T due to quantum confinement and strain effects.
It is easy to obtain an exact analytical expression for this shift since it involves only the lowest two manifolds in our model (, which is 1 dimensional, and , which factors into two 22 matrices for ). Furthermore, to simplify the final expressions, we neglect the small terms arising from the interaction with remote bands. With these simplifications, the cyclotron energy (at the center of the Landau subbands) has the form:
| (12) | |||||
where is the energy gap, is related to the Kane momentum matrix element by , and are - and - exchange constants, and is the magnetization per unit cell.
In the field range of interest ( T), is of the same order as , while the exchange interaction is much smaller even in the saturation limit. Expanding the square root in Eq. (12), we obtain the final expression
| (13) |
where .
If we assume that and do not change appreciably with temperature, it follows from Eq. (13) that the peak shift should follow the temperature dependence of . This shift directly measures the carrier-Mn exchange interaction. To obtain quantitative agreement with the experiment, one should calculate by taking into account the possibility of short-range ordering, as discussed above Schliemann et al. (2001); Alvarez et al. (2002). This effect could substantially modify the band structure at low magnetic fields. At high magnetic fields, however, this effect should be smoothed out by the field-induced magnetic ordering. In the following we neglect this effect and calculate via standard mean-field theory Ashcroft and Mermin (1976), solving the transcendental equation
| (14) |
where is the free electron factor, is the Brillouin function, and is the spin of the magnetic ion.
The temperature dependence of the resonance field, calculated using Eqs. (13)-(14), is presented in Fig. 15 (b). Parameters used in the calculation are = 0.09, = 55 K, = 0.4 eV, = 21 eV, and eV. It shows that from room temperature to 30 K the the resonance magnetic field decreases by 20%, approximately the result observed in the experiment. In addition, we find that the shift is nonlinear with temperature and the main shift occurs at temperatures well above , which is also consistent with the experiment.
One word of caution should be noted. While our theoretical calculations (eq. 13) predict a definite shift in the hole cyclotron resonance peaks with an increase in the magnetization of the Mn spins, in apparent agreement with the experimental results, this agreement might be fortuitous. There are two possible sources of discrepancy between theory and experiment that must first be resolved before a definitive conclusion can be reached. One is that there could be a possible difference between the Mn concentration and the effective Mn concentration, i.e. not all Mn ions contribute to . The second is that one must rule out any contributions from the interface or the (Al,Ga)Sb layers.
IV Conclusions
We have presented a theoretical and experimental study of the electronic and magneto-optical properties of -type paramagnetic In1-xMnxAs dilute magnetic semiconductor alloys and ferromagnetic p-type In1-xMnxAs/(Al,Ga)Sb thin films in ultrahigh magnetic fields oriented along [001]. We used an 8-band Pidgeon-Brown model generalized to include the wave vector dependence of the electronic states along as well as the and exchange interactions with the localized Mn electrons. The Curie temperature is taken as an input parameter and the average Mn spin is treated in mean field theory.
In the case of p-type InMnAs we find that: (i) Mn doping changes the spin states of the DMS system. We find that Mn doping shifts the HH spin down state to the valence band edge which, in the absence of doping, is a LH spin up state . The spins of the itinerant holes are thereby flipped through the exchange interaction with the localized Mn moments. (ii) Two primary CR absorption peaks are present for magnetic fields up to 300 Tesla for h-active polarization with a photon energy of eV. These peaks correspond to and transitions. (iii) CR transitions take place at not only the zone center, but also in the regions away from the point. The camel back structures in some of the Landau subbands enhance this effect. (iv) E-active CR absorption in p-type InMnAs is observed and arises due to the complexity of the valence bands. These transitions are seen to arise from transitions between different hole ladders ( or ). Because h-active CR takes place in the same ladder, both e-active CR and h-active CR can be used to explore the complex valence bands.
In calculating the valence band structure and CR absorption, we find that valence band structure and CR absorption strongly depends on the material parameters. The LH transitions is more affected by changes in the values of these parameters than the HH transitions. This in turn can be used as a method to evaluate these parameters. The CR spectra strongly depends on hole densities through the dependence on the Fermi energy in the valence bands. This can also be used to estimate the hole densities, which becomes more meaningful due to the difficulty in traditional methods to measure the carrier densities because of the anomalous Hall effect.
In ferromagnetic p-InMnAs/(Al,Ga)Sb, two strong CR peaks are observed which shift with position and increase in strength as the Curie temperature is approached from above. The shift in the peaks is predicted theoretically and an expression for the shift is given. This transition takes place well above the Curie temperature and can be attributed to the increase in magnetic ordering at low temperatures.
Appendix A Validity of 8 band calculations in high magnetic fields

An important question which arises is ”How accurate is an 8 band model for magnetic fields that are 100 T or more?” One can make a simple estimate for the accuracy of the 8 band model. The presence of a magnetic field in the direction quantizes the carrier orbits in the plane. These quantized orbits are approximately given by
| (15) |
where is the cyclotron frequency. Factoring out the effective mass we obtain
| (16) |
Note that this is essentially equivalent to the Bohr-Sommerfeld quantization conditions for circular orbits as described in Kittel.Kittel (1996)
The maximum value for on an orbit occurs when . When this occurs, the magnetic field is related to by:
| (17) |
While this is a simplified model (the hole orbits are not circular but have a complex shape due to warping of the bands), it allows us to estimate for what magnetic fields for which the 8 band theory is valid.
In Fig. 16 we plot the conduction bands as calculated by both 8 band (solid line) and full-zone 30 band (dashed line) calculations.Cardona and Pollak (1966); Bailey et al. (1990); Stanton et al. (1990) Also plotted is the empirical expression for a nonparabolic conduction band (dotted line)
| (18) |
where is the nonparabolicity parameter. As can be seen, the agreement between the 30 band full-zone calculation and the 8-band model is very good up to about 15-20% of the X and L points at the brillouin zone boundary.

In Fig. 17, we see the three valences bands plotted for both the 8 band model (solid lines) and the full-zone 30 band model (dashed lines). Here the agreement is not as good as the conduction band with the 8 band model agreeing with the full-zone model only to about 10-15% of the zone boundary. (Note that we have not tried to optimize the parameters of the 30 band model to produce maximum agreement).
Since the cyclotron resonance transitions involve the transition, we would expect that the 8 band model would be valid up to magnetic fields given by Eq. 17 with n=1 and 0.1 to 0.15 where is the zone boundary wavevector in the direction and is the lattice constant. For InAs, the lattice constant is 6.06.
Substituting into Eq. 17, we see that if the 8 band model gives agreement with the full zone for 10% of the zone boundary, then the maximum magnetic field is about 234 T. For 15%, the maximum field is 520 T, and for 20% the field is 930 T.
These are rather large fields so it is not surprising that good agreement is reached for both the heavy hole transitions (at 50 T) and the light hole transitions (at 150 T). The higher order transitions occurring at around 400 T in the experimental data do not agree as well with the theoretical calculations and might be attributed to the breakdown in the 8 band model.
Acknowledgements.
This work was supported by the National Science Foundation ITR program through grant DMR-032547 and by DARPA MDA 972-00-1-0034.References
- Munekata et al. (1992) H. Munekata, T. Penny, and L. L. Chang, Phys. Rev. Lett. 68, 2664 (1992).
- Ohno et al. (1992) H. Ohno, H. Munekata, T. Penney, S. von Molnar, and L. L. Chang, Phys. Rev. Lett. 68, 2664 (1992).
- Ohno et al. (1996) H. Ohno, A. Shen, F. Matsukara, A. Oiwa, A. Endo, S. Katsumoto, and Y. Iye, Appl. Phys. Lett. 69, 363 (1996).
- Matsukura et al. (1998) F. Matsukura, H. Ohno, A. Shen, and Y. Sugawara, Phys. Rev. B 57, R2037 (1998).
- Kikkawa and Awschalom (1998) J. M. Kikkawa and D. D. Awschalom, Nature (London) 397, 139 (1998).
- Ohno et al. (1999) Y. Ohno, D. K. Young, B. Beschoten, F. Matsukura, H. Ohno, and D. D. Awschalom, Nature (London) 402, 790 (1999).
- Sanvito et al. (2001) S. Sanvito, P. Ordejon, and N. A. Hill, Phys. Rev. B 63, 165206 (2001).
- Konig et al. (2001) J. Konig, H. Lin, and A. H. MacDonald, Interacting Electrons in Nanostructures, Lecture Notes in Physics (Springer, Berlin, 2001).
- Matsuda et al. (2002) Y. H. Matsuda, T. Ikaida, M. Miura, S. Kuroda, F. Takano, and K. Takita, Phys. Rev. B 65, 115202 (2002).
- Matsuda et al. (2001) Y. H. Matsuda, T. Ikaida, N. Miura, M. A. Zudov, J. Kono, and H. Munekata, Physica E 10, 219 (2001).
- Zudov et al. (2002) M. A. Zudov, J. Kono, Y. H. Matsuda, T. Ikaida, N. Miura, H. Munekata, G. D. Sanders, Y. Sun, and C. J. Stanton, Phys. Rev. B 66, 161307(R) (2002).
- Khodaparast et al. (2003a) G. A. Khodaparast, J. Kono, Y. H. Matsuda, N. Miura, T. Slupinski, A. Oiwa, and H. Munekata, Proc. of the 26th Int. Conf. on the Phys. of Semicond. (2003a).
- Khodaparast et al. (2003b) G. A. Khodaparast, M. A. Zudov, J. Kono, Y. H. Matsuda, T. Ikaida, S. Ikeda, N. Miura, T. Slupinski, A. Oiwa, H. Munekata, et al., J. Supercond. 16, 107 (2003b).
- Sanders et al. (2003a) G. D. Sanders, Y. Sun, C. J. Stanton, G. A. Khodaparast, J. Kono, Y. H. Matsuda, N. Miura, T. Slupinski, A. Oiwa, and H. Munekata, J. Appl. Phys. 93, 6897 (2003a).
- Sanders et al. (2003b) G. D. Sanders, Y. Sun, F. V. Kyrychenko, C. J. Stanton, G. A. Khodaparast, M. A. Zudov, J. Kono, Y. H. Matsuda, N. Miura, and H. Munekata, Phys. Rev. B 68, 165205 (2003b).
- Pidgeon and Brown (1966) C. R. Pidgeon and R. N. Brown, Phys. Rev. 146, 575 (1966).
- Bassani and Parravicini (1975) F. Bassani and G. P. Parravicini, Electronic States and Optical Transitions in Solids (Pergamon, New York, 1975).
- Munekata et al. (1993) H. Munekata, A. Zaslavski, P. Fumagalli, and R. J. Gambino, Appl. Phys. Lett. 63, 2929 (1993).
- Vurgaftman et al. (2001) I. Vurgaftman, J. R. Meyer, and L. R. Ram-Mohan, J. Appl. Phys. 89, 5815 (2001).
- Kacman and Zawadzki (1971) P. Kacman and W. Zawadzki, Phys. Status Solidi B 47, 629 (1971).
- Anderson (1961) P. W. Anderson, Phys. Rev. 121, 41 (1961).
- Kittel (1968) C. Kittel, Solid State Physics 22, 1 (1968).
- Hewson (1993) A. C. Hewson, The Kondo Problem to Heavy Fermions (Cambridge University Press, New York, 1993).
- Munekata et al. (1991) H. Munekata, H. Ohno, R. R. Ruf, R. J. Gambino, and L. L. Chang, J. Cryst. Growth 111, 1011 (1991).
- Dietl et al. (2000) T. Dietl, H. Ohno, F. Matsukura, J. Cibert, and D. Ferrand, Science 287, 1019 (2000).
- König et al. (2000) J. König, H.-H. Lin, and A. H. MacDonald, Phys. Rev. Lett. 84, 5628 (2000).
- Kaminski and Sarma (2002) A. Kaminski and S. D. Sarma, Phys. Rev. Lett. 88, 247202 (2002).
- Zarand and Jankó (2002) G. Zarand and B. Jankó, Appl. Phys. Lett. 89, 047201 (2002).
- Goy and Grimes (1973) P. Goy and C. C. Grimes, Phys. Rev. B 7, 299 (1973).
- Chin and Sievers (1981) A. K. Chin and A. J. Sievers, J. Appl. Phys. 52, 7380 (1981).
- Slupinski et al. (2002) T. Slupinski, A. Oiwa, S. Yanagi, and H. Munekata, J. Cryst. Growth 237-239, 1326 (2002).
- Hayashi et al. (2001) T. Hayashi, Y. Hashimoto, S. Katsumoto, and Y. Iye, Appl. Phys. Lett. 78, 1691 (2001).
- Potashnik et al. (2001) S. J. Potashnik, K. C. Ku, S. H. Chun, J. J. Berry, N. Samarth, and P. Schieffer, Appl. Phys. Lett. 79, 1495 (2001).
- Nakao et al. (1985) K. Nakao, F. Herlach, T. Goto, S. Takeyama, T. Sakakibara, and N. Miura, J. Phys. E: Sci. Instrum. 18, 1018 (1985).
- Matsuda et al. (1997) Y. H. Matsuda, H. Arimoto, N. Miura, H. Ohno, A. Shen, and F. Matsukura, in 3rd Symp. on Phys. & Appl. of Spin-Related Phenomena in Semicond. (1997), p. 42.
- Hirakawa et al. (2002) K. Hirakawa, T. Hayashi, Y. Hashimoto, and Y. Iye, Phys. Rev. B 65, 193312 (2002).
- Okabayashi et al. (2002) J. Okabayashi, T. Mizokawa, D. D. Sarma, A. Fujimori, T. Slupinski, A. Oiwa, and H. Munekata, Phys. Rev. B 65, 161203 (2002).
- Brazis and Kossut (2002) R. Brazis and J. Kossut, Solid State Commun. 122, 73 (2002).
- Schliemann et al. (2001) J. Schliemann, J. König, and A. H. MacDonald, Phys. Rev. B 64, 165201 (2001).
- Alvarez et al. (2002) G. Alvarez, M. Mayr, and E. Dagotto, Phys. Rev. Lett. 89, 277202 (2002).
- Sanders et al. (2003c) G. D. Sanders, Y. Sun, C. J. Stanton, G. A. Kondaparast, J. Kono, Y. H. Matsuda, N. Miura, T. Slupinski, A. Oiwa, and H. Munekata, J. Supercond. 15, 449 (2003c).
- Ashcroft and Mermin (1976) N. W. Ashcroft and N. D. Mermin, Solid State Physics (Saunders College, Philadelphia, 1976).
- Kittel (1996) C. Kittel, Introduction to Solid State Physics (John Wiley & Sons, New York, 1996), p. 257, 7th ed., note that this is equation 30 in Kittel for a spherical orbit.
- Cardona and Pollak (1966) M. Cardona and F. H. Pollak, Phys. Rev. 142, 530 (1966).
- Bailey et al. (1990) D. W. Bailey, C. J. Stanton, and K. Hess, Phys. Rev. B 42, 3423 (1990).
- Stanton et al. (1990) C. J. Stanton, D. W. Bailey, and K. Hess, Phys. Rev. Lett. 65, 231 (1990).