Theoretical Predictions of Superconductivity in Alkali Metals under High Pressure
Abstract
We calculated the superconductivity properties of alkali metals under high pressure using the results of band theory and the rigid-muffin-tin theory of Gaspari and Gyorffy. Our results suggest that at high pressures Lithium, Potassium, Rubidium and Cesium would be superconductors with transition temperatures approaching . Our calculations also suggest that Sodium would not be a superconductor under high pressure even if compressed to less than half of its equilibrium volume. We found that the compression of the lattice strengthens the electron-phonon coupling through a delicately balanced increase of both the electronic and phononic components of this coupling. This increase of the electron-phonon coupling in Li is due to an enhancement of the - channel of the interaction, while in the heavier elements the - channel is the dominant component.
I Introduction
Neaton and Ashcroft neaton predicted that at high pressures Li forms a paired ground state. Subsequently, Christensen and Novikov christensen showed that Li under increased pressure may reach a superconducting transition temperature =. This prediction has been supported by Shimizu et al shimizu and Struzhkin et al struzhkin who reported measurements of superconductivity in compressed Li with a ranging from to . The overestimate of reported in Ref[2] is probably due to an error by these authors as we discuss in Sec. III. Using the rigid-muffin-tin approximation(RMTA) formulated by Gaspari and Gyorffy gaspari , we performed calculations for two other alkali metals, K and Rb, and predicted that at high pressures they both would be superconductors with transition temperatures approaching k_rb . Before these works, the only known superconducting alkali metal was Cs, which becomes superconducting above 7.0 GPa with a transition temperature of about . wittig Similar theoretical results for Li, K and Cs were also reported by Ashcroft ashcroft , Profeta et al. profeta , Kasinathan et al. kasinathan , Tse et al tse and Stocks et al. stocks
In this paper, we have extended our study to Li, Na and Cs using again the RMTA. Our calculations demonstrate that Li and Cs display superconductivity at high pressure above 15 GPa and 3.5 GPa respectively. Our results also showed the lack of superconductivity for Na up to 90 GPa. We compare these new calculations with our previous results of K and Rb to show a complete picture of superconductivity properties of alkali metals under high pressure. Our calculations indicate that the - channel of contribution to the Hopfield parameter dominates Li under high pressure, while the - channel contribution is the major reason that K, Rb and Cs become superconductors under high pressure.
The massive structural phase transitions of all alkali metals have be extensively investigated during the past few decades. liu ; xie ; tse ; young ; hanfland ; schwarz ; katzke ; deemyad All alkali metals were found to be stable with structure under ambient pressure and will transform to the structure at about 20, 65, 11.5, 7, and 2.3 GPa pressure for Li, Na, K, Rb and Cs respectively. In this paper, our investigations are focused on the and structures within the above pressure ranges which correspond to volume changes as large as from equilibrium. The conclusions we draw in this paper are valid for the structure which is stable in the experimental range of pressure.
Tomita et al tomita recently reported experimental results for Li, Na and K. They confirmed the superconductivity of Li above 20 GPa at temperatures reaching 15 . They also pointed out the absence of superconductivity in Na and K for pressure up to 65 and 43.5 GPa respectively without specifying whether the measurements were extended to the phase. However, for K, our calculations and those of Profeta et al profeta show superconductivity in the phase. Further experimental work may be required.
II Theory and computational details
McMillan’s strong coupling theory mcmillan defines an electron-phonon coupling constant by:
| (1) |
where is the atomic mass; is the Hopfield parameter hopfield ; is the total density of states(DOS) per spin at the Fermi level, ; is the square of the electron-ion matrix element at ; and is the average phonon frequency. The is determined by the RMTA approximation given by Gaspari and Gyorffy gaspari (GG) formula:
| (2) |
where are scattering phase shifts, is the th component of the DOS per spin, and is the free scatterer DOS.
There are two important papers that address the question of the spherical approximation in the GG theory. The first one by John john shows that the GG formula is exact for cubic systems with one atom in the unit cell and with +1 up to 2. This validates our results for Li and Na where the - and - channels have negligible contributions. In addition, Butler et al. butler have obtained a generalization of the GG formula for 2 that is exact for systems in which all atoms sit at sites having cubic symmetry. Their expression contains certain cross terms which they showed have small or canceling contributions to the value of . Therefore, our calculations for K, Rb, and Cs which have strong diagonal contributions from - but not - scattering are also reliable.
In order to determine the quantities entering Eq. 2, we performed Augmented Plane Wave (APW) calculations of the band structures and total energies of the targeted alkali metals in the local density approximation(LDA) following the Hedin-Lundqvist prescription hedin in both and structures, for a wide range of pressures. Since the LDA underestimates the equilibrium lattice constant of alkali metals by approximately we applied a uniform shift to our results for so that at the experimental equilibrium volume we have the minimum energy. To accomplish this the pressure shifts are 1.5, 0.4, 0.4, 0.4 and 0.25 GPa for Li, Na, K, Rb and Cs respectively. We also used the APW results to determine the pressure variation of the bulk moduli . The values were used to compute the average phonon frequency which has been taken to be proportional to the product of bulk modulus and volume jarlborg :
| (3) |
where the constant C is determined by the and the Debye temperature under normal pressure using the formula:
| (4) |
The approximation made in using Eq. 3 and Eq. 4 gives reasonable values of and leads us to believe that our results should differ only quantitative from direct phonon evaluations via linear response theories. The transition temperature for superconductivity is given by the McMillan equation mcmillan :
| (5) |
where is the Coulomb pseudopotential, that we have set equal to 0.13.
III Results
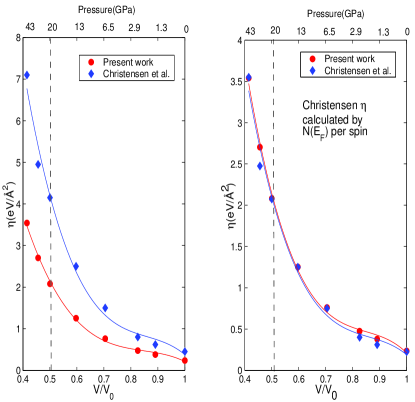
Before we present our detailed results, we wish to bring to the attention of the reader that in our opinion there must be an error in the evaluation of for Li by Christensen and Novikov. christensen The error is that in Eq. 1 they must have used for two spins instead of one as is the correct implementation of the Mcmillan theory. Fig. 1(left panel) demonstrates a clear discrepancy between our results and those of Ref 2. Dividing the of Ref 2 by two gives a perfect agreement with our results as shown in Fig. 1(right panel) and as we discuss below lowers the value of and brings close to the measured value.
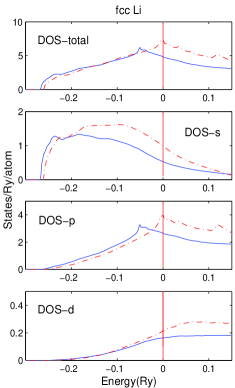
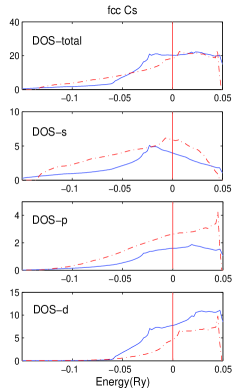
To demonstrate the effect of high pressures on the density of states at the Fermi level for alkali metals we plotted the total density of states and its angular momentum decompositions for Li and Cs under ambient and high pressures in Fig. 2. For Li, we note that both and its angular momentum decompositions decrease under pressure. On the other hand, for Cs, we observe a decrease of the and -like density of states with a remarkable increase of the -like density of states under high pressure. This increase of the density of states at makes the largest contribution to the large value of at large pressure as discussed below. We also observed the same trend as in Cs for the alkali metals K and Rb. In contrast, for both the and phases of Li and Na, the density of states decreases as the lattice is compressed. This fact gives a partial explanation of the absence of superconductivity under high pressure for Na. For Li, however, the increase in the matrix elements is strong enough to ensure the overall large increase in , which we will discuss later.
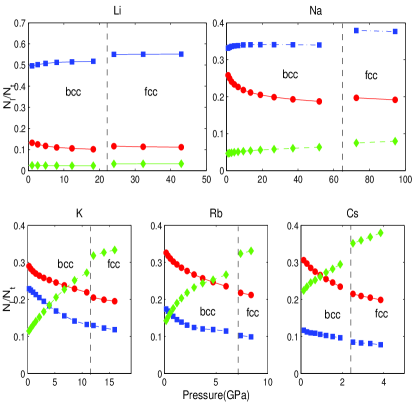
We show the ratios as a function of pressure in Fig. 3 where the vertical line indicates the pressure where the transition from to occurs in the experiments. These ratios are crucial in the determination of . It is important to note that the ratio of the heavier alkali metals K, Rb and Cs increases rapidly as a function of increasing pressure. The buildup of the -like DOS under high pressure causes the large values of for the heavier elements under high pressure shown in Fig. 4. For Li and Na, the ratio is very small and the ratio dominates. We note that for Na, the ratio decrease with increasing pressure.
In Fig. 4, we show the total and its contributions from -, - and - scattering channels as a function of pressure in both the and structures. in all five alkali metals in the and lattices increases significantly with increasing pressure. Among all alkali metals, Li has the second largest increase of with increasing pressure, which is one of the reasons why Li is a superconductor under high pressure. Fig. 4 shows that different elements have different scattering channels as the dominant contributors to the total . More specifically for Li and Na, the contribution of the - channel increases rapidly with increasing pressure while the other two contributions stay around zero. For K and Rb, when pressure is increased the contributions from both the - and - channels increase quickly. For Cs, the - channel contributes the major increase of with pressure increasing. For all elements, the contribution of - channel is always very close to zero. The graph also demonstrates that the largest portion of the increase in Li and Na under high pressure is contributed by the - channel. Na shows the largest value of among all the alkali metals when pressure reaches 90 GPa. However, as we discuss below Na has a very large value of which lowers significantly the value of .
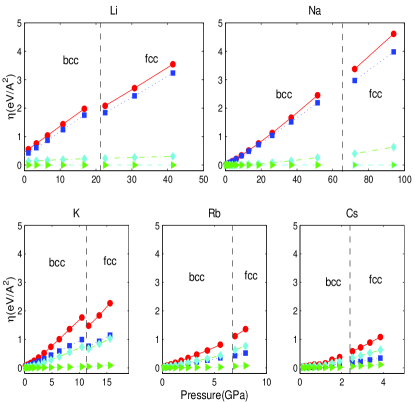
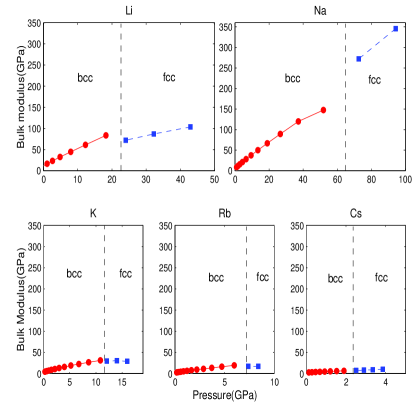
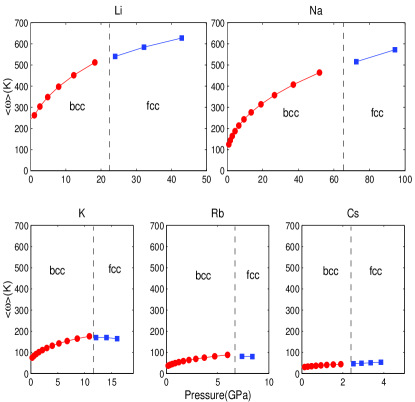
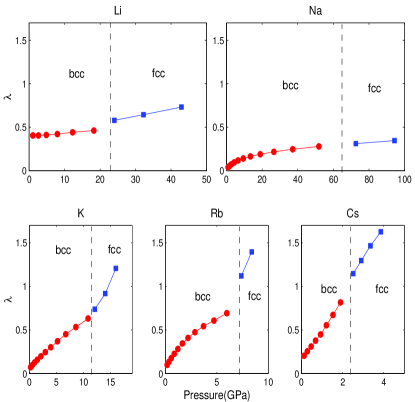
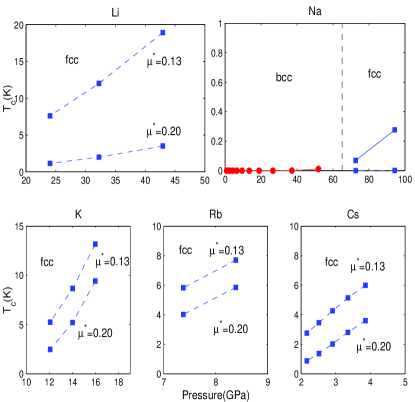
Fig. 5 shows the increase of the bulk modulus as a function of pressure. We note that the bulk moduli of Li and Na increase dramatically with increasing pressure. The bulk modulus increase of K, Rb and Cs is around to of that for Li and Na. Fig. 6 shows the prefactor, , in the McMillan equation. We note that the for Li and Na, in both and structures, increases much faster than in the other alkali metals. This is the other reason that Li has larger than K, Rb, and Cs despite the fact that of K, Rb, and Cs can be larger than that of Li under pressure. Combining the values of and , we determined the electron-phonon coupling constant using Eq. 1. In Fig. 7, we show as a function of pressure. It is evident that for the alkali metals Li, K, Rb, and Cs, under pressure, reaches large values suggesting that these metals could display superconductivity. To quantify our predictions for superconductivity, we have calculated for all five elements in both the and structures at high pressure using the McMillan equation with Coulomb pseudopotential values and 0.20. Fig. 8 shows the of the five alkali metals in the structure as a function of pressure. As one might expect from the large values of the electron-phonon interaction , the elements Li, K, Rb, and Cs are predicted to be superconductors with larger than 5 for pressures higher than 20, 11, 7, and 3.5 GPa respectively. Clearly our results for the value of are sensitive to the value of and increase of to 0.2 suppresses by a factor of four for Li and about to for K, Rb and Cs, as shown in Fig. 8.
Our calculations suggest that Na does not display superconductivity because the electron-phonon coupling constant remains small () for compressions up to 90 GPa as shown in Fig. 7. The absence of superconductivity for Na is determined by delicate balance of the increasing electronic and phononic components of the electron-phonon coupling constant. Na has a which increases faster than in K, Rb and Cs, but slower than in Li. However, the increase of in Na is mostly canceled out by its which increases much more rapidly than in K, Rb and Cs. Therefore, Na does not display strong enough electron-phonon coupling to become a superconductor under high pressure up to 90 GPa in both the and structures.
IV CONCLUSIONS
As it can be seen from Eq. 1, the increase of may be caused by either an increase of or a decrease of , or a combination of these two factors. For K, Rb, and Cs, because the increase of the bulk modulus under pressure is slow, the increase of , which is mainly caused by an increase of , dominates the determination of . Therefore, K, Rb, and Cs have a large under high pressure, which results in the prediction of superconductivity. The increase of in Li under pressure is due to the increase of rather than , which is actually decreasing under pressure, and overcomes the increase of which in fact helps by increasing the prefactor in the equation. Therefore, Li would be a superconductor under high pressure. Na is different from Li and from the other alkali metals because its large is canceled by the increasing bulk modulus under pressure which reduces the value of . Therefore, a delicate balance of and results in Li being a superconductor but not Na. Our calculated for Li showing in Fig 8 is in very good agreement with experiment. shimizu
It should be mentioned here that Tse et al tse argued that the softening of the phonon branch near the point causes the occurrence of superconductivity in Li. Our view is that this is an oversimplification and is not a sufficiently quantitative explanation. On the other hand the RMTA takes an average in all directions on the Fermi surface and not just in one high symmetry point. Regarding the mechanism of superconductivity in K, Rb, and Cs we suggest that this is due to the increased -like character of the wave functions at at high pressures. This enhanced character near has also been documented by other authors louie and by experiment badding . We used it here to justify the RMTA which is successful in transition metals as shown by Papaconstantopoulos et al. papa_super
Acknowledgment: We wish to thank Dr. Michael J. Mehl for valuable discussions and comments.
References
- (1) J.B. Neaton and N.W. Ashcroft, Nature, 400, 141 (1999).
- (2) N.E. Christensen and D.L. Novikov, Phys. Rev. Lett. 86, 1861 (2001).
- (3) K. Shimizu, H. Ishikawa, D. Takao, T. Yagi and K. Amaya, Nature, 419, 597-599 (2002).
- (4) V. V. Struzhkin, M. I. Eremets, W. Gan, H. K. Mao and R. J. Hemley, Science, 298, 1213 (2002).
- (5) G.D.Gaspari and B.L.Gyorffy, Phys. Rev. Lett. 28, 801 (1972);
- (6) Lei Shi, D. A. Papaconstantopoulos, M. J. Mehl, Solid State Communications, 127,13-15 (2003)
- (7) Jörg Wittig, Phys. Rev. Let., 24,812-815 (1970)
- (8) N.W. Ashcroft, Nature, 419, 569 (2002).
- (9) G. Profeta, C. Franchini, N.N. Lathiotakis, A. Floris, A. Sanna, M.A. L. Marques, M. Lüders,4S. Massidda,2 E.K.U. Gross, and A. Continenza, Phys. Rev. Lett. , 96, 047003 (2006).
- (10) Deepa Kasinathan, J. Kunes, A. Lazicki, H. Rosner, C. S. Yoo, R. T. Scalettar, W. E. Pickett, Phys. Rev. Lett. , 96, 047004 (2006).
- (11) J. Tse, Y. Ma and H. Tutuncu, J. Phys.: Condens. Matter, 17, S911 (2005).
- (12) G. M. Stocks, G. D. Gaspari and B. L. Gyorffy, J. Phys.: F: Metal Phys., 2 L123 (1972).
- (13) A. Liu, A. Quong, J. Freericks, E. Nicol and E. Jones, Phys. Rev. B, 59, 4028 (1999).
- (14) J. Xie, S. Chen, J. Tse, D. Klug, Z. Li, K. Uehara and L. Wang, Phys. Rev. B, 62, 3624 (2000).
- (15) D. A. Young Phase Diagrams of Elements, University of california Press, Berkeley, 1991.
- (16) M. Hanfland, I. Loa and K. Syassen, Phys. Rev. B, 65, 184109 (2002).
- (17) U. Schwarz, A. Grzechnik, K. Syassen, I. Loa and M. Hanfland, Phys. Rev. Lett. 83, 4085 (1972).
- (18) H. Katzke and P. Toledano Phys. Rev. B, 71, 184101 (2005).
- (19) S. Deemyad and J. Schilling, Phys. Rev. Lett. 91, 167001 (2003).
- (20) Tomita T, Deemyad S, Hamlin JJ, Schilling JS, Tissen VG, Veal BW, Chen L, Claus H, J. of Phys.- Cond. Mat. 17 (11): S921-S928 Sp. Iss. SI, MAR 23 2005
- (21) W.L. McMillan, Phys. Rev. 167, 331 (1968); P.B. Allen and R.C. Dynes, Phys. Rev. B 12, 905 (1975)
- (22) J. J. Hopfield Phys. Rev. 186, 443 (1969)
- (23) W. John, J. Phys. F:Met. Phys. V.3 L231 (1973).
- (24) W. H. Butler, J. J. Olson, J. S. Faulkner and B. L. Gyorffy. Phys. Rev. B, 14, 3823 (1976)
- (25) L. Hedin and B. L. Lundqvist. J. Phys. C:Solid State Phys. V.4 (1971).
- (26) T. Jarlborg, Phys. Scr. 37, 795 (1988)
- (27) S. G. Louie and M. L. Cohen, Phys. Rev. B 10, 3237 (1974)
- (28) L. J. Parker, M. Hasegawa, T. Atou and J. V. Badding, European Journal of Solid State and Inorganic Chemistry 34, 693 (1997)
- (29) D.A. Papaconstantopoulos, L.L. Boyer, B.M. Klein, A.R. Williams, V.L. Moruzzi and J.F. Janak Phys. Rev. B 15, 4221 (1977)