Theoretical study of resonant x-ray emission spectroscopy of Mn films on Ag
Abstract
We report a theoretical study on resonant x-ray emission spectra (RXES) in the whole energy region of the Mn white lines for three prototypical Mn/Ag(001) systems: (i) a Mn impurity in Ag, (ii) an adsorbed Mn monolayer on Ag, and (iii) a thick Mn film. The calculated RXES spectra depend strongly on the excitation energy. At excitation, the spectra of all three systems are dominated by the elastic peak. For excitation energies around , and between and , however, most of the spectral weight comes from inelastic x-ray scattering. The line shape of these inelastic “satellite” structures changes considerably between the three considered Mn/Ag systems, a fact that may be attributed to changes in the bonding nature of the Mn- orbitals. The system-dependence of the RXES spectrum is thus found to be much stronger than that of the corresponding absorption spectrum. Our results suggest that RXES in the Mn region may be used as a sensitive probe of the local environment of Mn atoms.
pacs:
78.70.Ck, 73.61.At, 75.70.Ak, 78.70.DmI Introduction
With the advent of 3rd generation sources of synchrotron radiation, resonant x-ray emission spectroscopy (RXES) has recently been used to investigate the nature of localization of the and/or electrons for strongly correlated electron systemskot01 ; but00 . In particular, RXES has often been applied to transition metal (TM) compounds in order to study intra-atomic () excitations as well as charge transfer (CT) excitationskot01 ; but00 ; mag02 ; ghi04 . An accurate mapping of these two types of excitations is very useful for a better understanding of these systems. In RXES spectra of typical TM compounds such as MnO, the features of the CT excitation are clearly separated from those of the excitation, because in these systems the CT energy is largebut96 . This separation obviously greatly simplifies the analysis of the spectra. It is, however, important to explore the behavior of these two types of excitations also in the less favorable case where a clear separation of and CT features in the RXES spectra is impossible. It is the first aim of this paper to present such a study.
The second aim is to make predictions for RXES spectra of Mn films on Ag(001), which is an interesting and well characterized example of supported ultra thin transition metal films. The fundamental and technological interest of these systems, in particular their magnetic properties, is well known dru88 ; rau88 ; bin92 ; kru96 ; rad97 ; sch97 ; kru99 .
Recently, we have presented calculations of the x-ray photoemission (XPS), x-ray absorption (XAS), and (a few) resonant x-ray emission spectra (RXES) of several Mn/Ag thick film structureskru03 ; tag04 . By combining band structure, atomic multiplet and impurity Anderson model calculations, we constructed a realistic impurity model that includes full intra-atomic multiplet interaction and inter-atomic coupling to the Mn- and Ag- bands. The calculated Mn XPS spectra reproduced well the experimental ones in the whole range of structures from Mn impurities in Ag to bulk bct Mn. These calculations indicate that the satellite structure observed in the ultra-thin films is due to a final state charge transfer process, mainly from the Mn- majority spin state on the neighboring atoms to the empty minority spin state of the emitter atom. As an interesting ”by-product” of these studies we found that the CT energy is much smaller in Mn/Ag than in MnO. This fact suggests that in Mn/Ag, CT and excitations coexist in the same energy range. Mn/Ag is therefore an interesting case for our purpose, all the more that in these thick film systems, two parameters relevant for the CT excitation (CT energy and hybridization) can, to some extent, be controlled by the Mn coverage.
In order to vary these parameters, we have selected the following three Mn/Ag(001) systems for the present study: (i) a Mn impurity atom featuring weak hybridization to the Ag -band with moderate CT energy, (ii) an adsorbed Mn monolayer featuring weak and moderate hybridization to Ag and Mn -bands, respectively, with moderate and small CT energy, and (iii) a thick Mn film characterized by strong hybridization to the Mn -band with small CT energy.
Our previous paper in Ref.tag04 was devoted to a comparative study of XPS, XAS, RXES of Mn/Ag in order to construct a single model that is valid for all these spectroscopies. In the RXES part, only a few examples of spectra were shown. The present paper, in contrast, is devoted to a systematic study of the Mn RXES in a wide range of the incident photon energy for the three above mentioned Mn/Ag systems. We analyze the competition between CT and excitations in RXES and compare the different systems among them and with MnO. We also study the dependence of the RXES line shape on the hybridization strength. One main result is that the Mn RXES line shape varies appreciably as a function of hybridization and CT energy and the RXES spectra differ, accordingly, strongly between the three different Mn/Ag systems. This suggests that RXES may be used as a sensitive probe for the local environment of transition metal atoms.
The paper is organized as follows. In section II, we discuss the theoretical model. The results and discussion are given in section III and VI, respectively.
II Method of calculation
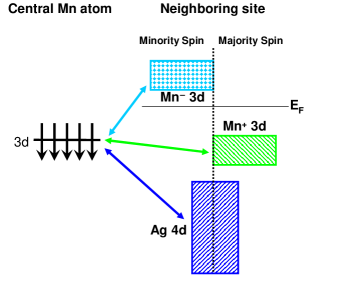
Here we give a brief description of the model. Further details may be found in Refs. kru03 and tag04 . For the system one Mn monolayer on Ag, a schematic diagrum of our impurity model is given in Fig. 1 which is based on the results of calculationkru03 . We take into account the Mn orbital of a central Mn atom (core hole site, which has a configuration) together with appropriate linear combinations of Mn orbitals (while the Mn band is filled for locally majority spin, which is denoted as Mn+, and empty for locally minority spin, which is denoted as Mn-) on neighboring sites and Ag filled orbitals of the Ag substrate.
| system independent impurity model parameters | |||||||||
|---|---|---|---|---|---|---|---|---|---|
| -3.012 | 3.0 | 4.123 | -2.5 | 0.5 | -5.0 | 4 | 0.5 | ||
| system dependent impurity model parameters | |||||||||
| system | |||||||||
| impurity in Ag | 3.0 | 0.866 | 0.0 | 0.0 | |||||
| ML | 3.0 | 0.5 | 1.0 | 0.8 | |||||
| Mn bct | 0.0 | 0.0 | 3.0 | 2.0 | |||||
The thick Mn film is modeled as bulk bct Mn. A single impurity Mn atom in Ag is hybridized to the Ag -band only.
The ground state of Mn monolayer on Ag system is represented as linear combinations of basis states from the manifold of the following eight configurations: , , , , , , (n=1,2). and denote holes in the Ag band and in the Mn band with (locally) majority spin, respectively. Mn- represents an electron in the Mn band with (locally) minority spin. For bct thick films, we have used the five configuration (, , , , n=1,2) and for Mn single atom on Ag system, only three configurations (, , n=1,2) were used. We assume a cubic point symmetry for all systems for simplicitytag04 . Note that, in Mn monolayer on Ag and Mn bct systems the local symmetry around the Mn atom is approximately Oh, and that in Mn impurity in Ag is exactly Oh.
The Hamiltonian is given by
| (1) | |||||
The first five terms of the total Hamiltonian are the atomic part describing the central Mn atom. The sixth term represents the band (, and Ag) and the last term describes the hybridization between the atomic Mn states and the band. The , , and represent the energies of Mn 3, Mn 2, and band states, respectively, with the irreducible representation ( = , ) of the Oh symmetry. The indices and are the orbital and spin states. , , and are the hybridization between the central Mn 3 and band states, the Coulomb interaction between Mn 3 states, that between Mn 3 and 2 core-hole states, respectively. The term describes the intra-atomic multiplet coupling between Mn 3 states and that between Mn 3 and 2 states. The spin-orbit interactions for Mn 3 and 2 states are also included. The Slater integrals and the spin-orbit coupling constant are calculated by Cowan’s Hartree-Fock programcow81 and then the Slater integrals are rescaled by 80, as usualgro90 . We assume rectangular bands of width W(X), and we approximate them by discrete levels , (). For the hybridization, we use the empirical relation: . The charge transfer energy is defined as .
The main contribution to Mn RXES corresponds to the process where is the occupation number in the ground state. Mn RXES is calculated on the basis of the formula of a coherent second order optical process as
| (2) | |||||
where , and are the ground, intermediate and final states of the Hamiltonian with energies and , respectively. The incident and emitted photon energies are represented by and , respectively. The core-hole lifetime broadening is denoted by for the core-hole in the intermediate states. The operators represents the optical dipole transition. The polarization of the incident photon is neglected, for simplicity.
Unless stated explicitly, the parameter values are the same as in Ref. tag04 and are also summarized in Table I.
III Calculated Results
We recall that we are considering the following three systems: (i) a Mn impurity in Ag (labelled ”impurity” in the figures below) (ii) an adsorbed Mn monolayer on Ag (labelled ”ML”), and (iii) a thick Mn film (labelled ”bct”).
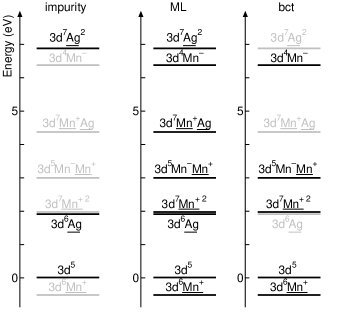
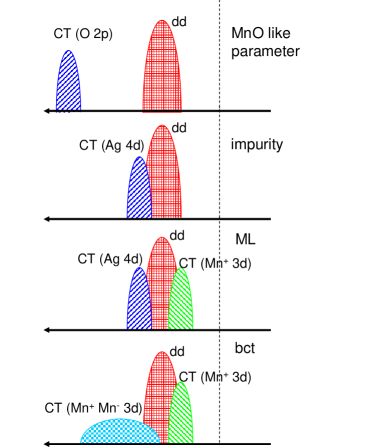
A schematic energy diagram of the initial (and RXES final) states for the three considered systems is shown in Fig. 2. The configuration averaged energies of the ionic configurations have been used which means that multiplet, crystal field and hybridization effects are neglected in the diagram, which would otherwise become too complex. It should be kept in mind, however, that all these effects shift and spread the levels. If we had represented, for example, the lowest lying multiplet energy of each configuration instead of the configuration averaged energies, the level ordering would be changed in several cases. In particular, the ( 6S) term is lowest in energy for all systems including bct Mn and ML rather than a () term as suggested by the configuration averaged energies. Despite these subtleties, it is instructive to look at this simplified diagram in order to get an idea about the CT excitation energies in the different systems.
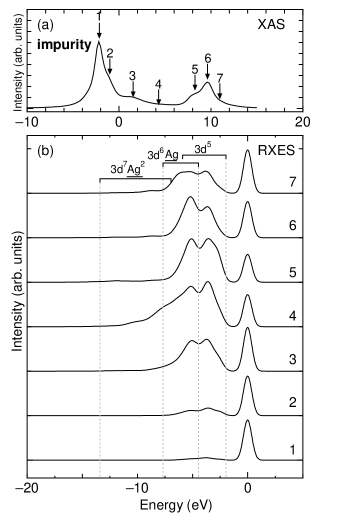
Let us start with the simplest system considered here: a Mn impurity in Ag. The calculated Mn XAS is shown in Fig. 3(a). Note that in contrast to Ref. tag04 we have now used an artificially reduced core hole lifetime broadening of 0.3 eV. This was done merely to enhance the resolution of spectral features for easier comparison. The calculated Mn RXES spectra are shown in Fig. 3(b) at various excitation energies across the energy region shown by arrows on the XAS spectra in Fig. 3(a). The Gaussian broadening is taken to be 0.5 eV. Two main inelastic peaks can be seen around, respectively, 4 eV and 5.5 eV below the elastic peak. At excitation energies on the white line (labelled 1 and 2), the elastic peak clearly dominates. For excitation energies increasing from to (excitation 3-5), most of the spectral weight shifts to the inelastic peaks before it goes partly back to the elastic one (exciatitation 6-7). On the spectra 4-7 a weak and broad feature at 7-13 eV can also be distinguished.
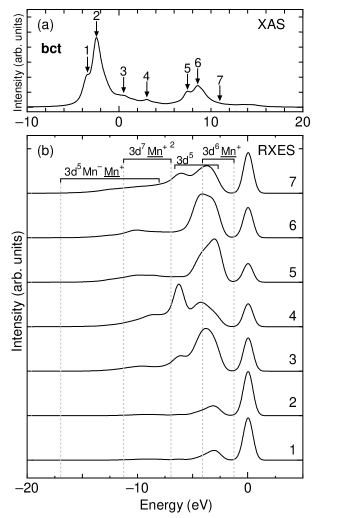
The RXES features are divided into three groups named as , and as is depicted in the left panel in Fig. 2 and also in Fig. 3(b). The enhancement of state mainly occurs well above the edge region (from excitations 3 to 7) with an intensity maximum just in between the and edges (excitations 4 and 5). This feature is assigned to the on-site excitations in the configuration. On the other hand, with further increasing the excitation energy, the feature is enhanced and has maximum intensity at excitation 4-7. Since the configuration lies far above and (see Fig. 2), it has a very small weight in the ground state, which explains the weakness of the corresponding feature in the RXES.


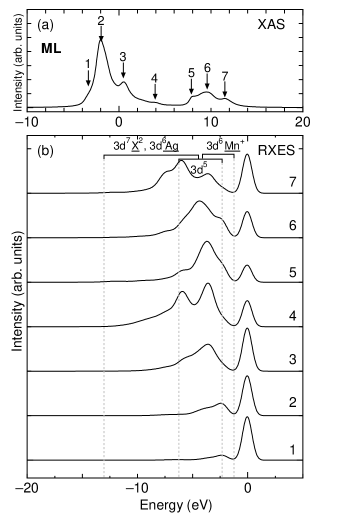
Next we consider the monolayer (ML) system. Since CT can occur both from the Ag and the Mn+ band, its electronic structure is more complicated than the ”impurity” system (see the middle panel in Fig. 2). The calculated RXES spectra are shown in Fig. 4. The most simple interpretation of these spectra would be to superimpose CT satellites originating from () onto the ”impurity” spectra with some weighting factor. This approach neglects, however, configuration mixing in the final state, which strongly modifies the spectral shape, especially the relative peak intensities. For the RXES spectra at excitations 4-6, the inelastic peaks dominate over the elastic one, a feature that is common to all three systems. At excitation 3, there is one broad inelastic structure centered at 3-4 eV with a weight comparable to the elastic peak. This inelastic peak is mainly due to the anti-bonding state that is formed by the hybridizaton between and , together with its multiplet structure. On the other hand, the spectra at excitation 4 has one more inelastic peak around 6 eV which we assign to the ( configuration. The reason for this is that excitation 4 corresponds to a XAS final state energy equal to that of the configuration. For higher excitation energies (5-7), weak and broad structures appear at 7-10 eV energy shift, in addition to the strong inelastic peak already mentionned. These structures are mainly due to the and states. At excitation 7, the 3d6( peak around 6 eV appears again for the same reason as in the case of excitation 4.

Finally, we move to the bct thick films where there is no charge transfer from the Ag substrate but a considerably strong hybridization (nearly two times larger than that of the ML system) from the neighboring Mn atoms exists. The calculated Mn RXES spectra for bct thick films are shown in Fig. 5. As depicted in the right panel in Fig. 2, the ground state is described by , , , , . Due to the comparable energy of the and states and the enhanced hybridization strength as compared to ML, the ground and RXES final states have strong configuration mixing. This results in more complicated RXES spectral shapes. We divide the RXES features into four groups named as , , and . In contrast to a Mn impurity in Ag, the inelastic peaks with the lowest energy shift are assigned to a CT excitation from states, rather than to a excitation. This is because, as we mentioned just before, the configuration-averaged energy of is slightly lower in energy than that of the state and they are strongly hybridized with each other.
On the other hand, the feature lies around 5-8 eV which is enhanced at excitation 4 and 7. Note that this feature is not due to the transitions but to anti-bonding states which are formed by hybridized and configurations. Since the Mn+ bands are rather strongly hybridized with the central Mn atom, the feature around 8-12 eV and broad features are also seen in the RXES spectra at excitations 3, 6 and 7.
IV Discussion
As shown above, the spectral shape of the inelastic satellites changes considerably among the three considered systems. For a Mn impurity in Ag, the two main inelastic peaks are essentially due to excitations, but the one at higher energy shift (5-6eV) is modified by a CT excitation from the Ag band. For the ML system, on the other hand, the lowest satellite is a mixture of excitations and CT satellite from the Mn+ band, while the part with higher energy shift (6 eV) is affected by CT satellites from the Ag band. For the bct system, finally, the CT satellite from the Mn+ band has the lowest excitation energy, whereas the structure is hard to see in this system. Since the spectral shapes are considerably complicated, explaining their dependence is not a trivial task from a general point of view. In this section, we show the hybridization strength dependence of RXES spectra to clearly distinguish between structure and CT satellite and to understand how CT excitations modify the structure.

For this purpose, we start by considering the atomic limit to view the original structure of . In Fig. 6, we have performed atomic multiplet calculations including the crystal field with Oh symmetry (10Dq=0.5 eV). The excitation has basically three structures at -3 eV, -4 eV, and -5.5 eV, while their relative intensities depend on the excitation energy. Qualitatively, the atomic RXES spectra ressemble those of Mn impurity in Ag and ML, but there are some discrepancies. In Mn impurity in Ag, the intensity of the lower part of structure (around 5-6 eV) is decreased and the peak become broad in contrast to the atomic calculation. In ML, new structures can be seen around 2.5 eV in addition to the lower part changes as well as the case of Mn impurity in Ag.

Next we study the dependence of RXES spectra as a function of hybridization. Figure 7 summarizes a qualitative study of the effect of increasing the hybridization for impurity system with respect to fixed parameters (, , , and 10Dq). As can be seen from Fig. 7, a CT satellite originating from appears when switching on the hybridization to the Ag band; its energy position almost coincides with the left-most of the three -peaks (at 5-6 eV). This is due to the small charge transfer energy eV with the notation of Ref.[2].
In a typical TM compound such as MnO, CT and excitations are clearly separated in the RXES spectra as shown in Fig. 8but96 . The structure is then hardly affected by the CT satellite even with some moderate hybridization strength. This is also indicated in the upper part of Fig. 9. In the present system, Mn impurity in Ag, the CT and excitation energy regions partly overlap (at 5-6 eV) as shown in the middle part of Fig. 9. The two types of excitations can therefore easily mix. This leads to a deformation of the structure at 5-6 eV which increases with hybridization strength. On the other hand, the hybridization dependence of the upper part of structure (around 3-4 eV) is similar to the crystal field dependence ( increasing the crystal field results in the change of the relative peak intensity and the peak shift only) and also to the hybridization dependence for MnO like parameters as shown in Fig. 8.
Let us next look at the hybridization dependence in the ML system. We show in Fig. 10 the RXES of ML for the hybridization varied between 0 eV and 0.5 eV with keeping the ratio . Figure 10 clearly shows that the inelastic structures with lowest energy shift (2-3 eV) are due to the hybridization with the Mn+ bands. Since the averaged configuration energy of (+) is very close to configuration ( eV), the corresponding CT satellite is lower than the excitation energy as is shown in the middle panel in Fig. 9. However, since the actual hybridization strength is not so big in the Mn/Ag system ( eV and eV) the structure can still be recognized in the spectrum.
Finally, let us consider the dependence of RXES spectra for bct thick film. As shown in Fig. 11, the RXES spectra strongly depends on . This is partly due to the fact that the hybridization strength is much bigger than in ML. In this case the original peaks are drastically modified and the spectra have a much richer structure.
We have shown that CT screening from the Ag and Mn bands strongly modifies the RXES line shape. In contrast to typical TM compounds, there is a strong mixing between excitations and CT satellites, which is mainly due to the much smaller CT energies involved.
V Concluding Remarks
In summary we have presented calculations of Mn XAS and RXES spectra for three kinds of Mn/Ag thick film structure. We have used an impurity model including full multiplet interaction and coupling to the Mn and Ag bands. This allowed us to investigate the interplay between on-site excitations and charge transfer screening from neighboring Mn and Ag atoms. The calculated RXES line shapes are very sensitive to the hybridization strength of Mn and Ag orbitals. Since our results show that in systems with small charge transfer energy the excitation structure is considerably modified by charge transfer screening, it would be interesting to verify it experimentally.
Acknowledgment
Financial support by the Centre National de la Recherche Scientifique through the a PICS program between France and Japan is gratefully acknowledged.
References
- (1) A. Kotani and S. Shin, Rev. Mod. Phys. 73, 203 (2001).
- (2) S. M. Butorin, J. Electron Spectrosc. Relat. Phenom. 110-111 213 (2000).
- (3) M. Magnuson, S. M. Butorin, J.-H. Guo, and J. Nordgren, Phys. Rev. B 65 205106 (2002).
- (4) G. Ghiringhelli, N. B. Brookes, E. Annese, H. Berger, C. Dallera, M. Grioni, L. Perfetti, A. Tagliaferri, and L. Braicovich, Phys. Rev. Lett. 92, 117406 (2004).
- (5) S. M. Butorin, J.-H. Guo, M. Magnuson, P. Kuiper, and J. Nordgren, Phys. Rev. B, 4405 (1996).
- (6) W. Drube and F. J. Himpsel, Phys. Rev. B 35, 4131 (1987).
- (7) C. Rau, G. Xing and M. J. Robert, J. Vac. Sci. Technol. A 6, 579 (1988).
- (8) C. Binns, H. S. Derbyshire, S. C. Bayliss, and C. Norris, Phys. Rev. B 45, 460 (1992).
- (9) P. Krüger, M. Taguchi, J. C. Parlebas and A. Kotani, Phys. Rev B 55, 16466 (1997).
- (10) O. Rader, E. Vescovo, M. Wuttig, D. D. Sarma, S. Blügel, F. J. Himpsel, A. Kimura, K. S. An, T. Mizokawa, A. Fujimori, and C. Carbone, Europhys. Lett. 39, 429 (1997).
- (11) P. Schieffer, C. Krembel, M. C. Hanf and G. Gewinner, J. Electron Spectrosc. Relat. Phenom. 104 127 (1999).
- (12) P. Krüger, J. C. Parlebas and A. Kotani, Phys. Rev B 59, 15093 (1999).
- (13) P. Krüger and A. Kotani, Phys. Rev B 68, 035407 (2003).
- (14) M. Taguchi, P. Krüger, J. C. Parlebas and A. Kotani, J. Phys. Soc. Jpn. 73, 1347 (2004).
- (15) P. Krüger, Physica B 318, 310 (2002).
- (16) R. D. Cowan, The Theory of Atomic Structure and Spectra (University of California Press, Berkeley, 1981).
- (17) F. M. F. de Groot, J. C. Fuggle, B. T. Thole and G. A. Sawatzky, Phys. Rev B 42, 5459 (1990).