Probing the extended non-Fermi liquid regimes of MnSi and Fe
Abstract
Recent studies show that the non-Fermi liquid (NFL) behavior of MnSi and Fe spans over an unexpectedly broad pressure range, between the critical pressure and around . In order to determine the extension of their NFL regions, we analyze the evolution of the resistivity at higher pressures. We find that in MnSi the exponent holds below , but it increases above that pressure. At GPa we observe the low temperature Fermi liquid exponent whereas for K, . Our measurements in Fe show that the NFL behavior extends at least up to GPa, above the entire superconducting (SC) region. In the studied pressure range, the onset of the SC transition reduces by a factor down to K, while the coefficient diminishes monotonically by around %.
keywords:
non-Fermi liquids , unconventional superconductivity , ferromagnetism , Fe , MnSiPACS:
71.10.Hf; 71.27+a; 74.70.Ad; 75.50.BbAnomalous dependencies of thermodynamic and transport properties are observed in the pressure studies of many metals close to magnetic instabilities. This non-Fermi liquid (NFL) behavior is usually detected in a narrow region of the phase diagram, around a critical pressure, , where the magnetic ordering temperature . However, a recent report [1] shows that in the weak helimagnet MnSi the electrical resistivity follows for pressures between GPa and around , at least down to K. This contrasts with the expected in a nearly ferromagnetic metal (NFM): a low temperature and above a characteristic .
Elemental iron displays, in its non-magnetic phase, non-Fermi liquid behavior with striking characteristics.[2] The NFL region emerges close to a strong first order magnetic transition, followed by a structural one,[3] and extends between GPa and almost .[2] Furthermore, in this pressure window Fe is an unconventional superconductor (SC) with an onset at K and the resistivity suggests the effect of ferromagnetic (FM) spin fluctuations instead of the predicted antiferromagnetic ones.[2]
We have extended previous works by measuring four-probe electrical resistivity of single crystalline MnSi and a Fe-whisker to higher pressures. The clamped Bridgman anvil cell technique was employed up to GPa and GPa for MnSi and Fe, respectively, using steatite as pressure transmitting medium.
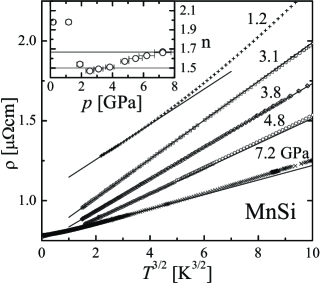
In the case of MnSi, our main goal was to determine the maximum pressure up to which the abnormal exponent holds. Low temperature resistivity data is presented in Fig. 1 in a vs. representation. In addition, the inset of this figure depicts the evolution of as obtained from fitting our data to between and K. For GPa, well below , the resistivity follows . Indeed, at GPa, the resistivity data deviates upward from a straight line, suggesting a exponent. Such a deviation is not present in the data for pressures between and GPa, indicating that holds in this temperature range for . Above , increases smoothly towards , see the figure inset. Resistivity measurements performed down to mK suggest that at GPa the conventional picture for a NFM is recovered: we find for K and the quoted up to K, with an estimated K. The coefficient we observe for the behavior at GPa is within % of the value at GPa, the lowest measured pressure.
In Fig. 2 we plot of Fe as a function of . Between GPa and GPa, the normal state resistivity follows in a broad temperature range, as previously observed at lower pressures.[2] The data departs from this simple dependence above K, compare in Fig. 2 the dot-line with the data for GPa. We ascribe this departure to the extra contribution due to electron-phonon scattering, included in the solid-lines fits thru the data. If we restrict the fitting-range to low temperatures, between and K, we find an exponent that scatters around up to GPa and then diminishes down to at GPa.
The coefficient of Fe follows the remarkable evolution depicted in the inset of Fig. 2: it increases abruptly at and tracks above that pressure.[2] Our data extends the correlation between and almost up to GPa, where . However, for we observe a reduction of in a factor , down to K, while decreases by only %. Within the SC scenario proposed for Fe,[2] the strong suppression of could be related to a collapse of the pairing mechanism, indicating a threshold value of for the observation of SC. A further possibility is that a reduction in , and thus in , would imply a growing coherence length . Considering that the mean free path is not changing much, as increases it is not possible to satisfy the clean-limit condition for SC in Fe, .

The change of the magnetic state in MnSi is also reflected in the evolution of , which has a strong increase when . This effect is attributed to stronger fluctuations in the magnetization.[4] As increases above , diminishes smoothly, see the slope of the full lines in Fig. 1. Although it is far from being proved, the smooth evolution of suggests that no phase-transition-line is crossed when the exponent evolves from to .
In this work we present further evidence for an extended NFL region in MnSi and Fe. In the case of MnSi, we show that the abnormal exponent holds up to , but a “conventional” NFM is recovered at GPa. The relevant question concerning this material is how evolves; higher pressure experiments or measurements with increased sensitivity could partially answer this. The case of Fe is similar to that of MnSi in the sense that it is an extended NFL with striking characteristics. We have also pointed out that SC is suppressed at around GPa despite the strong electronic correlation measured by . In this case, an open question is the influence that the first-order magnetic/structural transition may have for . Further pressure experiments on other FM, in especial on pure systems like the ones studied here, may give important clues about relevant scenarios.
References
- [1] N. Doiron-Leyraud et al., Nature 425 (2003) 595.
- [2] A. T. Holmes et al., J. Phys.: Condens. Matter 16 (2004) S1121; D. Jaccard and A. T. Holmes, Physica B 359-361 (2005) 333.
- [3] O. Mathon et al., Phys. Rev. Lett. 93 (2004) 255503.
- [4] C. Thessieu, Ph.D. Thesis, University of Paris IV (1995).