Transition pressures and enthalpy barriers for the cd-tin transition in Si and Ge under non-hydrostatic conditions
Abstract
We present an ab-initio study of the phase transition cd-tin in Si and Ge under hydrostatic and non-hydrostatic pressure. For this purpose we have developed a new method to calculate the influence of non-hydrostatic pressure components not only on the transition pressure but also on the enthalpy barriers between the phases. We find good agreement with available experimental and other theoretical data. The calculations have been performed using the plane-wave pseudopotential approach to the density-functional theory within the local-density and the generalized-gradient approximation implemented in VASP.
pacs:
64.70.Kb 71.15.Nc 81.40.VwI Introduction
The phase transitions in silicon (Si) and germanium (Ge) from the cd phase (cubic-diamond structure) to the -tin phase (body-centered tetragonal structure, bct) are two of the most studied solid-solid phase transitions in condensed matter physics, both, experimentallyMcMahon and Nelmes (1993) McMahon et al. (1994) Hu et al. (1986) Voronin et al. (2003) Zhao et al. (1986) Olijnyk et al. (1984) Werner et al. (1982) Menoni et al. (1986) Yoshiasa et al. (1997) Spain et al. (1984) Cicco et al. (2003) Wentorf and Kasper (1963) Jamieson (1963) Asaumi and Minomura (1978) Dyuzheva et al. (1978) Gupta and Ruoff (1980) Baublitz and Ruoff (1982) Menoni et al. (1983) Quadri et al. (1983) Hu and Spain (1984) Tonkov (1992) Hebbache and Zemzemi (2003) Vohra et al. (1986) and theoretically Yin and Cohen (1980a) Yin and Cohen (1980b) Yin and Cohen (1982a) Yin and Cohen (1982b) Needs and Martin (1984) Biswas et al. (1984) Chang and Cohen (1984) Chang and Cohen (1986) Vohra et al. (1986) Biswas et al. (1987) Methfessel et al. (1989) Boyer et al. (1991) Mizushima et al. (1994) Needs and Mujica (1995) Moll et al. (1995) DalCorso et al. (1996) Pfrommer et al. (1997) Lee and Martin (1997) Christensen et al. (1999) Gaál-Nagy et al. (1999) Ackland (2001) Hebbache et al. (2001) Gaál-Nagy et al. (2001) Mujica et al. (2003) Gaál-Nagy et al. (2004a) Gaál-Nagy et al. (2004b) Kaczmarski et al. (2005). In the experiment, the phase transition in Si occurs at around 110 kbar and in Ge at around 105 kbar, where also lower values of the transition pressure are obtained. These lower values are often considered as caused by non-hydrostatic conditions, which are able to reduce the transition pressure.Jamieson (1963)
In fact, the pressure in the anvil cell is not exactly hydrostatic. Usually at pressures up to 100 kbar the pressure-transmitting medium yields nearly hydrostatic conditions.Piermarini et al. (1973) Above 150 kbar a non-hydrostatic pressure profile is visible, and at very high pressures the pressure-transmitting medium becomes solid which causes a strong non-hydrostatic effect. Even in the hydrostatic pressure regime there is a small pressure gradient.Barnett et al. (1973) Non-hydrostatic pressure profiles can also be an effect of the geometry of the cell.Brister et al. (1988) Because of relaxation phenomena which happen in the pressure-transmitting medium the time for compressing and decompressing has an influence on the measurement.
In theoretical investigations generally hydrostatic conditions are assumed. Within calculations using the local-density approximation (LDA) the calculated transition pressures vary between 70 and 99 kbar for Si and between 73 and 98 kbar for Ge. Usually the transition pressure is strongly underestimated by LDA calculations whereas calculations using generalized-gradient approximation (GGA) match the experimental value better (102–164 kbar for Si and 96–118 kbar for Ge). In any case, the discrepancy between experimental and theoretical results can also be due to non-hydrostatic pressure conditions in the experiment. Ab-initio calculations considering non-hydrostatic pressure are rareCheng et al. (2001); Cheng (2003) and deal just with the transition pressure. The influence of non-hydrostatic conditions on the enthalpy barrier between the two phases is not studied within an ab-initio calculation until now. Therefore, we developed a new method to calculate the transition pressure as well as the enthalpy barriers also for non-hydrostatic conditions. In a first step, we obtain the transition pressure and the enthalpy barrier between both phases as a function of pressure starting from a complete numerical equation of state for hydrostatic conditions. Here a complete equation of state means a continuous, multivalued function where is the volume and the pressure, similar to the one of the common textbook example of the van der Waals gas. In a second step, this procedure is extended to non-hydrostatic conditions.
This contribution is organized as follows: Firstly, a short introduction into the theoretical background of the calculations and the properties of the unit cell used for our calculations is given (Section II). Then we explain the procedure of calculating a complete equation of state from a given energy surface (Section III). Following this, we present results for the influence of non-hydrostatic pressure components on the transition pressure and on the height of the enthalpy barrier (Section IV). Finally, after a discussion of the results and comparison with available theoretical data (Section V) we describe possible extensions of our procedure and summarize (Section VI).
II Method
We have carried out calculations with the Vienna ab-initio simulation package (VASP).Kresse and Hafner (1993); Kresse and Furthmüller (1996a); Kresse (1993); Kresse and Furthmüller (1996b) It is based one a plane-wave pseudopotential approach to the density-functional theory (DFT).Hohenberg and Kohn (1964); Kohn and Sham (1965) We have used ultrasoft Vanderbilt-type pseudopotentials Vanderbilt (1990) as supplied by Kresse and Hafner Kresse and Hafner (1994). The exchange-correlation potential has been calculated within the GGA due to Perdew and WangPerdew et al. (1992) for Si and Ge and the LDAPerdew and Zunger (1981); Ceperley and Alder (1980) for Si only. The forces on the atoms are derived from a generalized form Goedecker and Maschke (1992); Kresse (1993) of the Hellmann-Feynman theorem Feynman (1939) including Pulay forces.Pulay (1969) For the ultrasoft pseudopotentials a kinetic-energy cutoff of 270 eV (410 eV) for Si (Ge) has been sufficient for convergence of the total energy and provides an error smaller than 0.5 kbar (0.2 kbar) for Si (Ge) to the pressure according to the Pulay stress.Pulay (1969) The special-point summation required a 181818 (242424) mesh of Monkhorst-Pack pointsMonkhorst and Pack (1976) which amounts to 864 (1962) k-points in the irreducible wedge of the Brillouin zone for Si (Ge). Since the -tin phase is metallic we have used a Methfessel-Paxton smearingMethfessel and Paxton (1989) with a width of 0.2 eV, including the cd phase, since it is not a priori clear whether a given set of volume and ratio of lattice constants yields a metallic or a semiconducting phase.
In order to minimize an energy offset between the structures it is important to describe the structures of both phases within the same bct cell (lattice constants ) with two atoms in the basis at and . The symmetry of the cd phase requires , whereas can vary for the -tin phase. Using the bct cell the structure of the cd phase with respect to the conventional face-centered cubic cell is rotated by around the -axis. In the following, CD and BCT denote the structure of the cd- and the -tin phase using the bct cell.
III Complete equation of state under hydrostatic conditions
Neglecting temperature and zero-point motion effects, the phase with the lowest enthalpy is stable. Therefore, the transition pressure for a first-order pressure-induced phase transition from the cd phase to the -tin phase can be determined from the crossing of the corresponding enthalpy curves and with . First-order phase transitions are accompanied by a discontinuity in the volume and an overcoming of an enthalpy barrier which is located between the phases and which has a height of .
Under hydrostatic conditions the pressure is defined as . It can also be determined from the stress tensor .Nye (1969); Chaikin and Lubensky (1995) Since the structures here are orthogonal, the off-diagonal components of vanish, and has the form
| (7) |
We are using a tetragonal cell, and thus . Under hydrostatic conditions all three components are equal and correspond to the external pressure ,
| (8) |
Under non-hydrostatic conditions the average pressure is defined as
| (9) |
which is again equal to the external pressure in the case of hydrostatic conditions.
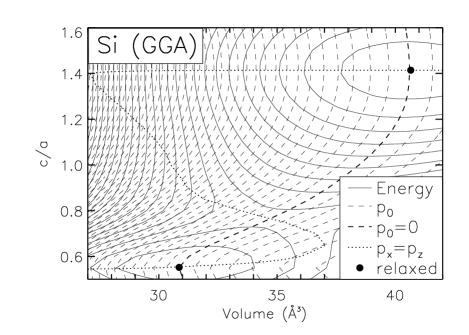
We have calculated the total energy as a function of and . The corresponding energy surface is shown in Fig. 1 for Si using the GGA (similar results are obtained for Ge within GGA and for Si within LDA). The two local energy minima, according to the two phases, with a saddle in between are visible. The pressure is obtained from Eq. (7) and Eq. (9) and is included in the figure. Except along the (dotted) hydrostatic line with the pressure is non-hydrostatic. The local minima are at the crossing of the and the hydrostatic lines which defines the equilibrium position. A similar graph can be drawn also for the enthalpy.Gaál-Nagy et al. (2004b)
Along the hydrostatic line the structures are in a local equilibrium, meaning the total sum of internal and external forces caused by the pressure is zero. Hence, this condition can be used to extract the total energy , the external pressure , and the volume from Fig. 1 in order to derive a full equation of state . Also and, furthermore, the values along the line across the saddle are accessible. These curves are shown in Fig. 2. Here, the ideal cd structure () has been reached only within an error of 1% for the lattice parameters. In order to discriminate the enthalpy curves against each other we have reduced them by a linear background. The local stability is in accordance with the fact that the curves are monotonically decreasing and the -curves are convex. This is in contrast to the the textbook example, the van der Waals gas, where the line corresponding to the dotted line of is concave and signals local instability.

The transition pressure obtained from the crossing of the enthalpy curves are listed in Table 1. The corresponding change in the volume at the phase transition can be read from the upper panel of Fig. 2 as the difference between (solid line) and (dashed line). Analogously the enthalpy barrier can be determined from the figures. In order to check the reliability of this method we compare the results with our previous ones Gaál-Nagy et al. (2004b) based on the same total-energy calculations but obtained with a different method to evaluate the transitions pressures and enthalpy barriers. The agreement is very good, and the small differences are due to numerical errors. Thus, we can trust in the new method developed here.
| Ge-GGA | Si-GGA | Si-LDA | |
|---|---|---|---|
| (kbar) | 96 (96) | 122 (121) | 80 (79) |
| (Å3) | 7.5 (7.5) | 8.3 (8.3) | 8.5 (8.5) |
| (meV) | 421 (423) | 510 (515) | 502 (508) |
Since we have determined a complete equation of state, we can calculate also the enthalpy barrier as a function of pressure. We have to distinguish between the barrier for the cd-tin transition, approaching from the cd phase, and the one for the -tincd transition, approaching from the -tin phase. In general, the enthalpy barrier has its origin in the energy saddle between the two phases and can be calculated as the difference of the reduced enthalpy of the phases (solid and dashed lines, respectively) and the one from the saddle (dotted line), see Fig. 2. In particular, the enthalpy barrier from the cd phase is the difference between the solid and the dotted line, and the one from the -tin phase is the difference between the dashed and the dotted line. At the transition pressure the enthalpy barriers from both phases have the same height. The determination of the enthalpy barrier as a function of pressure is important to estimate the barrier in the case of over- and underpressurizing the medium. Hence, the phase transitions will happen at a pressure different from which results in a different height of the barrier. As expected, the enthalpy barrier from the cd phase is decreasing with increasing pressure whereas the one from the -tin phase decreases with decreasing pressure. At zero pressure there is still an enthalpy barrier left for the -tincd transition. This points at the fact that there is no spontaneous transition -tincd. In the experiment the phase transition cd-tin is irreversible.
IV Phase transition under non-hydrostatic conditions
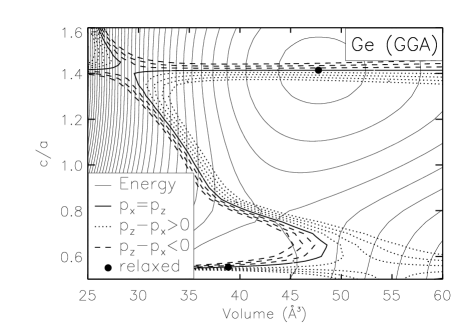
The procedure for determining transition pressures and enthalpy barriers described in the previous section can be extended to the case of non-hydrostatic pressure. Besides the hydrostatic condition the values for non-hydrostatic pressure components (with a fixed value of ) can be extracted from the energy surface along the corresponding lines of Fig. 3. A first naive trial considering just the total energy under non-hydrostatic conditions and the corresponding values for the average pressure and for the volume gives wrong results, e.g., an increase of the transition pressure for and . This is in contrast to the experimental observations. Thus is is necessary to include strain effects.
Similar to the stress tensor of Eq. (7) the strain tensor can be reduced to a diagonal form for orthogonal systemsNye (1969); Landau and Lifshitz (1970); Chaikin and Lubensky (1995)
| (16) |
where , , and are along the cartesian crystal axes. For small stress and homogeneous strain the components of can be derived asLandau and Lifshitz (1970); Nye (1969)
| (17) |
where is the lattice parameter in the -direction. Here corresponds to the unstrained and to the strained crystal. Including stress and strain the enthalpy can be written asLandau and Lifshitz (1970)
| (18) |
where is the enthalpy and the total energy per volume. The calculation of the enthalpy at non-hydrostatic stress is based on Eq. (18). The numerical realization is described in Appendix A.
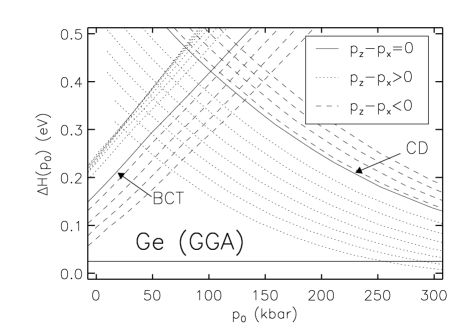
It turns out that the strain-only contribution to the enthalpy vanishes for the cd phase, that it is linear with the pressure for the -tin phase, and that it is non-linear for the contribution along the line across the saddle. This effect is apparent in Fig. 4, where the enthalpy including strain is presented. Since there is no strain effect on the cd phase, the change of the transition pressure is due to the strained -tin phase. From Fig. 4 we can find the transition pressures for fixed non-hydrostatic conditions in the same manner as mentioned in the previous section.


In addition to the average transition pressure also their components and in the and directions are shown as well as the enthalpy barrier at the phase transition as a function of in Fig. 5. For the transition pressure one has the relation . The boundary for the lowest pressure is fixed by the condition that the components of are not negative, since we exclude a stretching of the crystal. We find a strong lowering of the transition pressure if the pressure in the direction is larger than in the and directions. Thus, the crystal is more stable against compression along the - and -axes in the case of a strong non-hydrostatic component in these directions which cause an increase of the transition pressure. The corresponding enthalpy barriers are lowering in any case, but their value remains still larger than the thermal energy at room temperature (RT).
Besides the non-hydrostatic effects we can consider finally also the case of over- and under-pressurization of the crystal. To this end calculations of the enthalpy barriers as a function of the average pressure and non-hydrostatic conditions have been carried out. At very high pressures and very large non-hydrostatic components the enthalpy barrier for the cd-tin transition is smaller than the thermal energy at RT, but these conditions do not appear by chance in the experiment; instead, they have to be applied by intention. In contrast, the enthalpy barrier is never smaller than 25 meV for the -tincd transition even at the largest non-hydrostatic components with , , and not negative (no stretching).
V Discussion of the results
In the past, non-hydrostatic conditions have been investigated for different reasons.Lee et al. (1997); Cheng et al. (2001); Cheng (2003); Wang et al. (1993, 1995); Libotte and Gaspard (2000) Directly comparable with our results are just the ones from Lee et al. Lee et al. (1997) and Cheng et al. Cheng et al. (2001); Cheng (2003) Besides the transition pressures also the function is given in these contributions. This function can be obtained from our results by a linear fit of the values for the transition pressure in Fig. 5. Already Lee et al. Lee et al. (1997) found a linear relation of and . In their molecular-dynamics investigation they found kbar for hydrostatic conditions and kbar. The additive constant corresponds to the lowest possible transition pressure. On the contrary, Cheng et al. Cheng et al. (2001); Cheng (2003) obtained kbar and kbar for Ge, and kbar and kbar for Si. Although the last values have been obtained also with VASP using GGA, the results for the transition pressure are slightly different from our results (95.9 kbar for Ge(GGA), 122.1 kbar for Si(GGA), and 79.6 kbar for Si(LDA)). This can be due to the fact that they have used different cells for the phases and also different pseudopotentials and convergence parameters. The choice of different unit cells can lead to an energy offset between the energy curves to which the transition pressure is very sensitive. Nevertheless, our results for the linear functions which are kbar for Ge(GGA), kbar for Si(GGA), and kbar for Si(LDA), respectively, agree very well with the ones of Refs. Cheng et al., 2001 and Cheng, 2003. The difference of the additive constants rely on the different values of the transition pressures in the hydrostatic case. Since Cheng et al. Cheng et al. (2001); Cheng (2003) restricted themselves to the enthalpy difference between the phases using path integrals, the enthalpy barrier was not accessible to them.
The experimental values for the transition pressures vary between 103 and 133 kbar for SiMcMahon and Nelmes (1993); McMahon et al. (1994); Hu et al. (1986); Olijnyk et al. (1984); Werner et al. (1982); Zhao et al. (1986); Voronin et al. (2003) and between 103 and 110 kbar for GeOlijnyk et al. (1984); Menoni et al. (1986); Yoshiasa et al. (1997); Werner et al. (1982); Spain et al. (1984); Zhao et al. (1986); Cicco et al. (2003) where the firmed values are at around 110 kbar and 105 kbar, respectively. In both cases, our results obtained with GGA agree perfectly, whereas the LDA result underestimates the experimental value, which is a well known problem.
The good agreement of our results with the ones of Cheng et al. Cheng et al. (2001); Cheng (2003) confirm the reliability of our method, which provides a larger field of applications. In addition, our method can be extended to, e.g., the -tinImmash transitions in Si and Ge. After the extraction of a two-dimensional energy surface from a three-dimensional one using the values along the lines where two components of the stress tensor are equal (like in our previous workGaál-Nagy et al. (2004b); Gaál-Nagy (2004)), the method mentioned here can be applied to this extracted surface. By the choice of two equal components the main pressure direction is chosen. Further extensions even to non-orthorhombic structures are possible, too.
VI Summary
We have developed a new method for investigating first-order high-pressure phase transitions which is based on the calculation of a complete equation of state. Besides the transition pressure and the volume change, which are also available with the common-tangent construction, the enthalpy barrier between the phases can be obtained with our method. A comparison with results for Si and Ge from common methods shows the reliability of the new method. Further on, the enthalpy barrier can be determined as a function of the external pressure which makes effects from over- and underpressurizing accessible. An extension of this method allows us also to investigate high-pressure phase transitions under non-hydrostatic conditions, in particular the transition pressure and the enthalpy barrier, which are both decreasing if the pressure component along the -axis is larger than the other ones. Our results show an excellent agreement with available experimental and theoretical data. This new method can be extended also to other phase transitions and also to ones including orthorhombic structures, for example, the transitions -tinImmash. Thus, we have developed a powerful tool for investigating phase transitions under hydrostatic and non-hydrostatic conditions.
Acknowledgment
Support by the Heinrich Böll Stiftung, Germany, is gratefully acknowledged. This work was funded in part by the EU’s 6th Framework Programme through the NANOQUANTA Network of Excellence (NMP4-CT-2004-500198).
Appendix A Calculation of the enthalpy including stress
Here we give a short description of the formulae used for the
calculation of the enthalpy including stress and strain effects
starting from Eq. (18).
which is equivalent to in the case of
hydrostatic conditions. Since Eq. (17) holds just for
small stress, we need to integrate this equation and cannot go
directly to the absolute values. The integration is performed using
the recursively defined equation
where are the lattice constants along the three cartesian
directions and , and the difference from the previous step
is calculated along a line for fixed
non-hydrostatic conditions (see Fig. 3) starting
from the equilibrium structure of the cd phase. is here
the total energy along a line . The enthalpy under
non-hydrostatic conditions corresponds to the calculated points
. By symmetrizing this equation numerical errors have been
reduced.
References
- McMahon and Nelmes (1993) M. I. McMahon and R. J. Nelmes, Phys. Rev. B 47, R8337 (1993).
- McMahon et al. (1994) M. I. McMahon, R. J. Nelmes, N. G. Wright, and D. R. Allan, Phys. Rev. B 50, 739 (1994).
- Hu et al. (1986) J. Z. Hu, L. D. Merkle, C. S. Menoni, and I. L. Spain, Phys. Rev. B 34, 4679 (1986).
- Voronin et al. (2003) G. A. Voronin, C. Pantea, T. W. Zerda, L. Wang, and Y. Zhao, Phys. Rev. B 68, 020102(R) (2003).
- Zhao et al. (1986) Y.-X. Zhao, F. Buehler, J. R. Sites, and I. L. Spain, Solid State Commun. 59, 679 (1986).
- Olijnyk et al. (1984) H. Olijnyk, S. K. Sikka, and W. B. Holzapfel, Phys. Lett. 103 A, 137 (1984).
- Werner et al. (1982) A. Werner, J. A. Sanjurjo, and M. Cardona, Solid State Commun. 44, 155 (1982).
- Menoni et al. (1986) C. S. Menoni, J. Z. Hu, and I. L. Spain, Phys. Rev. B 34, 362 (1986).
- Yoshiasa et al. (1997) A. Yoshiasa, K. Koto, H. Maeda, , and T. Ishii, Jpn. J. Appl. Phys. 36, 781 (1997).
- Spain et al. (1984) I. L. Spain, J. Z. Hu, C. S. Menoni, and D. Black, J. Phys. (Paris) 45, Suppl. Colloq. C8, C8 (1984).
- Cicco et al. (2003) A. D. Cicco, A. C. Frasini, M. Minicucci, E. Principi, J.-P. Itié, and P. Munsch, Phys. Stat. Sol. (b) 240, 19 (2003).
- Wentorf and Kasper (1963) R. H. Wentorf and J. S. Kasper, Science 139, 338 (1963).
- Jamieson (1963) J. C. Jamieson, Science 139, 762 (1963).
- Asaumi and Minomura (1978) K. Asaumi and S. Minomura, J. Phys. Soc. Jpn. 45, 1061 (1978).
- Dyuzheva et al. (1978) T. I. Dyuzheva, S. S. Kabalkina, and V. P. Novichkov, Sov. Phys. JETP 47, 931 (1978).
- Gupta and Ruoff (1980) M. C. Gupta and A. L. Ruoff, J. Appl. Phys. 51, 1072 (1980).
- Baublitz and Ruoff (1982) M. A. Baublitz and A. L. Ruoff, J. Appl. Phys. 53, 5669 (1982).
- Menoni et al. (1983) C. S. Menoni, J. Z. Hu, and I. L. Spain, in High Pressure in Science and Technology, edited by C. Homan, R. K. MacCrone, and E. Walley (North Holland, Amsterdam, 1983).
- Quadri et al. (1983) S. B. Quadri, E. F. Skelton, and A. W. Webb, J. Appl. Phys. 54, 3609 (1983).
- Hu and Spain (1984) J. Z. Hu and I. L. Spain, Solid State Commun. 51, 263 (1984).
- Tonkov (1992) E. Y. Tonkov, High Pressure Phase Transformations, vol. 2 (Gordon and Breach Science Publishers, Philadelphia, 1992).
- Hebbache and Zemzemi (2003) M. Hebbache and M. Zemzemi, Phys. Rev. B 67, 233302 (2003).
- Vohra et al. (1986) Y. K. Vohra, K. E. Brister, S. Desgreniers, A. L. Ruoff, K. J. Chang, and M. L. Cohen, Phys. Rev. Lett. 56, 1944 (1986).
- Yin and Cohen (1980a) M. T. Yin and M. L. Cohen, Phys. Rev. Lett. 45, 1004 (1980a).
- Yin and Cohen (1980b) M. T. Yin and M. L. Cohen, Solid State Commun. 38, 625 (1980b).
- Yin and Cohen (1982a) M. T. Yin and M. L. Cohen, Phys. Rev. B 26, 5668 (1982a).
- Yin and Cohen (1982b) M. T. Yin and M. L. Cohen, Phys. Rev. B 26, 3259 (1982b).
- Needs and Martin (1984) R. J. Needs and R. M. Martin, Phys. Rev. B 30, R5390 (1984).
- Chang and Cohen (1984) K. J. Chang and M. L. Cohen, Phys. Rev. B 30, R5376 (1984).
- Chang and Cohen (1986) K. J. Chang and M. L. Cohen, Phys. Rev. B 34, 8581 (1986).
- Methfessel et al. (1989) M. Methfessel, C. O. Rodriguez, and O. K. Andersen, Phys. Rev. B 40, R2009 (1989).
- Boyer et al. (1991) L. L. Boyer, E. Kaxiras, J. L. Feldman, J. Q. Broughton, and M. J. Mehl, Phys. Rev. Lett. 67, 715 (1991).
- Mizushima et al. (1994) K. Mizushima, S. Yip, and E. Kaxiras, Phys. Rev. B 50, 14952 (1994).
- Needs and Mujica (1995) R. J. Needs and A. Mujica, Phys. Rev. B 51, 9652 (1995).
- Moll et al. (1995) N. Moll, M. Bockstedte, M. Fuchs, E. Pehlke, and M. Scheffler, Phys. Rev. B 52, 2550 (1995).
- DalCorso et al. (1996) A. DalCorso, A. Pasquarello, A. Baldereschi, and R. Car, Phys. Rev. B 53, 1180 (1996).
- Pfrommer et al. (1997) B. G. Pfrommer, M. Côté, S. G. Louie, and M. L. Cohen, Phys. Rev. B 56, 6662 (1997).
- Lee and Martin (1997) I.-H. Lee and R. M. Martin, Phys. Rev. B 56, 7197 (1997).
- Christensen et al. (1999) N. E. Christensen, D. L. Novikov, R. E. Alonso, and C. O. Rodriguez, Phys. Stat. Sol. (b) 211, 5 (1999).
- Gaál-Nagy et al. (1999) K. Gaál-Nagy, A. Bauer, M. Schmitt, K. Karch, P. Pavone, and D. Strauch, Phys. Stat. Sol. (b) 211, 275 (1999).
- Ackland (2001) G. J. Ackland, Rep. Prog. Phys. 64, 483 (2001).
- Hebbache et al. (2001) M. Hebbache, M. Mattesini, and J. Szeftel, Phys. Rev. B 63, 205201 (2001).
- Gaál-Nagy et al. (2001) K. Gaál-Nagy, M. Schmitt, P. Pavone, and D. Strauch, Comp. Mat. Sci. 22, 49 (2001).
- Mujica et al. (2003) A. Mujica, A. Rubio, A. Muos, and R. J. Needs, Rev. Mod. Phys. 75, 863 (2003).
- Gaál-Nagy et al. (2004a) K. Gaál-Nagy, A. Bauer, P. Pavone, and D. Strauch, Comp. Mat. Sci. 30, 1 (2004a).
- Gaál-Nagy et al. (2004b) K. Gaál-Nagy, P. Pavone, and D. Strauch, Phys. Rev. B 69, 134112 (2004b).
- Kaczmarski et al. (2005) M. Kaczmarski, O. N. Bedoya-Martínez, and E. R. Hernández, Phys. Rev. Lett. 94, 095701 (2005).
- Biswas et al. (1984) R. Biswas, R. M. Martin, R. J. Needs, and O. H. Nielsen, Phys. Rev. B 30, 3210 (1984).
- Biswas et al. (1987) R. Biswas, R. M. Martin, R. J. Needs, and O. H. Nielsen, Phys. Rev. B 35, 9559 (1987).
- Piermarini et al. (1973) G. J. Piermarini, S. Block, and J. S. Barnett, J. Appl. Phys. 44, 5377 (1973).
- Barnett et al. (1973) J. S. Barnett, S. Block, and G. J. Piermarini, Rev. Sci. Instrum. 44, 1 (1973).
- Brister et al. (1988) K. E. Brister, Y. K. Vohra, and A. L. Ruoff, Rev. Sci. Instrum. 59, 318 (1988).
- Cheng et al. (2001) C. Cheng, W. H. Huang, and H. J. Li, Phys. Rev. B 63, 153202 (2001).
- Cheng (2003) C. Cheng, Phys. Rev. B 67, 134109 (2003).
- Kresse and Hafner (1993) G. Kresse and J. Hafner, Phys. Rev. B 47, R558 (1993).
- Kresse and Furthmüller (1996a) G. Kresse and J. Furthmüller, Phys. Rev. B 54, 11169 (1996a).
- Kresse (1993) G. Kresse, Ph.D. thesis, Technische Universität Wien, unpublished (1993).
- Kresse and Furthmüller (1996b) G. Kresse and J. Furthmüller, Comp. Mat. Sci. 6, 15 (1996b).
- Hohenberg and Kohn (1964) P. Hohenberg and W. Kohn, Phys. Rev. 136 B, 864 (1964).
- Kohn and Sham (1965) W. Kohn and L. J. Sham, Phys. Rev. 140 A, 1133 (1965).
- Vanderbilt (1990) D. Vanderbilt, Phys. Rev. B 41, R7892 (1990).
- Kresse and Hafner (1994) G. Kresse and J. Hafner, J. Phys. Cond. Matter 6, 8245 (1994).
- Perdew et al. (1992) J. P. Perdew, J. A. Chevary, S. H. Vosko, K. A. Jackson, M. R. Pederson, D. J. Singh, and C. Fiolhais, Phys. Rev. B 46, 6671 (1992).
- Perdew and Zunger (1981) J. P. Perdew and A. Zunger, Phys. Rev. B 23, 5048 (1981).
- Ceperley and Alder (1980) D. M. Ceperley and B. J. Alder, Phys. Rev. Lett. 45, 566 (1980).
- Goedecker and Maschke (1992) S. Goedecker and K. Maschke, Phys. Rev. B 45, 1597 (1992).
- Feynman (1939) R. P. Feynman, Phys. Rev. 56, 340 (1939).
- Pulay (1969) P. Pulay, Mol. Phys. 17, 197 (1969).
- Monkhorst and Pack (1976) H. J. Monkhorst and J. D. Pack, Phys. Rev. B 13, 5188 (1976).
- Methfessel and Paxton (1989) M. Methfessel and A. T. Paxton, Phys. Rev. B 40, 3616 (1989).
- Nye (1969) J. F. Nye, Physical Properties of Crystals (Oxford University Press, London, 1969).
- Chaikin and Lubensky (1995) P. M. Chaikin and T. C. Lubensky, Principles of condensed matter physics (Cambridge University Press, Cambridge, 1995).
- Landau and Lifshitz (1970) L. D. Landau and E. M. Lifshitz, Theory of elasticity, vol. VII (Pergamon Press, Oxford, 1970).
- Lee et al. (1997) I.-H. Lee, J.-W. Jeong, and K. J. Chang, Phys. Rev. B 55, 5689 (1997).
- Wang et al. (1993) J. Wang, S. Yip, S. R. Phillpot, and D. Wolf, Phys. Rev. Lett 71, 4182 (1993).
- Wang et al. (1995) J. Wang, J. Li, S. Yip, S. Phillpot, and D. Wolf, Phys. Rev. B 52, 12627 (1995).
- Libotte and Gaspard (2000) H. Libotte and J.-P. Gaspard, Phys. Rev. B 62, 7110 (2000).
- Gaál-Nagy (2004) K. Gaál-Nagy, Ph.D. thesis, Universität Regensburg, http://www.opus-bayern.de/uni-regensburg/volltexte/2004/400 (2004).