Detrended fluctuation analysis on the correlations of complex networks
under attack and repair strategy
Abstract
We analyze the correlation properties of the Erdös-Rényi random graph (RG) and the Barabási-Albert scale-free network (SF) under the attack and repair strategy with detrended fluctuation analysis (DFA). The maximum degree , representing the local property of the system, shows similar scaling behaviors for random graphs and scale-free networks. The fluctuations are quite random at short time scales but display strong anticorrelation at longer time scales under the same system size and different repair probability . The average degree , revealing the statistical property of the system, exhibits completely different scaling behaviors for random graphs and scale-free networks. Random graphs display long-range power-law correlations. Scale-free networks are uncorrelated at short time scales; while anticorrelated at longer time scales and the anticorrelation becoming stronger with the increase of .
pacs:
05.40.-a, 05.45.Tp, 89.75.-kI Introduction
Complex networks are an essential part of modern society. Many social, biological, transportation and communication systems can be cast into the form of complex networks, a set of nodes joined together by links indicating interactions. s1 ; s2 ; s3 ; s4 Recently enormous interest has been devoted to the study of complex networks. Among various existing models of complex networks, two different model topologies, the Erdös-Rényi model s5 of the random graph (RG) and the Barabási-Albert model s6 of the scale-free network (SF), have been widely studied. s7 ; s8 ; s9
The random graph is constructed starting from an initial condition of nodes and no edges. Then edges are added between pairs of randomly selected nodes with connection probability . The number of edges connected to any particular node is called the degree of that node. The average degree of the random graph is . The scale-free network puts the emphasis on the network dynamics and is constructed with the algorithm of growth and preferential attachment. According to the scale-free model, the network grows over time by the addition of new nodes and links. A node newly added to the network randomly selects other nodes to establish new links, with a selection probability that increases with the number of links of the selected node. One of the most relevant is given by power-law degree distribution , defined as the probability that a randomly chosen node has degree , .
Recently the security of complex networks to the random failures or intentional attacks has attracted a great deal of attention. s10 ; s11 ; s12 ; s13 ; s14 ; s15 The random failure is simulated as the deletion of network nodes or links chosen at random, while intentional attack as the targeted removal of a specific class of nodes or links. In order to protect existing networks and design robust networks, we introduced the attack and repair strategy in Ref. [16], which will be described briefly in the following section. In this paper, we will study the correlations for random graphs and scale-free networks under the attack and repair strategy with the detrended fluctuation analysis (DFA) s17 ; s18 and investigate the intrinsic dynamics in both networks. The advantages of DFA over many methods are that it permits the detection of long-range correlations embedded in seemingly nonstationary time series, and also avoids the spurious detection of apparent long-range correlations that are an artifact of nonstationary. s19 ; s20 ; s21 ; s22
The paper is organized as follows. In Section II we review the algorithm of the DFA method. In Section III, we apply the DFA method to investigate the correlations of the maximum degree and the average degree for random graphs and scale-free networks. In last section we present our brief conclusions.
II DFA
Detrended fluctuation analysis (DFA) is a well-established method for determining the scaling behavior of noisy data in the presence of trends without knowing their origin and shape. Briefly, the DFA method involves the following steps.
-
(1)
We consider a noisy time series () and is the length of the series. We integrate the time series and subtract the mean ,
(1) where
(2) -
(2)
We divide the integrated signal into non-overlapping boxes of equal size (scale of analysis).
-
(3)
In each box of size , we fit the integrated time series by using a polynomial function, , which is called the local trend. For order- DFA (DFA-1 if , DFA-2 if etc.), -order polynomial function is applied for the fitting.
-
(4)
We detrend the integrated time series by subtracting the local trend in each box, and we calculate the detrended fluctuation function
(3) -
(5)
For a given box size , we calculate the root-mean-square (rms) fluctuation
(4) and repeat the above computation for different box sizes (different scales) to provide a relationship between and .
A power-law relation between and the box size indicates the presence of scaling. The parameter , called the scaling exponent or correlation exponent, represents the correlation properties of the signal. If , there is no correlation and the signal is an uncorrelated signal (white noise); if , the signal is anticorrelated; if , there are positive correlations in the signal.
III DFA on correlations of RG and SF
First we will give a brief description about the attack and repair strategy. We start by constructing a network according to the algorithms of Erdös-Rényi random graph model (RG) or Barabási-Albert scale-free model (SF). The dynamics of the attack and repair strategy is defined in terms of the following two operations:
-
•
Attack: Find a node with the maximum degree and remove all its links. (If several nodes happen to have the same highest degree of connection, we randomly choose one of them.)
-
•
Repair: Reconnect this node with the other nodes in the network with repair probability .
Then, the evolution comes into the next Monte Carlo time step. At each Monte Carlo time step , we record the maximum degree and the average degree of the system. The reason we choose and to analyze is that they represent the local and statistical features of the system. Since the time step should be large enough to enable the system to reach stationary state, it is chosen to be 1.5 million in our simulation. To reduce the effect of fluctuation on calculated results, for every system with size , the calculated results and are averaged over 10 independent runs for each network realization.
III.1 DFA on the maximum degree
According to the attack and repair strategy, it can be easily seen that the network has a tendency to decrease the maximum number of connections among the nodes at a long time scale, because the nodes with highest connections will be damaged and reconnected randomly.
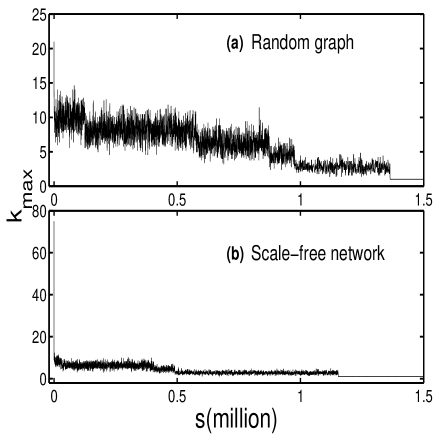
In Fig. 1, we plot the maximum degree versus time step for RG and SF with nodes and repair probability . It should be illustrated here that, in order to reduce the number of parameters in the model, we set the repair probability the same as the connection probability in RG. Fig. 1 shows that of RG decreases slowly and fluctuates widely, while of SF decreases very steeply at the beginning and then very slowly with small fluctuations. The different behaviors of for RG and SF are rooted in their different topological structures. RG has homogeneous Poissonian degree distribution: all nodes have approximately the same number of links. The removal of each node causes the same amount of damage. SF is an extremely inhomogeneous network: because the power-law distribution implies that the minority of nodes have highly connected nodes. The removal of these nodes drastically decreases the degrees of the network.
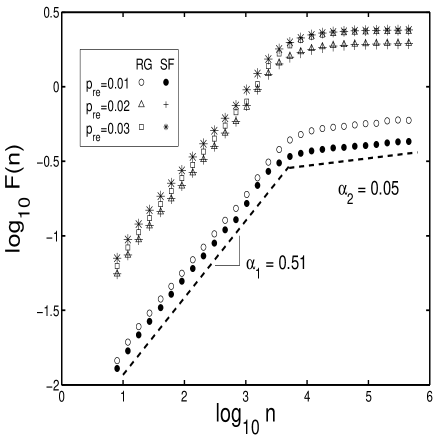
In Fig.2 we present results from the DFA-3 analysis for the maximum degree of RG and SF. The system size is nodes and the repair probability are 0.01, 0.02, 0.03, respectively. In this double logarithm graph, the root-mean-square (rms) fluctuation function as a function of the scale , exhibit two distinct scaling regimes with the crossover at about ,
| (5) |
For , the scaling exponent is about 0.51; while for , the exponent is about 0.05. Our DFA results suggest that the fluctuation is quite random (close to white noise) for short time scales. As the time scale becomes larger, the fluctuation displays strong anticorrelation, that is, a large value (compared to the average) of is almost always followed by a small value. With the increase of the repair probability , we find that there is a vertical shift of the rms fluctuation function to larger values and the shift between and 0.02 is very big. In addition, the similar shape between and is observed for both RG and SF under different , which illustrates that the time series of for RG and SF have the similar correlation properties.
III.2 DFA on the average degree
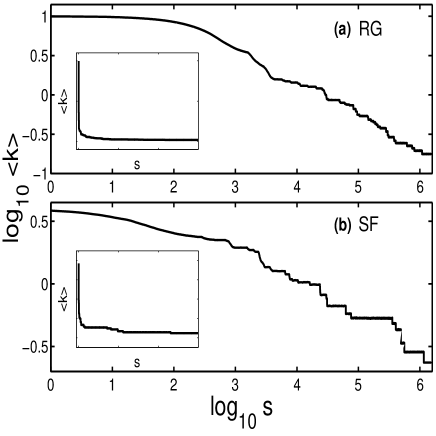
The average degree is a statistical topological property of complex networks. The time series of reflect the general changes of RG and SF under the evolution of attack and repair. We find that of both RG and SF decay exponentially with small fluctuations as shown in Fig. 3, under the system size and the repair probability . The inset panel of Fig. 3 gives the series of in linear coordinates, showing that decreases very steeply at first and then becomes steadily. In fact, the curve of , to a large degree, depends on the repair probability . The bigger the repair probability, the smoother the curve will be. Here we choose to analyze, considering to have a comparison with the results of .
We next investigate the correlation properties of series . Fig. 4(a) shows the results of applying DFA-3 to the series of RG under and 0.01, 0.02, 0.03, respectively. In the log-log coordinates, the rms fluctuation function and the scale has a power-law dependence with scaling exponent , which indicates the presence of the positive correlations and the weak long-range (long-memory) power-law correlations. The results suggest that a value of at a given time depends on values of long past in a power-law fashion. We also note that shifts downwards slightly with the increase of , which is oppositive to that of in Fig. 2. Besides, the big shift between and 0.02 vanishes here.
Fig. 4(b) reports the DFA-3 results of time series for SF under and 0.01, 0.02, 0.03, correspondingly. The two-segment power-law relationship is observed with the crossover at about ,
| (6) |
For short time scales (), the rms fluctuation function has the similar scaling exponent with for different repair probability . For longer time scales (), the exponents of , 0.02, 0.03 correspond to 0.54, 0.36, 0.23. It shows that the rms fluctuation function decreases and the series becomes strong anticorrelated with increasing for longer time scales.
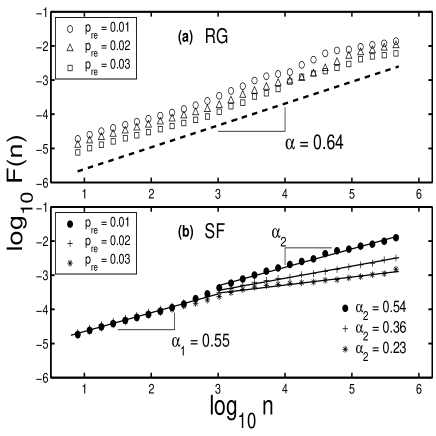
Fig. 4(a) and 4(b) demonstrate that the rms fluctuation function of series exhibits different scaling behaviors for RG and SF. The positive long-lange power-law correlations of RG are probably due to the strong restriction, defined as the connection probability equals the repair probability, . For scale-free networks, the repair probability has a great effect on the power-law degree distribution of SF in small ranges. The randomness are dominated at small time scales, characterized by uncorrelated series. While at large time scales, the power-law degree distributions are dominated, characterized by the anticorrelation.
Further, Fig. 2 and Fig. 4 represent the DFA results of series and . We note that, with the increase of , the rms fluctuation function increases in but decreases in . It is the consequence that more random connections are added with increasing . According to the local property of , the fluctuation of the system increases with added randomness. While according to the statistical property of , the fluctuation of the system decreases since the added connections balanced the degrees of the whole network.
IV Conclusions
In summary, we use DFA method to analyze the correlation properties of random graphs and scale-free networks under the attack and repair strategy. According to the analysis of the maximum degree representing the local property of the system, we find that both random graphs and scale-free networks exhibit the similar scaling behaviors, which suggest that the fluctuations are quite random at short time scales but strong anticorrelated at longer time scales. With the analysis of the average degree representing the statistical property of the system, we observe that random graphs and scale-free networks display completely different scaling behaviors. Random graphs show long-range power-law correlations; while scale-free networks are uncorrelated at short time scales but display anticorrelations at longer time scales. With the increase of the repair probability , the apparent vertical shifts of the rms fluctuation function for and are due to the effects of the increase of random connections to the networks.
Acknowledgments
This work was supported in part by the National Natural Science Foundation of China under grant Nos. 70271067, 70401020 and by the Ministry of Education of China under grant No. 03113.
References
- (1) S. Wasserman and K. Faust, Social Network Analysis, Cambridge University Press, Cambridge, England (1994).
- (2) R.J. Williams and N.D. Martinez, Nature 404 (2000) 180.
- (3) W. Li and X. Cai, Phys. Rev. E69 (2004) 046106.
- (4) L.P. Chi, R. Wang, H. Su, X.P. Xu, J.S. Zhao, W. Li, and X. Cai, Chin. Phys. Lett. 20 (2003) 1393.
- (5) P. Erdős and A. Rényi, Publ. Math. Inst. Hung. Acad. Sci. 5 (1960) 17.
- (6) R. Albert, H. Jeong, and A.-L. Barabási, Nature 401 (1999) 130.
- (7) R. Albert and A.-L. Barabási, Rev. Mod. Phys 74 (2002) 47.
- (8) M.E.J. Newman, SIAM Review 45 (2003) 167.
- (9) K.-I. Goh, B. Kahng, and D. Kim, Phys. Rev. Letts. 87 (2001) 278701.
- (10) A.-L. Barabási, R. Albert, and H. Jeong, Physica A281 (2000) 69.
- (11) P. Crucitti, V. Latora, M. Marchiori, and A. Rapisarda, Physica A340 (2004) 388.
- (12) P. Crucitti, V. Latora, M. Marchiori, and A. Rapisarda, Physica A320 (2003) 622.
- (13) P. Holme, B.J. Kim, C.N. Yoon, and S.K. Han, Phys. Rev. E65 (2002) 056109.
- (14) R. Cohen, K. Erez, D. ben-Avraham, and S. Havlin, Phys. Rev. Letts. 85 (2000) 4626.
- (15) L.K. Gallos, R. Cohen, P. Argyrakis, A. Bunde, and S. Havlin, Phys. Rev. Letts. 94 (2005) 188701.
- (16) L.P. Chi, C.B. Yang, and X. Cai, cond-mat/0505197.
- (17) C.-K. Peng, S.V. Buldyrev, S. Havlin, M. Simons, H.E. Stanley, and A.L. Goldberger, Phys. Rev. E49 (1994) 1685.
- (18) C.-K. Peng, S. Halvin, H.E. Stanley, and A.L. Goldberger, Chaos 5 (1995) 82.
- (19) Kun Hu, Plamen Ch. Ivanov, Zhi Chen, Pedro Carpena, and H.Eugene Stanley, Phys. Rev. E64 (2001) 011114.
- (20) Zhi Chen, Kun Hu, Pedro Carpena, Pedro Bernaola-Galvan, H. Eugene Stanley, and Plamen Ch. Ivanov, Phys. Rev. E71 (2005) 011104.
- (21) Jan W. Kantelhardt, Eva Koscielny-Bunde, Henio H.A. Rego, Shlomo Havlin, and Armin Bunde, Physica A295 (2001) 441.
- (22) A. Eke, P. Herman, L. Kocsis, and L.R. Kozak, Physiol. Meas. 23 (2002) R1.