Magnetic Phase Transition at 88 K in Na0.5CoO2
revealed by 23Na-NMR investigations
Abstract
Na0.5CoO2 exhibits a metal-insulator transition at K upon cooling. The nature of another transition at K has not been fully clarified yet. We report the results of measurements of the electrical conductivity , the magnetic susceptibility and 23Na NMR on a powder sample of Na0.5CoO2, including the mapping of NMR spectra, as well as probing the spin-lattice relaxation rate and the spin-spin relaxation rate , in the temperature range between 30 K and 305 K. The NMR data reflect the transition at very well but provide less evidence for the metal-insulator transition at . The temperature evolution of the shape of the spectra implies the formation of a staggered internal field below , not accompained by a rearrangement of the electric charge distribution. Our results thus indicate that in Na0.5CoO2, an unusual type of magnetic ordering in the metallic phase precedes the onset of charge ordering, which finally induces an insulating ground state.
pacs:
71.27.+a; 71.30.+h, 75.10.+z, 76.60.-kI Introduction
Compounds of the series NaxCoO2 () adopt a crystal structure which consists of alternating layers of Na+ ions and layers of edge-sharing CoO6 octahedra, with a triangular arrangement of the Co sites Huang et al. (2004a). They represent a physical realization of magnetic systems with planar triangular symmetry, in which metallicity is achieved by controlled carrier injection. The simple metallic phase () is separated from the local moment metallic phase () by the insulating phase occurring at Foo et al. (2004). A variety of other interesting phenomena is observed at different values of Na-concentration upon varying the temperature. The material with composition exhibits a large thermoelectric power Terasaki et al. (1997), and indications of a charge instability in the temperature range between 230 and 290 K were observed Gavilano et al. (2004). A spin-density wave formation at temperatures below 22 K was detected for Sugiyama et al. (2003). Superconductivity is induced at , if the CoO2-layers are intercalated with water Takada et al. (2003).
The richness of the phase diagram of NaxCoO2 is argued to be the result of a subtle interplay between electronic and structural degrees of freedom. Neutron scattering measurements Huang et al. (2004a) revealed a critical dependence of both the shape of the CoO6 octahedra and the interlayer distance on the Na concentration and on the distribution of the Na+ ions in the intervening layers, where two possible sites, Na1 and Na2, are available. The presence of ordered Na+ ions and Na+ vacancy superlattices beyond the simple average hexagonal structure was confirmed by means of electron diffraction measurements Zandbergen et al. (2004).
It is a peculiarity of the NaxCoO2-series to exhibit an insulating ground state in a very narrow range of values centered at . The metal-insulator transition in Na0.5CoO2, occurring at K Huang et al. (2004b); Foo et al. (2004) upon cooling, is reflected by anomalies in the temperature dependences of the resistivity , the magnetic susceptibility , and the specific heat. The insulating character of the low-temperature phase was also confirmed by infrared reflectivity measurements Wang et al. (2004). Unusual features were observed for the thermal conductivity, the thermopower and the Hall resistivity Foo et al. (2004). In addition, Na0.5CoO2 shows a pronounced Na superstructure Huang et al. (2004b); Zandbergen et al. (2004), where the Na+ ions order in zig-zag chains Huang et al. (2004a); Zhang et al. (2005) with an alternating occupation of Na1 and Na2 sites. Besides the metal-insulator transition, another transition at K is clearly reflected by an abrupt reduction of upon cooling. This transition is also characterized by a change of sign of Foo et al. (2004), which rapidly decreases to large negative values below with decreasing temperature. In Ref.Huang et al. (2004b) the transition was argued to be of structural type. Subsequent SR experiments have indicated an antiferromagnetically ordered ground state, but different ordering temperatures of 53 K Uemura et al. and 85 K Mendels et al. (2005) were reported. Very recent 59Co NMR and neutron scattering studies Yokoi et al. brought evidence of antiferromagnetic order below 87 K. The order was claimed to involve two types of localized Co magnetic moments of 0.34 and 0.11 , respectively.
The variety of experimentally observed features of NaxCoO2 triggered a number of intense theoretical investigations. The electronic structure of these compounds was calculated in the local (spin) density approximation (LSDA). The inclusion of a Hubbard repulsion parameter in the calculation yields the two magnetically different regimes for and Lee et al. (2004) that are observed experimentally. The calculation also explains Zhang et al. (2004) the absence of pockets of the Fermi surface, as was registered in angle-resolved photoemission (ARPES) experiments for Hasan et al. , Yang et al. (2004) and Hasan et al. (2004). If the value of is chosen large enough, an insulating ground state can be obtained for Na0.5CoO2 Li et al. (2005). The authors of Ref. Lee et al. (2005) describe a charge disproportionation accompanied by magnetic moment localization , occuring at a critical value eV.
In a different approach, a multiorbital Hubbard model with strong Coulomb repulsion was considered. The calculations predict both the Fermi surface pocket cancellation and a band narrowing Zhou et al. (2005), again in good agreement with the results of ARPES measurements Yang et al. at . With a similar approach, the authors of Ref.Indergand et al. (2005) focus on charge and spin instabilities, deriving a variety of possible metallic states with a spontaneous breaking of the original hexagonal symmetry; in particular, the zig-zag arrangement of Na+ ions observed in Na0.5CoO2 is found to be energetically favourable and it is argued that this superstructure leads to a quasi one-dimensional band structure, with the possible formation of a spin-density wave.
The aim of our work was to elucidate the nature of both the phase transition at and the phase between and in Na0.5CoO2. It is predominantly our 23Na NMR data that give clear evidence for a transition from a paramagnetic to an antiferromagnetically ordered state at K upon cooling. This transition occurs in a low-conductivity metallic phase and does not result in the opening of a gap in the spectrum of electronic excitations. This observation is, to some extent, surprising because a magnetic transition is rather expected to occur in the low-temperature insulating phase, or simultaneously with the metal-insulator transition at . To our knowledge, no theoretical model that would account for the described phenomenon has yet been proposed.
The paper is organised as follows. The preparation of the Na0.5CoO2 powder sample is described in Sec. II. In Sec. III and IV, we report the results of the measurements of the electrical conductivity and of the magnetic susceptibility . Section V is devoted to the 23Na NMR experiments. We present the temperature variations of the spectra as well as of the spin-lattice and spin-spin relaxation rates and . In Sec. VI, we discuss the experimental results. The emphasis is put on the magnetic properties of the phases at temperatures below , but also the unusual properties of the metallic regime above are considered to some extent.
II Sample
The Na0.5CoO2 powder sample was prepared by a procedure that is described in Ref.Huang et al. (2004b). First, a powder of nominal composition Na0.75CoO2 was prepared by heating a stoichiometric mixture of Co3O4 (Aldrich, 99.995) and Na2CO3 (Aldrich, 99.995) in air at 850∘C for 15 hours. The remelting procedure was repeated twice to ensure the proper cation concentration. For the synthesis of Na0.5CoO2, 0.5 g of Na0.75CoO2 were stirred in 120 ml of a solution of I2 in acetonitrile for 4 days. The quantity of dissolved I2 was chosen to be 10 times the amount that would in principle be necessary to remove all the Na from Na0.75CoO2. The resulting material was cleaned with acetonitrile and dried in flowing argon. X-ray powder diffraction patterns showed that the resulting material is of single phase with lattice parameters of =2.8134(7) and =11.129(4) Å. These parameters yield an estimated Na content of =0.48 Foo et al. (2004).
III Electrical conductivity
As a first characterization of our sample we measured the temperature dependence of the electrical resistivity. The resistance of a piece of pressed powder, whose length and cross section were mm and mm2 respectively, was measured using an a.c. four-terminal technique.
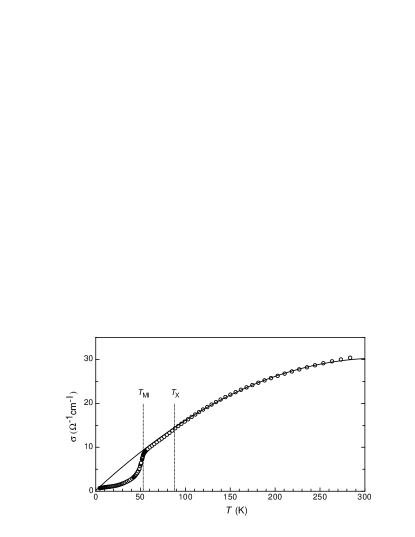
The conductivity is shown, as a function of temperature , in Fig. 1. The values of are, on the average, smaller by a factor of 30 than measured along the CoO2-planes of a single crystal and reported in Ref.Huang et al. (2004b). Nevertheless, the temperature dependence of both quantities is similar. While electron scattering at the boundaries of the powder grains is expected to occur in our sample, we do not identify it as the main cause of the discrepancy between and . The large difference and the similar temperature dependence instead suggest a significant anisotropy of the conductivity in Na0.5CoO2, not unexpected in a layered compound (see, e.g., La0.5Sr1.5MnO4, where the anisotropy in is of the order of 1000 Moritomo et al. (1995)).
Upon cooling, the gradual decrease of at high temperatures (a factor of 5 between 290 K and 100 K) is intecepted by an abrupt downturn at K. This reflects the metal-insulator transition.
The high-temperature phase is not properly metallic. The continuous decrease of with decreasing temperature is certainly not typical for a metal, but often observed in oxide materials Imada et al. (1998). Further insight into the transport properties can be gained by estimating the mean free path of the charge carriers. From the Drude law
| (1) |
with as the charge carrier density, the average scattering time, the effective mass of the charge carriers and the Fermi wave vector. We assume one conduction electron per Na atom, resulting in . For the conductivity we insert the high-temperature saturation value , which is calculated as follows. The temperature dependence of the conductivity for temperatures in the range between 100 and 260 K can be well approximated by (see Fig. 1)
| (2) |
with , , and . Accordingly, the maximum of is reached at K and we take
| (3) |
as an estimate of the saturation value at high temperatures.
We first assume a three-dimensional (3D) free electron gas with
| (4) |
Inserting (3) into (1) gives a mean free path of
| (5) |
which is far less than the interatomic distance.
For a more realistic estimate of the mean free path we take into account the layer structure of the material and we thus assume a gas of electrons that is constrained to two-dimensional (2D) planes, i.e.,
| (6) |
where is the 2D electron density and the distance between two such planes ( is the lattice constant along the -axis, see Sec. II). Thus, in Eq. (1) we replace with the estimated in-plane saturation value,
| (7) |
taking into account the single-crystal data. This yields a mean free path in the -plane of
| (8) |
and
| (9) |
Both these values suggest that a description of the electronic transport in the metallic phase in terms of simple scenarios is not tenable. Further discussions on this point are postponed to Sec. VI.
IV Magnetic susceptibility
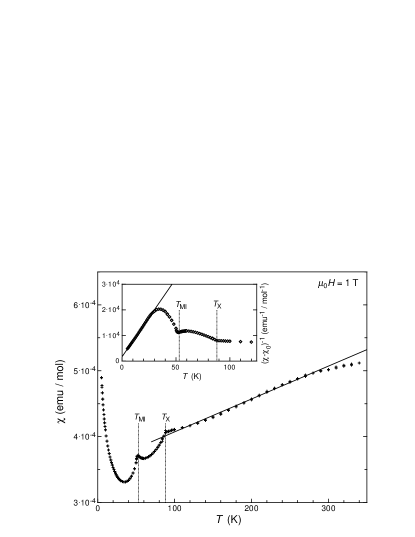
As an additional characterization of our sample, we measured the temperature dependence of the magnetic susceptibility . The magnetization of 50 mg of Na0.5CoO2, again in the form of a powder sample (number of mols ), was measured in different magnetic fields up to T and in the temperature range between 5 and 340 K. At fixed temperatures the magnetic susceptibility is found to be field independent. Figure 2 shows for T. Our result is in good agreement with previously published single-crystal data Huang et al. (2004b); Yokoi et al. .
Two anomalies at K and K are revealed by kinks, both followed by abrupt decreases of upon cooling.
Above , decreases continuously with decreasing temperature. In the range from 260 to 100 K, the susceptibility depends approximately linearly on the temperature (see Fig. 2). Above 260 K, the experimentally measured susceptibility tends to saturate to an estimated value of
| (10) |
Assuming that the susceptibility above 300 K is due to pure Pauli paramagnetism, yields the total density of states at the Fermi energy
| (11) |
Here, cm3 is the molar volume of Na0.5CoO2. The expected values of for a free 3D electron gas and for a gas of electrons constrained to 2D planes, respectively, are
| (12) |
and
| (13) |
where is again the value of the lattice constant along the -axis (see Sec. II), and is the effective mass of the conduction electrons. The comparison of given in Eq. (11) with (12) and (13) yields an effective mass
| (14) |
or, for the more realistic 2D situation,
| (15) |
where is the free electron mass. Further comments concerning these values are presented in Sec. VI.
We now consider the possibility that the anomaly in at is due to antiferromagnetic ordering of localized magnetic moments upon cooling the sample. In a very simple scenario, we suppose that the valences are Na1+ and O2-, and that there is one electron per Na atom in the conduction band. This leads to the conficuration Co4+. If we also assume that only the lowest Co orbitals are occupied Zhou et al. , we find that the total spin is per Co ion. If the orbital component is quenched, the corresponding effective magnetic moment per formula unit is
| (16) |
where . The Curie-Weiss temperature dependence of the susceptibility is
| (17) |
At = 300 K, , and at the transition temperature , respectively. These values are much larger than the measured values of , thus indicating that no significant moments reside on the Co sites. The susceptibility for is thus attributed, as claimed above, to the Pauli paramagnetism of the itinerant charge carriers. In previous work Yokoi et al. , the reduction of upon cooling below room temperature was ascribed to a pseudogap feature in the electronic excitation spectrum.
Below 20 K, increases with decreasing temperature. Forcing for 5 K 10 K to fit a Curie-Weiss function results in emu/mol, significantly less than above room temperature. The inset of Fig. 2 shows as a function of , emphasizing that
| (18) |
up to 30 K, with (emu mol)-1 K and K. The effective magnetic moment per formula unit is thus (in units of )
| (19) |
The comparison of the latter value with the value calculated in Eq. (16) leads to the conclusion that at most 7 of the Co atoms carry magnetic moments, which are still acting freely at low temperatures.
V NMR
The NMR experiments were made with two samples of pressed powder with masses 45 and 325 mg, respectively. No significant differences between the results of the measurements were observed.
The values of the magnetic fields in which the experiments were performed were determined from the measured resonance frequency of deuterated water D2O. The nuclear reference frequency was calculated using the standard gyromagnetic ratio , i.e., .
V.1 Spectra
23Na NMR spectra were obtained by monitoring the integrated spin-echo intensity as a function of the irradiation frequency in a fixed magnetic field . The echo was generated with a two-pulse -delay- spin-echo sequence, irradiating a frequency window of about 25 kHz.
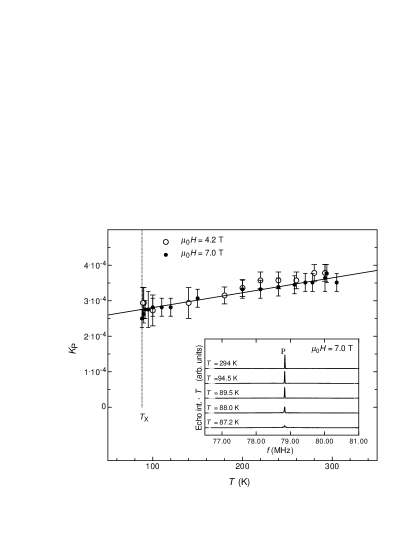
In the inset of Fig. 3, we show examples of the spectra taken in a magnetic field T at temperatures above 87.2 K. Above K, we observe a single, narrow NMR line, labeled P, peaking at a frequency . The relative frequency shift is represented in Fig. 3 as a function of temperature . is field independent and, above , varies approximately linearly with . It is related to the susceptibility by
| (20) |
The parameter and the hyperfine coupling constant is T per magnetization of a formula unit of Na0.5CoO2. The full width at half maximum (FWHM) of the NMR line P, , slowly increases upon cooling from the room temperature value, kHz, to kHz at .
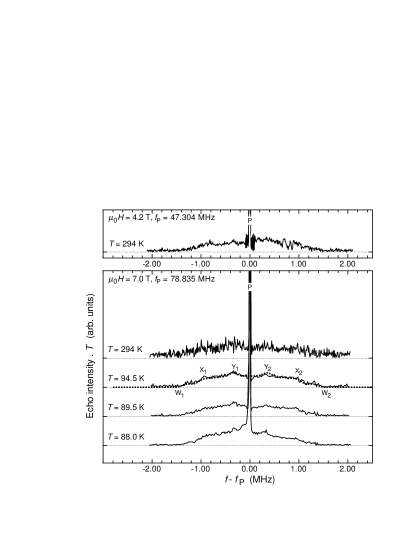
The spectra recorded at temperatures exhibit wings in the range labeled W1-W2 with features labeled X1, and X2, . Corresponding spectra are shown in Fig. 4. The shape and the width of the wings are the same for T and T, suggesting that they represent the quadrupolar wings of peak P. The ratio between the intensities of the central line P and the wings is , close to the theoretical value of . Our interpretation is further supported by the results of comparisons of the measured signals with the signal calculated by assuming a random orientation of the crystalline grains and first order quadrupolar shifts of the transitions for spin nuclei according to Abragam (1986)
| (21) |
Here, and are the spherical angles describing the orientation of the principal axes of the electric field gradient tensor with respect to the direction of the applied magnetic field. The dotted line in Fig. 4 for K represents the calculated signal without the contribution of the central transition (the peak labeled P). The best coincidence is achieved with a quadrupolar frequency MHz and an asymmetry parameter . No substantial variations in the shape and the width of the wings were found in the temperature range between 295 and 88 K, suggesting only very small rearrangements of electrical charge above .
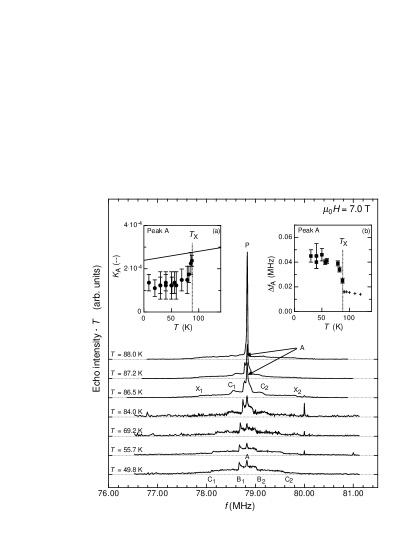
A generalized broadening of the NMR spectra, revealed by a substantial loss of intensity of the central line P, occurs at upon cooling, as is shown in Fig. 5 and in the inset of Fig. 3. At , peak P transforms into three different NMR signals, whose temperature evolution can be followed down to 30 K. The three NMR signals are (a) a narrow signal labeled A, (b) a prominent rectangular signal in the range B1-B2, labeled B, and, (c) another rectangular signal, labeled C, in the range C1-C2. Either the position or the ranges of the signals are indicated with the corresponding letters in the spectra displayed in Fig. 5.
The intensity of peak A is clearly smaller than that of the signals B and C. The relative frequency shift is represented in the inset (a) of Fig. 5 as a function of temperature . Comparing with the extrapolation of to low temperatures reveals a discontinuous change of slope at exactly . The FWHM of signal A exhibits an abrupt increase, followed by a trend to saturation to the constant value kHz, which is reached at temperatures between 70 and 60 K (see inset (b) of Fig. 5).
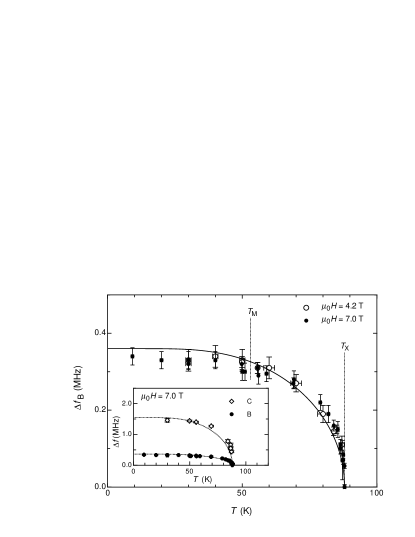
The effective frequency width of signal B is calculated as
| (22) |
where and are the frequencies of the lower and upper limits of the rectangular signal B, and kHz represents the total width in the paramagnetic state at . In order to emphasize the influence of the ordering on the NMR signal, has to be subtracted from the total width of signal B (see Eq. (22)). In Fig. 6 we present the temperature dependence of . In the inset we compare with , the latter being calculated in the same way as . and both increase with decreasing temperature, approaching a constant value for . From the main-frame diagram it is obvious that is magnetic-field independent. The ratio
| (23) |
is - and -independent, indicating that the broadening of the two signals B and C is of common origin. The behaviour of suggests that it can be considered to reflect an order parameter, as is indicated by the good agreement between the experimental data and
| (24) |
with MHz, and representing the order-parameter type function, which is the solution of the functional equation .
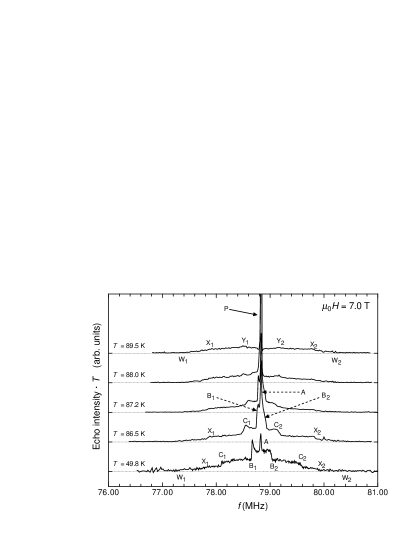
The variation of the spectra below is thus attributed to the formation of a staggered internal field. In particular, it is excluded that signals B and C are simply modifications of the quadrupolar wings observed at temperatures above . Signals B and C emerge from the NMR line P, as is clearly recognized in Fig. 7. The total intensity of the NMR signal (P+W above , A+B+C+W below ) is unchanged within an error of 5 between 94.5 and 86.5 K, excluding a loss of signal intensity across the transition. The wing features W1, and W2, are not affected by the phase transition at , yielding further support for the interpretation that signals B and C are due to transitions , and, in addition, excluding the possibility of substantial charge rearrangements at . The values of the staggered field at the B- and C-sites, respectively, are T and T, respectively.
As may be seen in Figs. 5 and 7, the quadrupolar features W1, and W2, persist with decreasing temperature down to 50 K. The changes in their frequencies , , , and , as well as the rounding-off of their contours, are accomodated by the broadening of the signals B and C.
A peak-shaped anomaly in the spectra is observed at the low-frequency end of the rectangular signal B, i.e., at the feature labelled B1 in Fig. 5. We suspect that it is a deformation of the B-labeled rectangular signal, due to the partial alignment of grains of the sample in the magnetic field, or it may be an indication for a ferromagnetic component along the external field in the ordered state.
V.2 Spin-lattice relaxation rate
We measured the 23Na NMR spin-lattice relaxation rate in the temperature range between 30 and 305 K and in fixed magnetic fields T and T. was obtained from monitoring the recovery of the 23Na nuclear magnetization after the application of a long comb of radiofrequency pulses. The experiments were performed by irradiating a frequency window of about 25 kHz. Above , the frequency was chosen to irradiate the NMR line P, while below we centered the window such as to cover either line A or part of signal B. In all the cases, a double exponential recovery function Suter et al. (1998)
| (25) |
characteristic of nuclei with only the central transition irradiated, was observed.
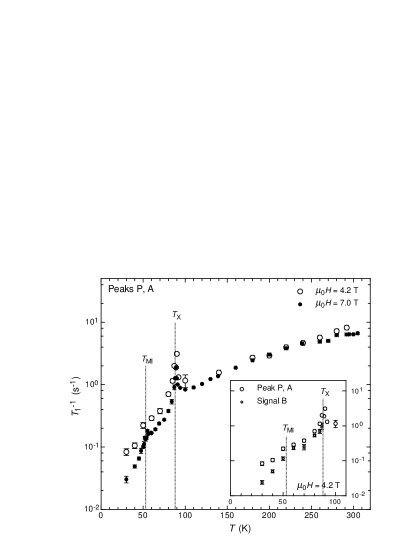
In Fig. 8, we display the temperature dependence of and we note a prominent peak in at K. Above , of the NMR line labeled P is field independent, as is expected in a state dominated by paramagnetic moments, but slowly decreases by a factor of 5 per 100 K upon cooling. The fact that the magnetization recovery follows Eq. (25) supports the identification of signal P to be due to the central transition .
Below , exhibits an overall decrease by a factor of 20-50 per 100 K. The comparison of the values obtained for T and T, respectively, indicates a decrease of with increasing field at constant temperature, a dependence compatible with the scenario of magnetic ordering. As shown in the inset of Fig. 8, the ratio between the values of of the signals A and B increases from 1 at 88 K to about 4 at 30 K. This indicates that the two signals arise from different Na sites. The general reduction of upon cooling is interrupted by a small cusp around the metal-insulator transition temperature K.
Several efforts were made to measure of signal C by irradiating a frequency window of about 25 kHz in the frequency ranges C1-B1 or B2-C2. Because of the small magnitude of the recorded NMR signal, it was difficult to separate the contribution of the C-signal from perturbations arising from the quadrupolar wings of the B-signal, as well as from the 59Co NMR signal which, below , overlaps with the 23Na signal. For this reason no reliable values could be obtained and these unsuccessful efforts were therefore abandoned.
V.3 Spin-spin relaxation rate
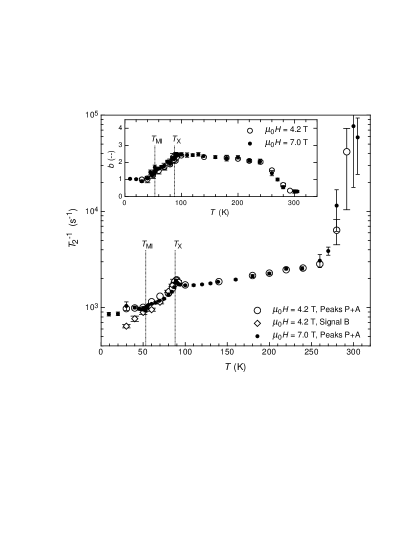
Our measurements of the 23Na NMR spin-spin relaxation rate were made in the temperature range between 30 and 305 K and in fixed magnetic fields T and T. The spin-echo lifetime was obtained by monitoring the spin-echo intensity as a function of the pulse delay time in the -delay- echo sequence. The irradiation conditions were chosen to be the same as in the -experiments. At all temperatures, the intensity decayed according to the streched exponential behaviour
| (26) |
Here, we used , where and are the durations of the and spin-echo pulses. corresponds to twice the time between the center of the pulse and the maximum of the echo signal (see Slichter (1990), p. 45). The spin-spin lattice relaxation rate is approximated by
| (27) |
which is justified because .
In Fig. 9 we display the temperature dependences of and, in the inset, of the parameter appearing in the streched exponential function (26). A value is attributed to indirect coupling between the nuclear spin at the different Na nuclei (for example, electron-mediated spin-spin interaction Ansermet et al. (1988); Walstedt and Cheong (1995)), as opposed to direct scalar or dipolar interactions which yield . For example, a value was predicted and observed for the 63,65Cu NMR spin-echo decay in high-temperature superconductors Pennington et al. (1989); Walstedt and Cheong (1996). The exact value of depends on the details of the indirect coupling mechanism. Nevertheless, a qualitative knowledge of the temperature dependence is useful, because it can reflect modifications in the interaction-mediating electron gas.
Four different temperature intervals can be identified, each characterized by its own regime, and thus by its own electronic regime. In the temperature range from 88 to 260 K, is field independent and upon cooling slowly decreases by a factor of about 1.4 per 100 K. The parameter is approximately constant.
Upon cooling, the peak in at K is followed by an abrupt decrease. Between 88 and 53 K, is reduced by a factor of 6 per 100 K upon cooling, and the parameter decreases from to . The reduction of when increasing the magnetic field from T to T is small (less than a factor of 1.1). Differences between the values of for the signals A and B are marginal (less than a factor 1.2).
Possible anomalies in at K are hidden by the noise in the data. Below , of signal A tends to a constant value with decreasing temperature, while for signal B, continues to decrease. The parameter is approximatively unity below 40 K.
Above 260 K, an abrupt upturn in with increasing temperature is observed. The enhancement is about a factor of 800 per 100 K. The parameter changes from at 260 K to at 300 K.
VI Discussion of the results
Metallic phase above .- We first turn our attention to the very unusual properties of Na0.5CoO2 in the metallic phase above and first discuss the magnetic susceptibility . At temperatures , is more or less identical for Na0.5CoO2 and Na0.31CoO2 Foo et al. (2004), and is attributed to Pauli paramagnetism. The decrease of of about 20 between 300 and 100 K is thus not a singular feature of Na0.5CoO2. The equivalence of the values of above for suggests that if the effective mass of the charge carriers is the same in all compounds, then their density is approximately the same across the range defined by of the NaxCoO2-series. At this point, we note that the substantial enhancement of the effective electron mass for Na0.5CoO2, evaluated from the high-temperature saturation value of and cited above in Eq. (15), is an order of magnitude larger with respect to the result of an LSDA+U calculation Zhou et al. (2005).
A remaining puzzle of Na0.5CoO2 is the apparent inconsistency between magnetic and transport properties. At room temperature, the conductivity is of the same order of magnitude for Na0.5CoO2 and Na0.31CoO2 Foo et al. (2004), and, more generally, for all materials with . This value implies a very short mean free path , in particular for Na0.5CoO2, as cited above in Eq. (9), and indicates an unusual transport regime. It remains an open question whether a description of the transport properties in terms of a mean free path concept makes sense at all for NaxCoO2. Although for , and, in general, for different from 0.5, the conductivity at least increases with decreasing temperature as expected for metals, for Na0.5CoO2, exhibits the opposite trend, indicating that magnetic and transport properties are not correlated in this case.
Evidence for magnetic ordering at .- The most instructive result of our experiments, the temperature evolution of the 23Na NMR spectra, provides a strong indication for Na0.5CoO2 to order antiferromagnetically at K, as previously concluded on the basis of SR-data Mendels et al. (2005) and of results of Co NMR measurements Yokoi et al. .
Above , the paramagnetic behaviour is reflected by the temperature- and field-independent proportionality . Assuming an equal occupation of the sites Na1 and Na2, the appearance of a single NMR signal P suggests a uniform distribution of magnetic moment density in the conducting CoO2-layers, implying a value of the hyperfine coupling constant that is equal for all Na sites.
The broadening of signals B and C upon cooling below (see Fig. 6) can only be accounted for by assuming the formation of a staggered internal field . The magnetic nature of the transition is confirmed by the kink in (see Fig. 2) and by the anomalies in (see Fig. 8), and (see Fig. 9) at . The abrupt decrease of below is typical for the suppression of magnetic fluctuations, which, in our case, is caused by the onset of an ordered state. The magnetic ordering yields two inequivalent sites, B and C, with . From the ratio of the signal intensities B and C, which is close to 1, we argue that the two signals arise from two magnetically inequivalent but equally occupied Na sites. Although other possibilities cannot be excluded a priori, it is plausible to identify the two sites with Na1 and Na2, an assignment that results from previous work Huang et al. (2004a); Zandbergen et al. (2004).
Itinerant type of ordering at .- In comparison with the electronic-transport and magnetic-ordering features of a large number of oxide compounds Imada et al. (1998), Na0.5CoO2 seems to be a special case. The magnetic order sets in at a temperature that significantly exceeds the metal-insulator transition temperature , and not at Takano and Takeda (1983) or below Lee and Cheong (1997); Sternlieb et al. (1996).
From the analysis of the data of Na0.5CoO2, presented in Sec. IV, we conclude that at most a few percent of the Co ions carry a local magnetic moment which would be present also in the metallic phase. This amount is certainly too small to identify the transition at as an ordering of such moments upon cooling. This implies that the observed antiferromagnetic order below most likely involves the magnetic moments of the conduction electrons, and thus is of itinerant type. Considering this situation, any attempt to determine the spontaneous magnetization density from NMR data alone is difficult and would yield only very speculative results.
Origin of signal A.- Despite its weak intensity, signal A is not attributed to the persistence of a small portion of paramagnetic phase in the sample. This scenario would imply that signal A is a remnant of signal P. The NMR data , , and below (see Sec. V) exclude this interpretation because their -variations are correlated to those of signals B and C. The latter are clearly features related to the ordered phase below . Signal A may, e.g., be due to Na nuclei which couple more weakly to the ordered moments, because they are located at boundaries of domains with different magnetic and/or Na-ordering patterns.
Absence of charge disproportionation or structural modifications.- The temperature evolution of the 23Na NMR spectra around ( K) provides no evidence for significant variations of the quadrupolar parameters and (see Fig. 7). This observation allows to straighten out a controversy, in the sense that we can exclude a charge disproportionation or a structural transition to occur at .
The features of the quadrupolar wings in the spectra can be tracked down to 50 K, i.e., to below the metal-insulator transition temperature (see Fig. 5). We did not observe abrupt changes in these features at . This excludes an abrupt charge disproportionation with decreasing temperature at . The formal valence of the Co ions is either unaffected or, at most, only gently altered by the metal insulator transition.
Magnetic component of the metal-insulator transition at .- Our data reveal that the metal insulator transition also involves a magnetic component. The abrupt decrease in below K upon cooling, and the observed anomalies in and support this claim. The metal-insulator transition is not reflected in the temperature evolution of the 23Na NMR spectra, indicating that the staggered magnetic field at the Na sites is not significantly modified at . A magnetic component of the metal-insulator transition was already claimed by the authors of Ref.Mendels et al. (2005). Their conclusions were based on anomalous temperature dependences of two of the three detected SR-frequencies at , which were attributed to moderate reorientations of magnetic moments. Such a scenario seems to be contradicted by our data. The saturation trend upon cooling exhibited by above is interrupted by an abrupt decrease in below . This behaviour cannot accomodated by small rearrangements of the magnetic moments, but more likely hints for the onset of a different regime of magnetic fluctuations below .
Curie-Weiss behaviour of at low temperatures.- In previous work Huang et al. (2004b) an anomaly in the electrical conductivity at 25 K was observed and attributed to the occurrence of a phase transition. Based on anomalies in the temperature evolution of SR-frequencies at 29 K, the authors of Ref.Mendels et al. (2005) suggested some rearrangements of magnetic moments in the ordered phase. In view of these speculations, the observed upturn of with decreasing temperature below 25 K (see Sec. IV) requires some additional comments. The presence of such an upturn was already reported in Ref.Foo et al. (2004), but other reports suggest that tends to a constant value with Huang et al. (2004b); Yokoi et al. . The discrepancies suggest that the free magnetic moments, which determine the low-temperature Curie-Weiss behaviour of , may be related to presence of defects or domains in the sample, whose concentration is sample dependent. In any case, only a few percent of Co ions are involved. Hence we argue that the upturn in in Na0.5CoO2 is not related to any phase transition at all.
High-temperature regime.- Anomalies in and are observed at 260 K (see Fig. 9). They are accompanied by the onset of a trend to saturation of (see Fig. 2). However, we did not observe concomitant significant changes in the 23Na NMR spectra, implying that the cause of the above anomalies is very unlikely of magnetic type, but rather due to the onset of a different regime of interaction between the magnetic moments of the Na nuclei. Since the onset of Na motion would be reflected by visible changes in the spectra, as was observed in Na0.7CoO2 Gavilano et al. (2004, ), we attribute the anomalies in and to small rearrangements in the Na positions.
VII Conclusions
In Na0.5CoO2, the onset of the insulating phase at K is preceded by an unusual type of antiferromagnetic ordering below K, i.e., in the metallic phase. Our data exclude a concomitant structural-type of ordering at . The physical properties of the metallic phase above are characterized by a large effective mass and an extremely short mean free path of the itinerant charge carriers. A convincing description of the itinerant-electron system of Na0.5CoO2 above is yet to be found.
Note added.- During the preparation of this manuscript, we got aware of a Co and Na NMR study on Na0.5CoO2 Bobroff et al. . The authors report clear evidence for antiferromagnetic ordering below 86 K, not accompanied by any charge disproportionation with decreasing temperature. These conclusions are identical to those which follow from our experimental results.
Acknowledgements.
We acknowledge useful discussions with M. Indergand and M. Sigrist. We also acknowledge the support of K. Magishi in interpreting part of the NMR data. The work benefitted from partial financial support of the Schweizerische Nationalfonds zur Förderung der wissenschaftlichen Forschung.References
- Huang et al. (2004a) Q. Huang, M. L. Foo, R. A. Pascal, Jr., J. W. Lynn, B. H. Toby, T. He, H. W. Zandbergen, and R. J. Cava, Phys. Rev. B 70, 184110 (2004a).
- Foo et al. (2004) M. L. Foo, Y. Wang, S. Watauchi, H. W. Zandbergen, T. He, R. J. Cava, and N. P. Ong, Phys. Rev. Lett. 92, 247001 (2004).
- Terasaki et al. (1997) I. Terasaki, Y. Sasago, and K. Uchinokura, Phys. Rev. B 56, R12685 (1997).
- Gavilano et al. (2004) J. L. Gavilano, D. Rau, B. Pedrini, J. Hinderer, H. R. Ott, S. M. Kazakov, and J. Karpinski, Phys. Rev. B 69, 100404(R) (2004).
- Sugiyama et al. (2003) J. Sugiyama, H. Itahara, J. H. Brewer, E. J. Ansaldo, T. Motohashi, M. Karppinen, and H. Yamauchi, Phys. Rev. B 67, 214420 (2003).
- Takada et al. (2003) K. Takada, H. Sakurai, E.Takayama-Muromachi, F. Izumi, R. A. Dilanian, and T. Sasaki, Nature (London) 422, 53 (2003).
- Zandbergen et al. (2004) H. W. Zandbergen, M. L. Foo, Q. Xu, V. Kumar, , and R. J. Cava, Phys. Rev. B 70, 024101 (2004).
- Huang et al. (2004b) Q. Huang, M. L. Foo, J. W. Lynn, H. W. Zandbergen, G. Lawes, Y. Wang, B. H. Toby, A. P. R. N. P. Ong, and R. J. Cava, J. Phys.: Cond. Mat. 16, 5803 (2004b).
- Wang et al. (2004) N. L. Wang, D. Wu, G. Li, X. H. Chen, C. H. Wang, and X. G. Luo, Phys. Rev. Lett. 93, 147403 (2004).
- Zhang et al. (2005) P. Zhang, R. B. Capaz, M. L. Cohen, , and S. G. Louie, Phys. Rev. B 71, 153102 (2005).
- (11) Y. J. Uemura, P. L. Russo, A. T. Savici, C. R. Wiebe, G. J. MacDougall, G. M. Luke, M. Mochizuki, Y. Yanase, M. Ogata, M. L. Foo, et al., eprint cond-mat/0403031.
- Mendels et al. (2005) P. Mendels, D. Bono, J. Bobroff, G. Collin, D. Colson, N. Blanchard, H. Alloul, I. Mukhamedshin, F. Bert, A. Amato, et al., Phys. Rev. Lett. 94, 136403 (2005).
- (13) M. Yokoi, T. Moyoshi, Y. Kobayashi, M. Soda, Y. Yasui, M. Sato, and K. Kakurai, eprint cond-mat/0506220.
- Lee et al. (2004) K.-W. Lee, J. Kunes, and W. E. Pickett, Phys. Rev. B 70, 045104 (2004).
- Zhang et al. (2004) P. Zhang, W. Luo, M. L. Cohen, and S. G. Louie, Phys. Rev. Lett. 93, 236402 (2004).
- (16) M. Z. Hasan, D. Quian, Y. Li, A. V. Fedorov, Y.-D. Chuang, A. P. Kuprin, M. L. Foo, and R. J. Cava, eprint cond-mat/0501530.
- Yang et al. (2004) H.-B. Yang, S.-C. Wang, A. K. P. Sekharan, H. Matsui, S. Souma, T. Sato, T. Takahashi, T. Takeuchi, J. C. Campuzano, R. Jin, et al., Phys. Rev. Lett. 92, 246403 (2004).
- Hasan et al. (2004) M. Z. Hasan, Y.-D. Chuang, D. Quian, Y. W. Li, Y. Kong, A. Kuprin, A. V. Fedorov, R. Kimmerling, E. Rothenberg, K. Rossnagel, et al., Phys. Rev. Lett. 92, 246402 (2004).
- Li et al. (2005) Z. Li, J. Yang, J. G. Hou, and Q. Zhu, Phys. Rev. B 71, 024502 (2005).
- Lee et al. (2005) K.-W. Lee, J. Kunes, P. Novak, and W. E. Pickett, Phys. Rev. Lett. 94, 026403 (2005).
- Zhou et al. (2005) S. Zhou, M. Gao, H. Ding, P. A. Lee, and Z. Wang, Phys. Rev. Lett. 94, 206401 (2005).
- (22) H.-B. Yang, Z.-H. Pan, A. K. P. Sekharan, T. Sato, S. Souma, T. Takahashi, R. Jin, B. C. Sales, D. Mandrus, A. V. Fedorov, et al., eprint cond-mat/0501403.
- Indergand et al. (2005) M. Indergand, Y. Yamashita, H. Kusunose, and M. Sigrist, Phys. Rev. B 71, 214414 (2005).
- Moritomo et al. (1995) Y. Moritomo, Y. Tomioka, A. Asamitsu, Y. Tokura, and Y. Matsui, Phys. Rev. B 51, R3297 (1995).
- Imada et al. (1998) M. Imada, A. Fujimori, and Y. Tokura, Rev. Mod. Phys. 70, 1039 (1998).
- (26) S. Zhou, M. Gao, H. Ding, P. A. Lee, and Z. Wang, eprint cond-mat/0503346.
- Abragam (1986) A. Abragam, Principles of Nuclear Magnetism (Oxford University Press, London, 1986).
- Suter et al. (1998) A. Suter, M. Mali, J. Roos, and D. Brinkman, J. Phys.: Cond. Mat. 10, 5977 (1998).
- Slichter (1990) C. P. Slichter, Principles of Magnetic Resonance (Springer Verlag, Berlin, 1990), 3rd ed.
- Ansermet et al. (1988) J. P. Ansermet, C. P. Slichter, and J. H. Sinfelt, J. Chem. Phys. 88, 5963 (1988).
- Walstedt and Cheong (1995) R. E. Walstedt and S.-W. Cheong, Phys. Rev. B 51, 3163 (1995).
- Pennington et al. (1989) C. H. Pennington, D. J. Durand, C. P. Slichter, J. P. Rice, E. D. Bukowski, and D. M. Ginsberg, Phys. Rev. B 39, 274 (1989).
- Walstedt and Cheong (1996) R. E. Walstedt and S.-W. Cheong, Phys. Rev. B 53, R6030 (1996).
- Takano and Takeda (1983) M. Takano and Y. Takeda, Bull. Ins. Chem. Res., Kyoto Univ. 61, 406 (1983).
- Lee and Cheong (1997) S. H. Lee and S. W. Cheong, Phys. Rev. Lett. 79, 2514 (1997).
- Sternlieb et al. (1996) B. J. Sternlieb, J. P. Hill, U. C. Wildgruber, G. M. Luke, B. Nachumi, Y. Moritomo, and Y. Tokura, Phys. Rev. Lett. 76, 2169 (1996).
- (37) J. L. Gavilano, B. Pedrini, and H. R. Ott, eprint (unpublished).
- (38) J. Bobroff, G. Lang, H. Alloul, N. Blanchard, and G. Collin, eprint cond-mat/050607514.