A Systematic Study of the Superconducting and Normal State Properties of Neutron Irradiated MgB2
Abstract
We have performed a systematic study of the evolution of the superconducting and normal state properties of neutron irradiated MgB2 wire segments as a function of fluence and post exposure annealing temperature and time. All fluences used suppressed the transition temperature, Tc, below 5 K and expanded the unit cell. For each annealing temperature Tc recovers with annealing time and the upper critical field, Hc2(T=0), approximately scales with Tc. By judicious choice of fluence, annealing temperature and time, the Tc of damaged MgB2 can be tuned to virtually any value between 5 and 39 K. For higher annealing temperatures and longer annealing times the recovery of Tc tends to coincide with a decrease in the normal state resistivity and a systematic recovery of the lattice parameters.
pacs:
74.25.Bt; 74.25Fy; 74.25.HaI Introduction
It has been well established that superconductivity near 40 K 1 in MgB2 is phonon mediated 2 ; 3 with two distinct energy gaps 4 [see reference 5 and works therein for a review of the basic properties of MgB2]. Much recent work has focused on understanding how structural defects and chemical substitutions affect the superconducting properties. The goal is two fold; first, to understand the basic physics in this unique system and second, to use this understanding as a basis for developing practical superconducting wires, tapes, or devices.
Of the many elements investigated, only Al and C have shown concrete evidence of entering the structure 6 . Both electron dope the system and it is the the Fermi surface changes, rather than interband scattering, which are believed to cause the suppression of Tc 3 ; 7 . When aluminum substitutes for magnesium, H decreases while H remains constant or slightly increases, resulting in an decrease in the anisotropy ratio, H=HH. 7 ; 8 ; 9 . These changes can be understood as the result of changes in the Fermi surface topology of the band 10 . In the case of carbon substitution for boron, the upper critical field is enhanced in both directions 11 ; 12 , with H increasing more rapidly than H leading to a decrease in the anisotropy ratio 7 . This enhancement of the upper critical field can not be explained in terms of changes in the Fermi surface and is believed to result from an increase the scattering in the band 7 in accordance with the theory proposed by Gurevich 13 .
Damaging or disordering of the sample using protons, heavy ions, neutrons, etc., is another route to systematically changing the system. Of these possible routes, neutron irradiation offers the best avenue for uniformly damaging bulk MgB2. There are two main sources of damage from neutron irradiation of MgB2. First, fast neutrons deposit energy through inelastic collisions with atoms, creating thermal and dislocation spikes 24 . Second, 10B has a large capture cross section for lower energy neutrons and readily absorbs these thermal neutrons, subsequently decaying to 7Li. Early neutron damage studies focused on irradiation of powders or pressed pellets of MgB2 containing natural boron 14 ; 15 ; 16 ; 17 .
The absorption of slow neutrons by 10B can lead to self shielding and prevents uniform damage in bulk MgB2 samples significantly larger than the penetration depth. Under the assumption of linear absorption, the intensity of the incident beam decreases exponentially within the sample, and is given by 99 :
| (1) |
where I0 is the initial intensity, t is the sample depth, s is the absorption cross section, and N is the number density of atoms. Here, N corresponds to the number of 10B atoms per cm3. A calculation of the half depth in MgB2 synthesized from natural boron, which consists of 19.9% 10B, yields a depth of approximately 130 m. Samples with dimensions significantly larger than 130 m will contain substantial gradients of damage associated with slow neutron absorption. Therefore several different approaches have been employed to minimize neutron capture, ensuring homogeneous damage throughout bulk samples. Thermal neutrons have been blocked by a cadmium shield 15 ; 18 ; 19 or the natural boron has been replaced with isotopically enriched 11B 20 ; 21 .
An alternate approach is to damage MgB2 objects with characteristic dimensions comparable to or smaller than 130 m. In this case natural boron can be used and relatively homogeneous absorption of slow neutrons can be assumed. In this paper we report on the isotropic irradiation of fully dense, 140 m diameter, MgB2 wires with both thermal and fast neutrons. Although these fibers contain natural boron, they were exposed to an isotropic fluence and had sample dimensions comparable to the penetration length, implying the defect structure should be fairly uniform throughout the samples.
II Experimental Methods
We synthesized fully dense, 140 micrometer diameter MgB2 wire by reacting boron filaments with magnesium vapor at 950 oC for 36 hours. This technique is described in full detail elsewhere 22 . Once synthesized, three fibers, each approximately 1-2 cm in length, were sealed under a partial helium atmosphere in quartz ampoules with dimensions of 3 mm I.D., 4 mm O.D., and approximately 3 cm long. A partial atmosphere of inert gas was necessary to provide thermal contact with the cooling water, so as to prevent the filaments from overheating during the irradiation. Helium was used due to its low neutron capture cross section. A 2.5 cm diameter, 4.7 cm long water flooded aluminum can containing 25 ampoules was then exposed to an isotropic flux of reactor neutrons, consisting of 98% thermal neutrons (E=25.3 meV) and 2% epithermal neutrons (ranging in energy up to 10 keV), at the Missouri University Research Reactor (MURR) for time periods of 24, 48, 72, and 96 hours. The exposures corresponded to fluences of , , , and cm-2 respectively (Table 1). Table 1 also includes estimates of the atomic percentage of boron converted to lithium. The fluences were estimated using a cobalt doped aluminum flux wire. The percent of lithium produced was estimated, under the assumption of a uniform fluence throughout the sample, by the product of the density of 10B, the 10B neutron capture cross section, and the neutron fluence 99 . Post exposure anneals were performed with the samples still sealed within the quartz ampoules for temperatures up to 500 oC in a Lindberg model 55035 Mini-Mite tube furnace. In each case, we annealed an ampoule at a given temperature for a set period of time. Upon removal from the furnace, the ampoules were quenched in air and then opened in order to perform measurements on the individual wires. Each data point (i.e. each fluence/annealing time/annealing temperature) is from a single sample that was annealed only once. In some cases we measured several samples which underwent nominally the same conditions and this was done either by using different wires within a given ampoule or from annealing additional ampoules under the same profile. In all cases measurements were performed on samples which underwent only a single anneal.
The boron filaments used in this study contain a tungsten boride core. Fast neutrons colliding with 182W atoms, which have a natural abundance of 26.3%, can be absorbed into the nucleus causing the emission of a proton and transforming the tungsten into 182Ta. 182Ta decays back to 182W, with a half life of 181 days. As a result the filaments were mildly radioactive and required appropriate safety measures in handling.
Powder x-ray diffraction (XRD) measurements were made at room temperature using CuK radiation in a Rigaku Miniflex Diffractometer. A silicon standard was used to calibrate each pattern. The experimentally determined Si peak positions were found to be offset from their known values by a constant amount. Within each spectra, the peaks varied about some constant offset and this variation was used to estimate experimental uncertainty in the lattice parameters. Lattice parameters were determined from the position of the (002) and (110) peaks. DC magnetization measurements and magnetization hysteresis loops were performed in a Quantum Design MPMS-5 SQUID magnetometer. Transport measurements were done using a standard AC four probe technique, with platinum wires attached to the samples with Epotek H20E silver epoxy. In a previous study 187 we note that during the synthesis of the boron filament, the tungsten reacts with B in the gas stream forming a host of tungsten boride compounds. As a result the core is not a low resistance W wire, but a much more highly resistive alloy of the refractory boride materials WxBy that, due to expansion associated with the formation of the MgB2 is segmented. In addition to the transmutation of some of the W to Ta, the presence of natural boron in the core will lead the presence of defects caused by the transmustion of 10B to 7Li just as in the MgB2 wire. Additionally, the cross section of the core is only 2% of the cross section of the wire. We therefore take the measurement of the resistivity to represent the resistivity of the MgB2. (This assumption is valid as long as the resistivity of the core remains above cm. Given the non-stoichiometry, radiation damage, transmutation and segmentation of the core we feel this is a safe assumption.) Resistivity versus temperature measurements in applied magnetic fields up to 14 T were carried out in a Quantum Design PPMS-14 system and resistivity versus field was measured up to 32.5 T in a DC resistive magnet using a lock-in amplifier technique at the National High Magnetic Field Laboratory in Tallahassee, Florida.
III Fluence and Annealing Studies
Normal state and superconducting properties were found to be a function of fluence, annealing time, and annealing temperature. We present the data in the following order: (a) structural studies on as-damaged wires, (b) 24 hour anneals at varying temperatures for a fluence of cm-2, (c) Variable time anneals for a fluence of cm-2, (d) 24 hour anneals for all measured fluence levels, and (e) 1000 hour anneals on all four fluence levels. With these cuts through the multi-parameter, fluence, annealing temperature, annealing time phase space we can start to describe the effects of neutron damage on MgB2 samples made with natural boron.
III.1 Structural Studies of As Damaged Samples
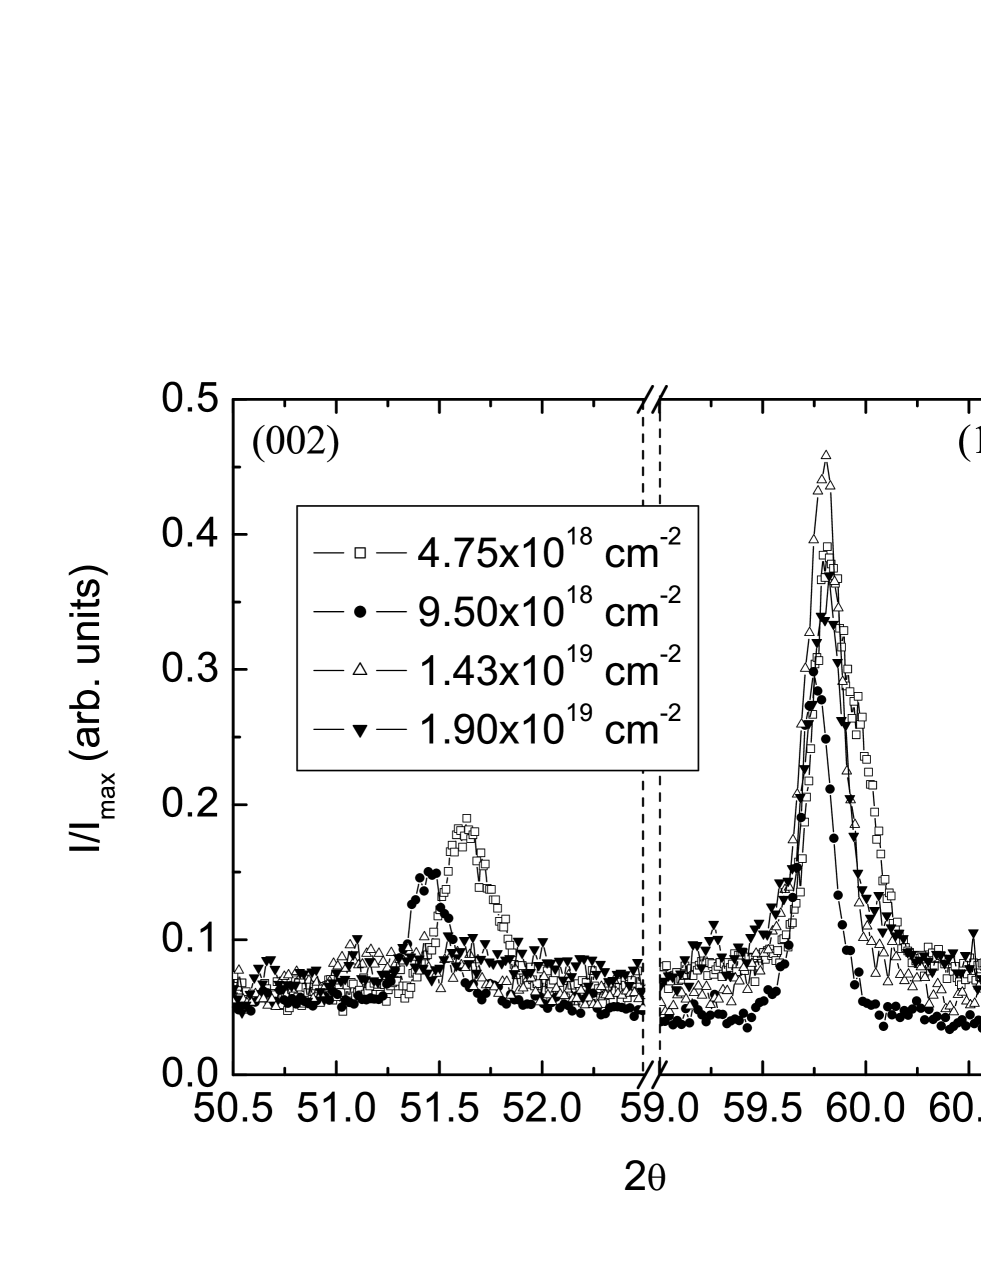
The x-ray (002) and (110) peaks for an un-damaged wire and the entire set of as-damaged samples are plotted in figure 1a. The lowest exposure level, cm-2, shows an anisotropic expansion of the unit cell. The a- lattice parameter increases from 3.0876(5) in the un-damaged sample to 3.0989(2) , an increase of 0.0113(7) or 0.37%. The c- lattice parameter increases from 3.5209(7) to 3.5747(2) , an increase of 0.0538(9) or 1.02%. Similar anisotropic expansion of the unit cell was seen by Karkin et. al. 14 . The authors report lattice parameter increases of a=0.0075 or 0.24% and c=0.0317 or 0.9% for a fluence of cm-2 thermal neutrons and cm-2 fast neutrons. For irradiation of isotopically enriched Mg11B2, little change was seen in the a- lattice parameter up to a fluence level of 1017 cm-2 20 . For this fluence level the authors report a 0.008 or 0.23% increase in the c- lattice parameter relative to an undamaged sample. Due to the large differences in a and c reported for different irradiation conditions, we performed systematic study of the lattice parameters as a function of fluence level, annealing temperature, and annealing time for samples all prepared in the same manner.
Relative to the cm-2 fluence level, filaments exposed to a fluence of cm-2 show a further expansion of the unit cell, with the a- and c-lattice parameters reaching 3.1017(7) and 3.5805(10) , respectively. The response to further increases in exposure qualitatively changes. For an exposure level of cm-2 the (002) peak broadens substantially and the a- and c- lattice parameters contract relative to the samples exposed to the cm-2 fluence level. Increasing the fluence further to cm-2 results in a further contraction of both the a- and c- lattice parameters with the (002)peak remaining broad. The x-ray scan for the as-damaged, cm-2 fluence level sample, from 2=20-65o is plotted in figure 1b. The peak widths for the MgB2 (hk0) peaks are within a factor of two of the widths for neighboring Si peaks, whereas the MgB2 (001) peak is not resolvable and the (002) peak is more than five times as broad as the Si peaks. It should be noted that in pure, undamaged MgB2 all x-ray peaks have full width at half maximum (FWHM) values comparable to those of the Si standard. For example, the peaks used to determine the lattice parameters in the undamaged wires used in this study, the (002) and (110), had FWHM values of 0.216o and 0.221o respectively. The neighboring Si peak, the (311) peak which occurs at 56.110o 2, had a FWHM of 0.190o.
In the case of a fluence level of cm-2, the MgB2 (100) peak, occurring at 2=33.397o has a full width at half maximum (FWHM) of 0.216o, in comparison to the FWHM of 0.180o for the Si (111) peak at 2=28.422o. Similarly the MgB2 (110) and Si (311), which occur at 59.686o and 56.110o 2, had FWHM values of 0.291o and 0.163o respectively. In contrast, the MgB2 (002) peak has a FWHM of 1.335o. The resultant correlation lengths, given by 2 = , are approximately 4000 in the plane and 700 along the c-direction. The mixed (101) peak has a FWHM of 1.045o and a correlation length near 1000 , values intermediate between the two extrema. The two highest fluence levels have resulted in an anisotropic change in the correlation length, with a decrease in long range order between the boron planes. Since the (002) peak has substantially broadened for higher fluence levels, tracking the trend in c becomes harder due to the inherent decrease in accurately defining peak position.
III.2 24 Hour Anneals of Samples Exposed to a Fluence of cm-2
As-damaged samples showed a suppression of Tc to below 5 K. This is a much larger suppression than seen upon irradiating Mg11B2 20 : the authors report a Tc of 12.2 K for a fluence of cm-2. Irradiation of MgB2, i.e. with natural boron, using a fast neutron fluence of cm-2 gave a Tc of 30.2 K 16 . Thus damage induced via neutron capture and subsequent alpha decay appears to play a significant role in suppressing superconductivity. To further investigate the effects of uniform irradiation on samples containing natural boron we have performed a systematic study of the normal state and superconducting properties as a function of annealing temperature for samples annealed for 24 hours.
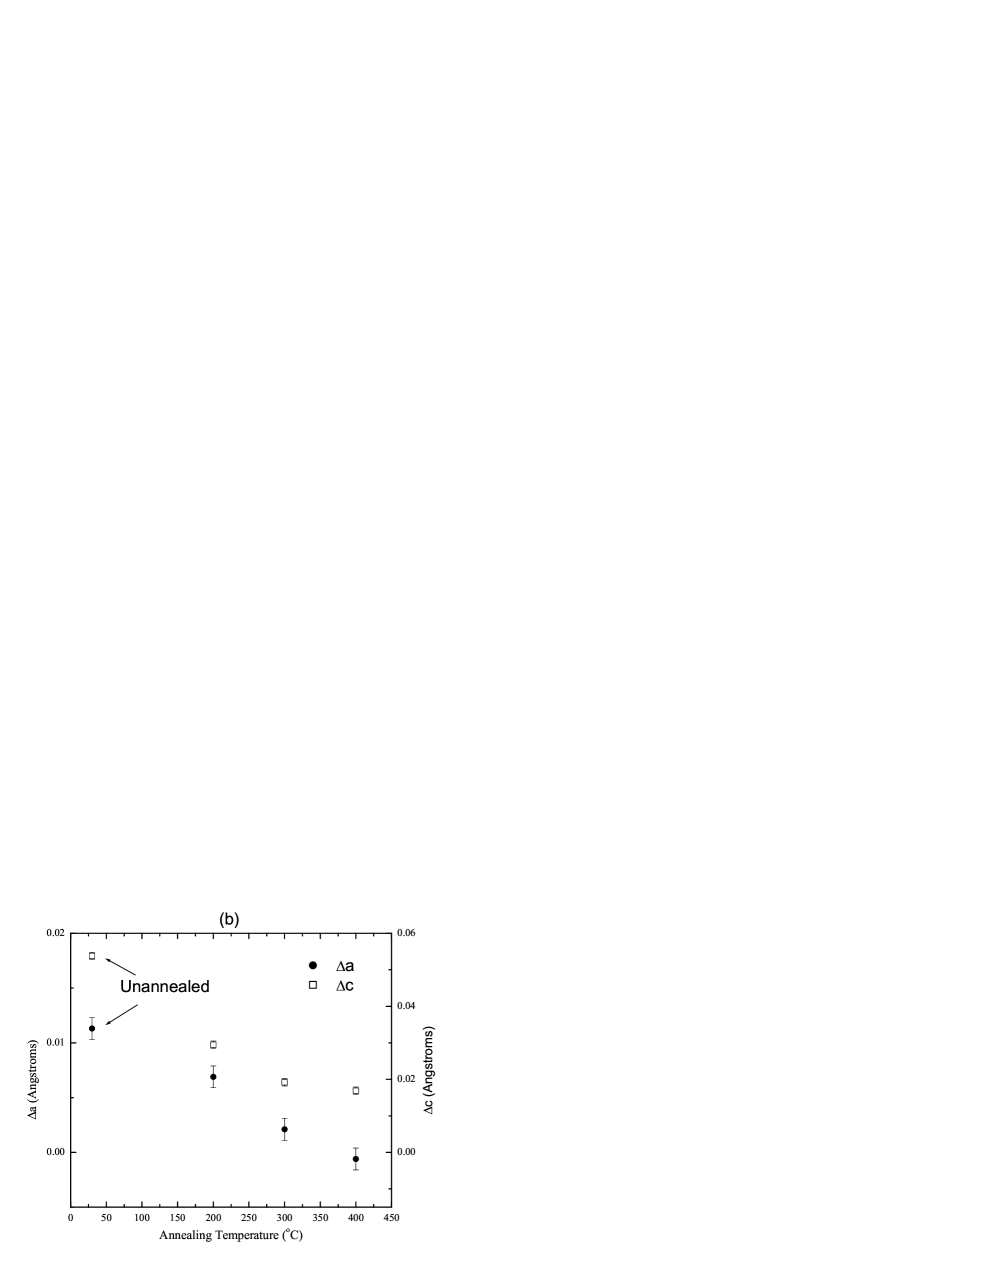
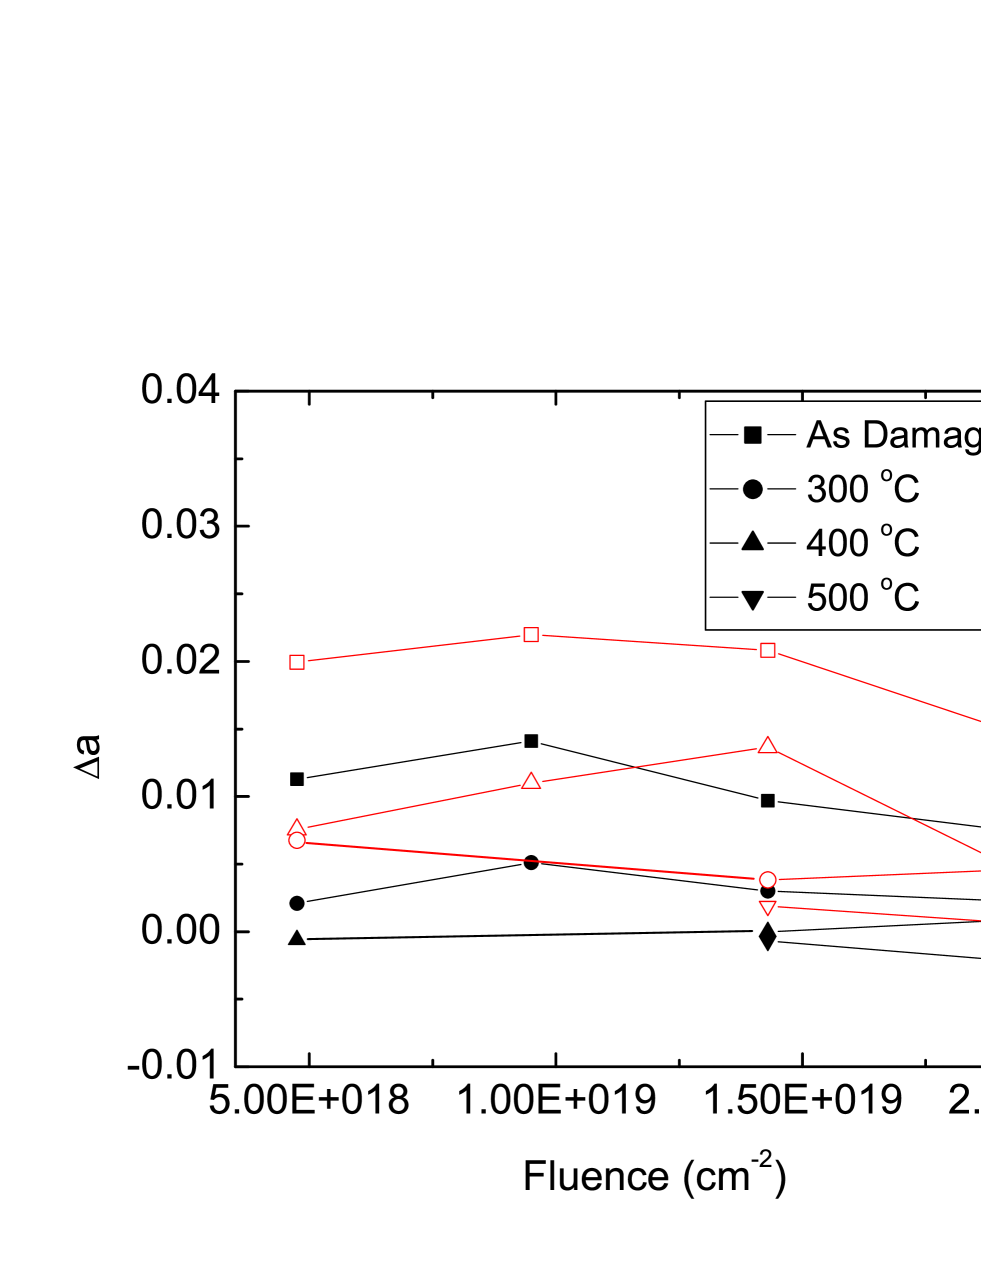
We annealed a set of wires, exposed to a fluence of cm-2, for 24 hours at 100 oC, 150 oC, 200 oC, 300 oC, 400 oC, and 500 oC. X-ray measurements indicate the initial expansion of the unit cell could be systematically reversed by subsequent annealing (Figure 2), with the a and c values decreasing with increasing annealing temperature (Figure 2b). The a-lattice parameters is completely restored after annealing at 400 oC whereas the c- lattice parameter appears to be saturating at a value near 0.6% larger than that of the undamaged sample.
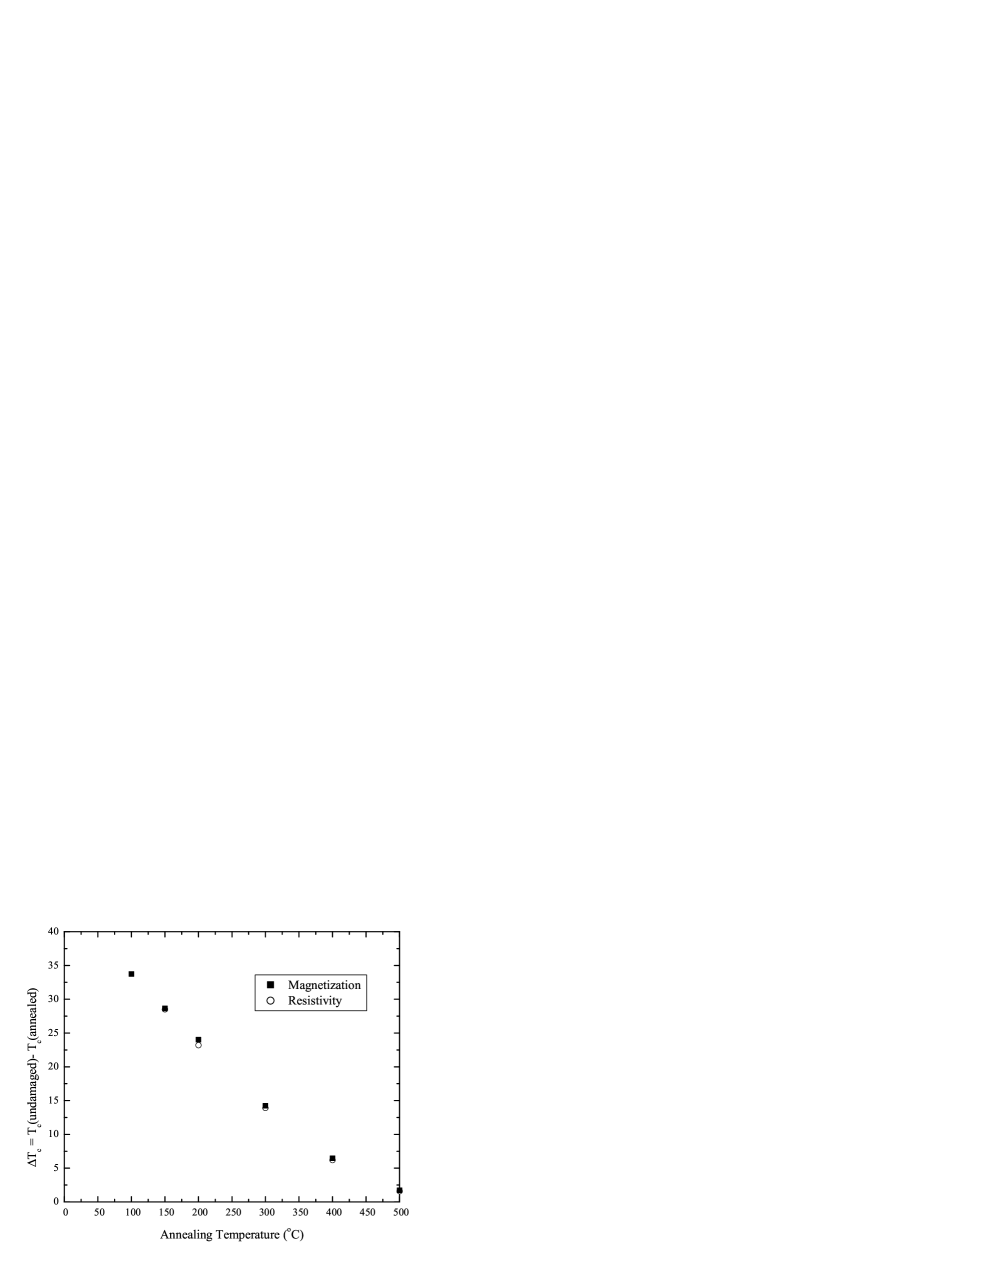
The superconducting transition temperatures were determined using a 1% screening criteria in zero field cooled DC magnetization measurements (Figure 3a) and an onset criteria in resistivity versus temperature measurements (Figure 3b). The magnetic transitions for the entire set are fairly sharp, typically achieving 95% of the saturated value 2.5 K below the 1% criteria used for Tc. This suggests a relatively homogeneous damaging of the sample. We were unable to obtain reliable transport measurements on as damaged as well as the 100 oC annealed samples due to the 120 oC temperature required to cure the silver epoxy contacts. The 30 minute 120 oC cure of the epoxy, as well as the possible exotherm associated with the epoxy curing, placed the sample into a poorly defined annealed state. As shown in figures 3a and 3b, superconductivity is restored by the annealing process. , defined as the difference between the undamaged and that of the annealed sample, monotonically approaches zero as the annealing temperature is increased (Figure 4).
The zero field temperature dependent resistivity data are plotted in figure 3b. The sample annealed at 150oC has a low temperature normal state resistivity slightly above 6 cm, which is an order of magnitude larger than the undamaged value of 0.2 cm. After annealing at a temperature of 200oC, increases by another four fold. Further increases in the annealing temperature result in a monotonic decrease of the normal state resistivity, to 1.6 cm at an annealing temperature of 500oC. Although we were able to perform a measurement on only a single sample, this increase in at 200oC is thought to be a real effect, as it also manifests itself in normalized /(300 K) plots, indicating it is not associated with a pathologic geometric problem such as cracks. Additionally, un-damaged samples consistently showed Tc values near 39 K and normal state resistivities in the 0.2-0.4 cm range, values in agreement with previously published results 22 ; 730 , suggesting the effect is the result of the irradiation and post-exposure annealing process. Such an anomalous increase in resistivity as a function of annealing temperature was also observed in the case of neutron irradiation on carbon doped MgB2 wire segments 991 . The initial annealing may result in a change in the defect structure. For example, vacancies don’t necessarily immediately recombine with interstitials to eliminate defects. Vacancies can initially cluster together to form higher order defects, which can be relatively stable 24 . Thus the initial increase in resistivity may result from a reorganization of defects into higher order clusters which may enhance scattering.
Insight into the nature of the defects can be obtained by tracking changes in the parameter =(300 K)-(40 K). Figure 3d plots as a function of the transition temperature. decreases monotonically as a function of the transition temperature. This result is in contrast to the results of He ion irradiation on MgB2 thin films 476 , but in agreement with the predictions of Mazin et al. 1215 , who claimed that as a material is driven into the dirty limit, the conductivity in the pi band decreases, causing normal state electric transport to switch from the pi to the sigma band. Indeed, for the extreme clean and extreme dirty limits they obtain values ranging from near 10 to near 35 cm respectively, consistent with our experimental observations of 6 and 35 cm.
An alternate framework for understanding this monotonic change in is to recall that the sample is polygrain with random orientation of the crystallites. Given that the electrical resistivity of MgB2 is anisotropic to start with, combined with the fact that damage appears to more aggressively affect the -axis periodicity, it is possible that for lower values an increasing number of grain orientations will present high resitivity paths to the current. This will effectively reduce the cross sectional area of the wire sample. This would result in a similar behavior to what has been found for samples that have either poor connectivity or gross impurities on the grain boundaries 1216 .
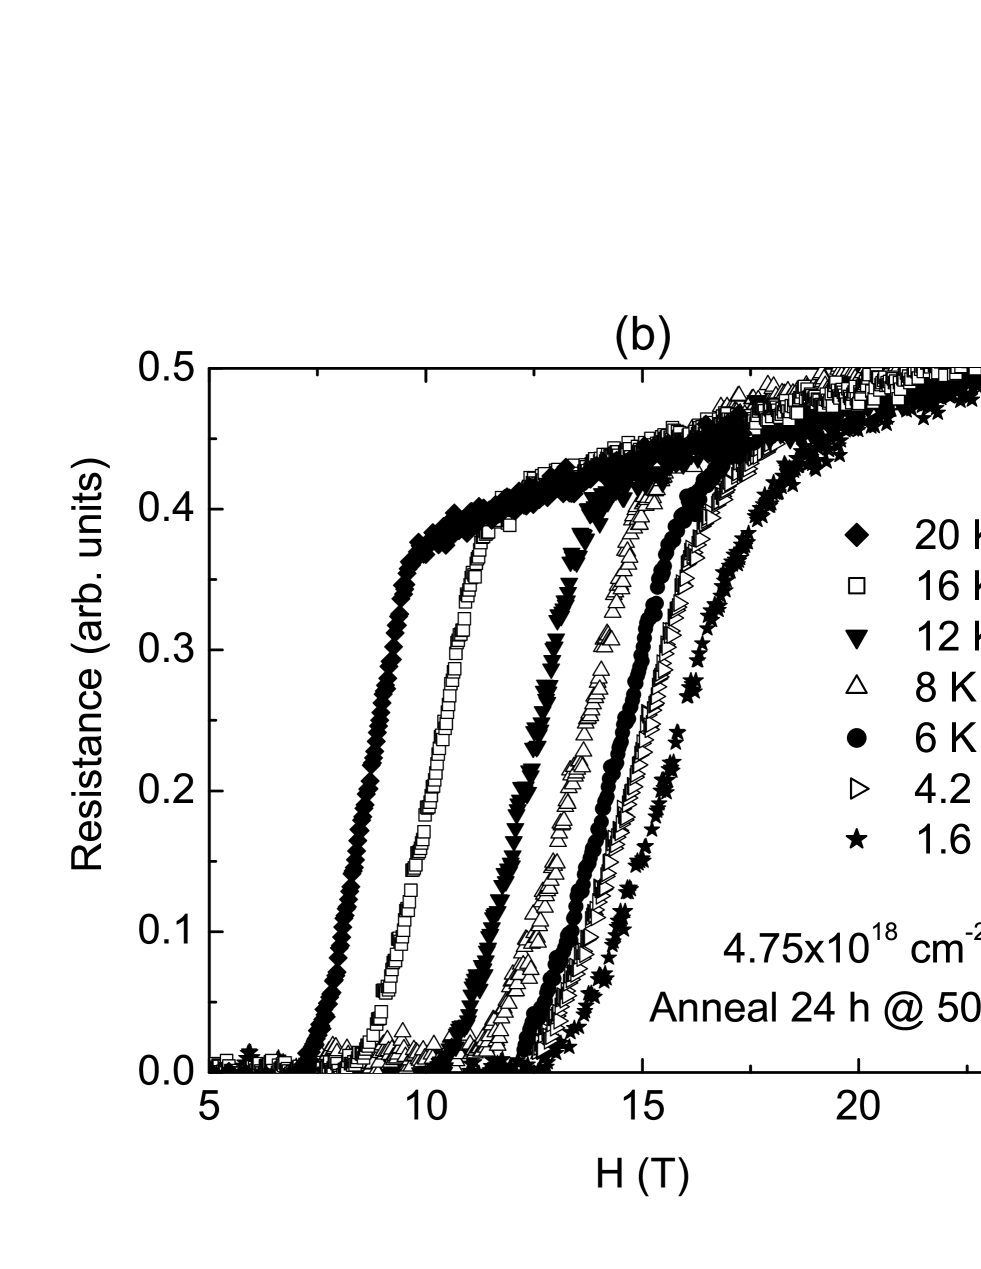
The upper critical field was determined using an onset criteria in resistivity versus temperature in applied fields up to 14 T (a representative set is shown in figure 5a) and, in the case of the 500oC anneal, resistance versus field sweeps up to 32.5 T (Figure 5b). The upper critical field curves nest, forming a sort of Russian doll pattern, with Hc2(T=0) approximately scaling with Tc (Figure 6). The curves for samples annealed at temperatures up to 200oC do not show any positive curvature near Tc and are qualitatively similar to single gap superconductors with Werthamer, Helfand, and Hohenberg (WHH) 25 like behavior. Experimentally determined Hc2(T=0) values for the 150oC, 200oC, and 300oC anneals are 2.9 T, 4.7 T, and 7.3 T respectively. Using the formula Hc2(T=0)=0.69TcdHc2/dT we obtain estimates of 2.9 T, 4.3 T and 5.9 T. Thus whereas only in the cases of the 150oC and 200oC anneals we can fit Hc2(T) with WHH behavior, the deviations increase with the annealing temperature, suggesting that the bands may become fully mixed only when Tc is suppressed to near 10 K. Single gap behavior has been inferred from specific heat measurements on irradiated samples containing isotopically enriched 11B which had Tc near 11 K 1218 . The 300oC, 400oC, and 500oC anneals exhibit positive curvature near Tc that is similar to what is found in pure MgB2. The 500oC anneal data show that either the undamaged H is restored or that there a slight increase in Hc2(T=0), rising from approximately 16 T in the undamaged case to near 18 T.
This behavior in Hc2 differs from other types of neutron damaging studies. For the case of irradiating isotopically enriched Mg11B2. Putti et. al found a fairly substantial increase in Hc2 values when Tc was in the 36-38 K range 18 . For a sample with Tc = 36.1 K, they report Hc2(T=12K) of 20.3 T. For unshielded irradiation of MgB2 containing natural boron, Eisterer et. al reported that, relative to an undamaged sample with a Tc just below 38 K, a sample with a suppressed Tc of approximately 36 K had a near doubling of the slope dHc2/dT in the linear regime above 2 T 15 . In both of these cases the fluences used were an order of magnitude lower than in our experiment and no post exposure annealing was performed.
Figure 7 presents the critical current densities for the series of 24 hour anneals at 5 K and 20 K as determined by the Bean critical state model 23 from magnetic hysteresis loops. At both 5 K and 20 K, Jc is suppressed for samples annealed at 300 oC and below, presumably due to the larger reduced temperature (T/Tc) of the measurements. In field Jc values become enhanced at both 5 K and 20 K for the 400 oC and 500 oC anneals, and show a slight fishtail or second peak behavior. This is believed to be the first time such behavior has been observed in polycrystalline samples. The fish tail effect has been seen in fast neutron irradiation of MgB2 single crystals 19 . The authors report a second peak in the magnetization hysteresis loops for Hab, which became more pronounced with increasing fluence up to cm-2. No second peak was observed for Hab. Low level thermal neutron fluence, of order 1014-1015 cm-2, of polycrystalline MgB2 showed an enhancement in flux pinning, but no second peak or fishtail behavior 16 . The infield enhancement of Jc for the sample annealed at 500oC pushes the point at which Jc crosses 104 A/cm2 at 20 K out to near 1.5 T. This increase in field roughly doubles the crossing point of the undamaged wire, but falls well below best reports in literature of 104 A/cm2 at near 5 T reported for 10 weight percent addition of SiC to MgB2 27 .
Other authors have analyzed critical current densities in neutron irradiated samples using a percolative model that considers, as free parameters, the upper critical field, the absolute value of the critical current density, the anisotropy of the upper critical field, and the percolation threshold 1217 ; 1219 ; 1230 . In reference 1230 the authors extend the model to include different contributions from grain boundary and precipitate pinning. The model yields extremely good fits to the data, from which the authors conclude that the anisotropy of Hc2 heavily influences the field in which the material can carry large amounts of current 1217 ; 1219 and defects introduced by the irradiation process are responsible for the enhancement of the pinning strength 1230 . It is worth noting that these reports do not show the significant change in Jc(0) that we observe (Figure 7). Presumably two effects are causing the increase as a function of annealing temperature and hence Tc. In using the percolation model, each of the authors kept the percolation threshold fixed in the 0.2-0.3 range. If we are observing large changes in the connectivity in our samples as a function of annealing temperature, as inferred from the data, then the initial decrease in Jc(0), as observed in the low temperature anneals, is the result of the formation of weak links which limit the overall critical current density. As the annealing temperature is increased the connectivity between grains is improved, thereby returning Jc(0) towards the undamaged value. In the case of the 500oC anneal, Jc(0) exceeds that of the undamaged sample, suggesting that the defects which remain following post-exposure annealing act as effective pinning sites. If defects caused by irradiation are 0.1-10 nm in size, as reported in reference 1217 , then following the annealing process, many of the defects should be of order the coherence length 69 , making them effective flux pinning centers.
A plot of Jc as a function of reduced field (H/Hc2) shows that for the higher temperature anneals, the fraction of Hc2 in which samples can maintain in excess of 103 A/cm2 is greatly enhanced (Figure 7c and 7d). Such enhancement is consistent with an increase in the strength of defect pinning 1230 . That the low temperature anneals all show Jc dropping below 103 A/cm2 at similar reduced field values suggests the defects are ineffective in enhance critical current densities in highly disordered samples. This could be the result of, for example, overlap of defects, making them to large to be effective flux pinning sites.
III.3 Variable Time Anneals on Samples Exposed to a Fluence of cm-2
The annealing time for the set of cm-2 fluence samples was varied to further probe the characteristics of damage induced by neutron irradiation. An extensive set of anneals was carried out at 300oC, consisting of 1/3, 1, 3, 6, 24, 96, and 1000 hours. For annealing temperatures of 200oC and 400oC, measurements were done on 1, 24, and 96 hour anneals. Two anneals were performed at 500oC, one for 24 hours and the other for 1000 hours.
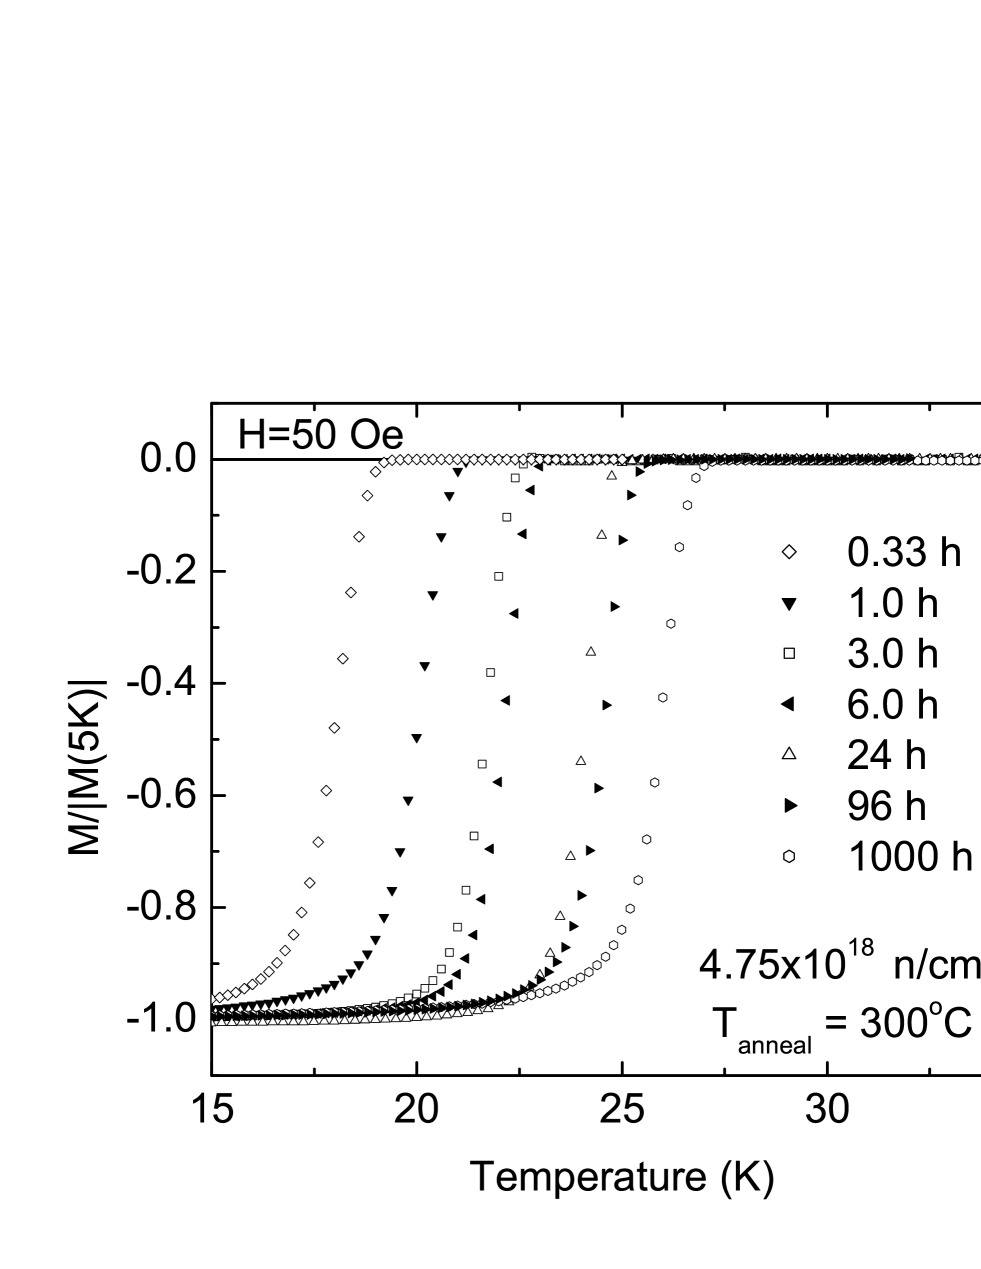
The magnetic transitions for the entire set of samples annealed at 300oC are shown in figure 8. Annealing at this temperature for only 0.33 hours raised Tc from below 5 K to slightly above 19 K. Therefore, the defects causing the suppression of superconductivity must have a fairly low activation energy. For defects which can be annealed by a single activated process with a constant activation energy, the rate of change of the defect concentration is given by 24 :
| (2) |
where is the defect concentration, is some continuous function of , is a constant, is the activation energy, is Boltzman’s constant, and is the temperature. If we assume random diffusion, then , and the defect concentration decreases exponentially with time:
| (3) |
where is the initial defect concentration, is a rate constant, and is time.
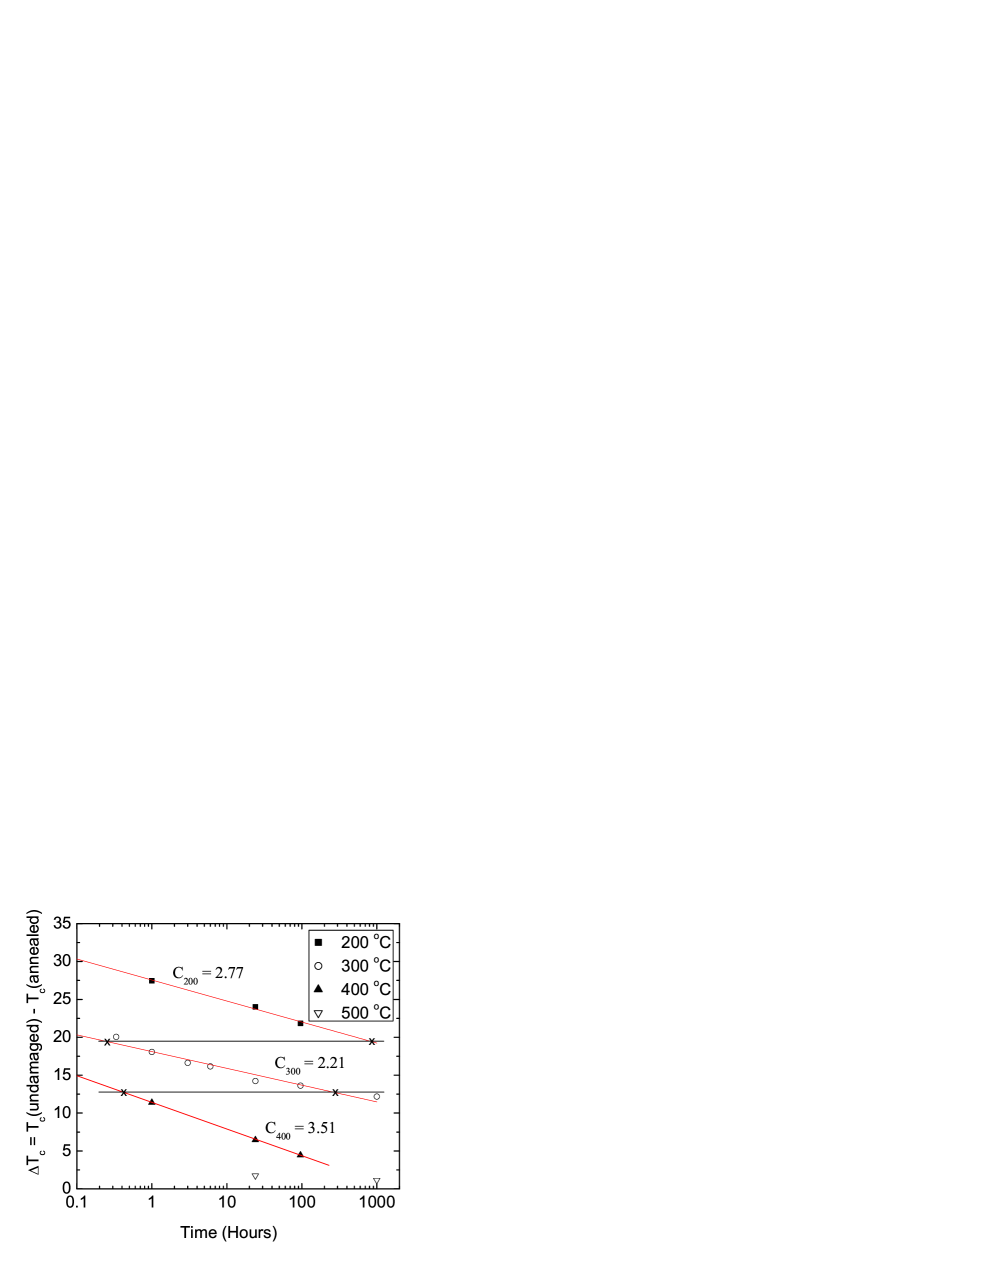
While can be taken as one measure of the defect concentration, we have already shown non-monotonic behavior in as a result of the annealing process. Another variable that can be used to defect concentration is , which systematically varies with both annealing temperature and annealing time. We therefore take as a measure of the defect concentration, although it should be reiterated that the nature of the defects may be changing as we increase the annealing temperature and time. Such linearity is not uncommon and can be related to Abrikosov-Gorkov-like theory of pair breaking in anisotropic superconductors. igor It should be noted, though, that we do this simply in an attempt to extract an approximate value of the activation energy.
We see a exponential decay behavior in for samples annealed at 200oC, 300oC and 400oC (Figure 9). Since we only have two samples annealed at 500oC, which are longer time anneals and thus presumably would fall further out on an exponential tail, we can not extract a meaningful value from an exponential fit of these data. For samples which do show an exponential behavior in the decrease of (and by presumption) the defect density as a function of annealing time the activation energy, assuming a single activation process, can be determined by the so-called cross-cut procedure 24 . This involves comparing the annealing time for which different temperature anneals reached the same defect density, i.e. . If a is reached by annealing at a temperature for a time and by annealing at a temperature for a time , then the activation energy is related to these quantities by:
| (4) |
Unfortunately, no overlap region in exists for our set of data. To achieve an overlap region in the experimental data we’d need to shorten the annealing times below 0.33 hours or extend them to well beyond 1000 hours. Short time anneals, less than 0.33 hours, are not feasible as we’d be unable to ensure thermal equilibrium of the samples within the furnace for such a short time. Extending the annealing an additional order of magnitude, to 104 hours, is simply not practical. We can still estimate the activation energy by extrapolating the curves at each temperature to shorter and longer times so as to create overlap regions (Figure 9). Calculating from the overlap between the 200oC and 300oC curves and between the 300oC and 400oC curves yields values of 1.90 eV and 2.15 eV respectively.
An alternative approach to determining the activation energy is to use the ratio of slopes method 106 . Experimentally a set of samples is annealed isothermally for different times at a temperature and an identical set of samples is annealed at a different temperature . The differing temperatures result in different time evolution of , and hence, different slopes, . The ratio of the slopes for the two different temperatures at the point where both annealing temperatures have yielded the same , is related to the activation energy by:
| (5) |
where the subscripts 1 and 2 refer to temperatures and . By comparing the slopes from the 200oC and 300oC anneals and those from the 300oC and 400oC anneals, we obtain estimates of 1.07 eV and 1.63 eV, respectively. It should be noted that, while these estimates were made using real data, rather than extrapolations as in the previous calculation, there is inherent inaccuracy in such a calculation due to the lack of a true overlap in . Additionally, the low density of data points limits our ability to accurately determine the linear slope from the versus time curves where tends to decay exponentially.
Depending on the calculation method and data set used, we obtain activation energies ranging from 1.07 eV to 2.15 eV. It is likely that some of the variation is real, as, in these heavily damaged samples, there exist both point defects and defect complexes. The annealing of point defects is expected to have a lower activation energy than the dissolving of the defect complexes. While we can not assign definitive values for the activation energies of these two processes, merely stating a single activation energy hides some of the rich complexity underlying the annealing process in these heavily damaged samples. It should be noted that the activation energies in these neutron irradiated MgB2 samples are the same order of magnitude as those for annealing quenched in defects out of gold 106 . That our samples yielded a relatively small spread in activation energies and were comparable in magnitude to values associated with the annealing of simple defects in other metals suggests the defects within the neutron irradiated MgB2 samples are being annealed by single activation processes.
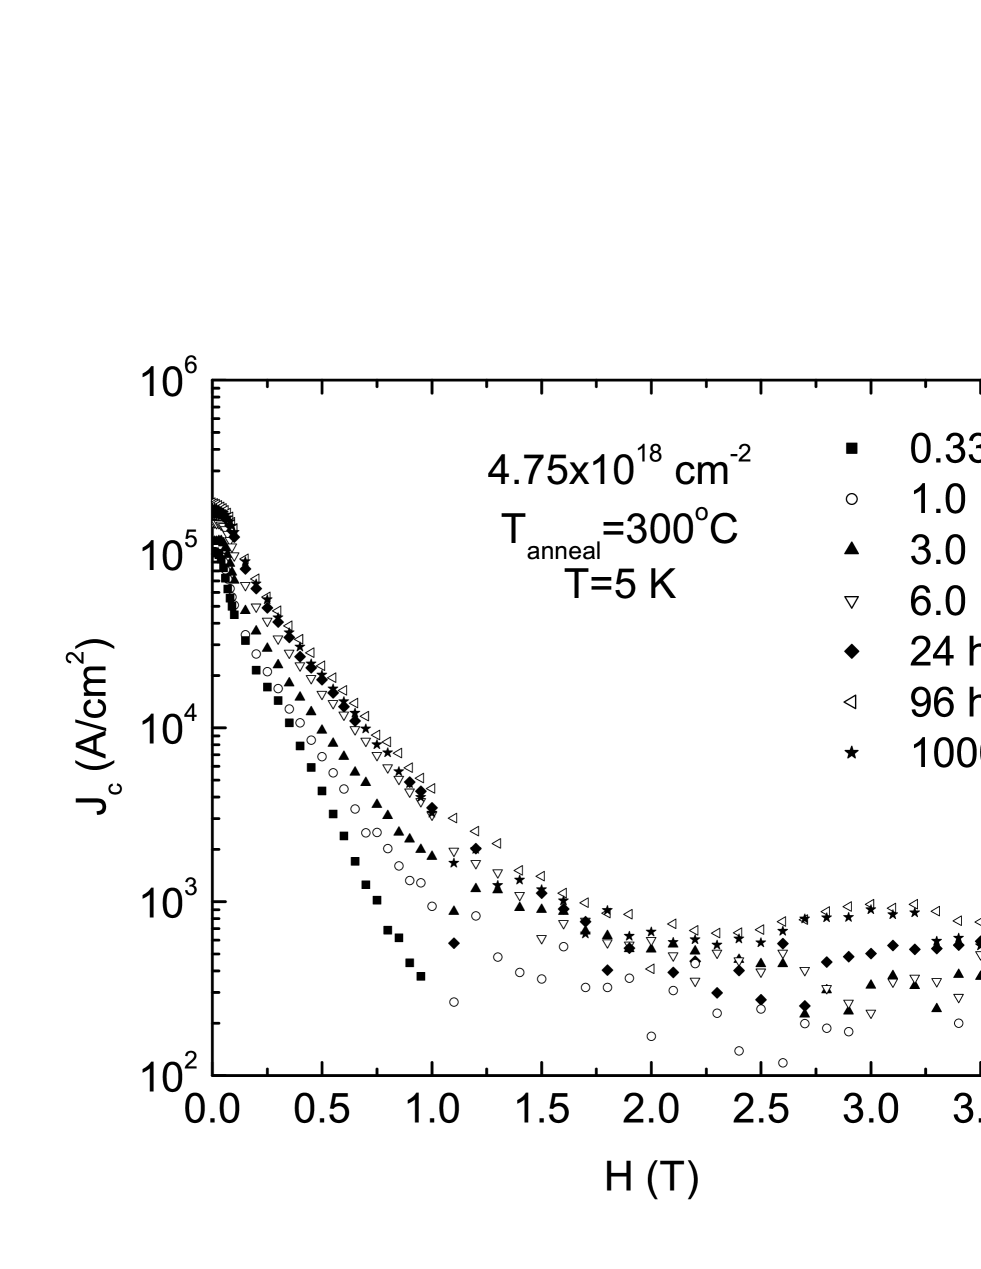
For the set of wires annealed at 300oC, critical current densities at K and low fields approximately scale with annealing time and hence (Figure 10). The field at which drops below 104 A/cm2 increases by approximately a factor of two when the annealing time is increased from 1 hour to 24 hours. Extending the annealing time further to 1000 hours has little effect on low field values. For annealing times of 6 hours and shorter (for the sake of clarity, data for 1/3, 3, and 6 hours are not shown) was found to monotonically decrease as a function of applied field. After a 24 hour anneal, begins to flatten above 3 T at a value of approximately 500 A/cm2. Extending the annealing time to 96 and 1000 hours results in the emergence of a clear second peak at an applied field slightly above 3 T. The curves for the 96 and 1000 hour anneal are virtually identical and reflect the small 1.5 K or 6% increase in Tc resulting from the order of magnitude longer annealing time.
III.4 Variable Fluence Levels, 24 Hour Anneal
We annealed samples from each of the damaged levels for 24 hours at 200oC, 300oC, 400oC, and 500oC. The (002) and (110) x-ray peaks for samples of all four damage levels annealed at 300oC for 24 hours are given in figure 11. Annealing at 300oC for 24 hours did not restore long range order along the c-axis in the samples exposed to the two highest fluence levels of cm-2 and cm-2. For these 24 hour anneals, up to an annealing temperature of 400oC the (002) peak maintains a FWHM above 1o, which corresponds to a structural coherence length of approximately 1000 (Figure 12). Using Hc2(T=0) to determine the supercoducting coherence length, one obtains for pure MgB2 a superconducting coherence length near 50 69 . Measurements on the coherence length within the band only yield a larger value of approximately 500 823 . While there is shorter range structural order along the c- direction in these heavily irradiated samples, the structural coherence length is still at least a factor of two larger than the superconducting coherence length, regardless of the estimate of the superconducting coherence length used. It is therefore not unexpected that superconductivity exists in samples with degraded long range order. Only after the temperature reaches 500oC does the correlation length along the c- direction exceed 1000 (Figure 12). The relative shift of the a- and c- lattice parameters for the various heat treatments is plotted in figure 13.
Magnetization measurements were performed on all of the annealed samples (Figure 14a). It should be noted that for the fluences greater than cm-2, as damaged samples showed no signs of superconductivity down to 2 K. A summary of the transition temperatures for each of the annealed samples, given in terms of , is plotted in figure 14b. In general terms, the higher fluence levels lead to lower superconducting transition temperatures for a given temperature post-exposure anneal. For a given fluence level, higher annealing temperatures yield higher Tc values. That is, the samples exposed to higher fluence levels behave in a qualitatively similar manner to lowest level, but the added exposure leads to increased defect densities which manifest themselves in terms of lower transition temperatures for a given annealing profile.
III.5 Long Time Annealing Studies
The conversion of 10B to 7Li through neutron absorption and subsequent alpha decay introduces the possibility of observing the effects of lithium doping MgB2. In order to distinguish the effects of Li doping from those associated with structural defects introduced through inelastic collisions between neutrons and the underlying lattice it is necessary to minimize the density of these defects. As shown, by annealing for long times at high temperatures the number of structural defects can be systematically reduced. Since Li can’t be annealed away, the resultant superconducting and normal state properties should increasingly reflect the effects of Li doping. The density of Li atoms produced through the transmutation of boron can be estimated from the formula 99 :
| (6) |
where is the density of Li atoms, is the density of B atoms, is the absorption cross section, and is the fluence level. Computing the corresponding atomic percentages yields an increase from 0.37% to 1.48% as the fluence in increased from cm-2 to cm-2 (Table 1).
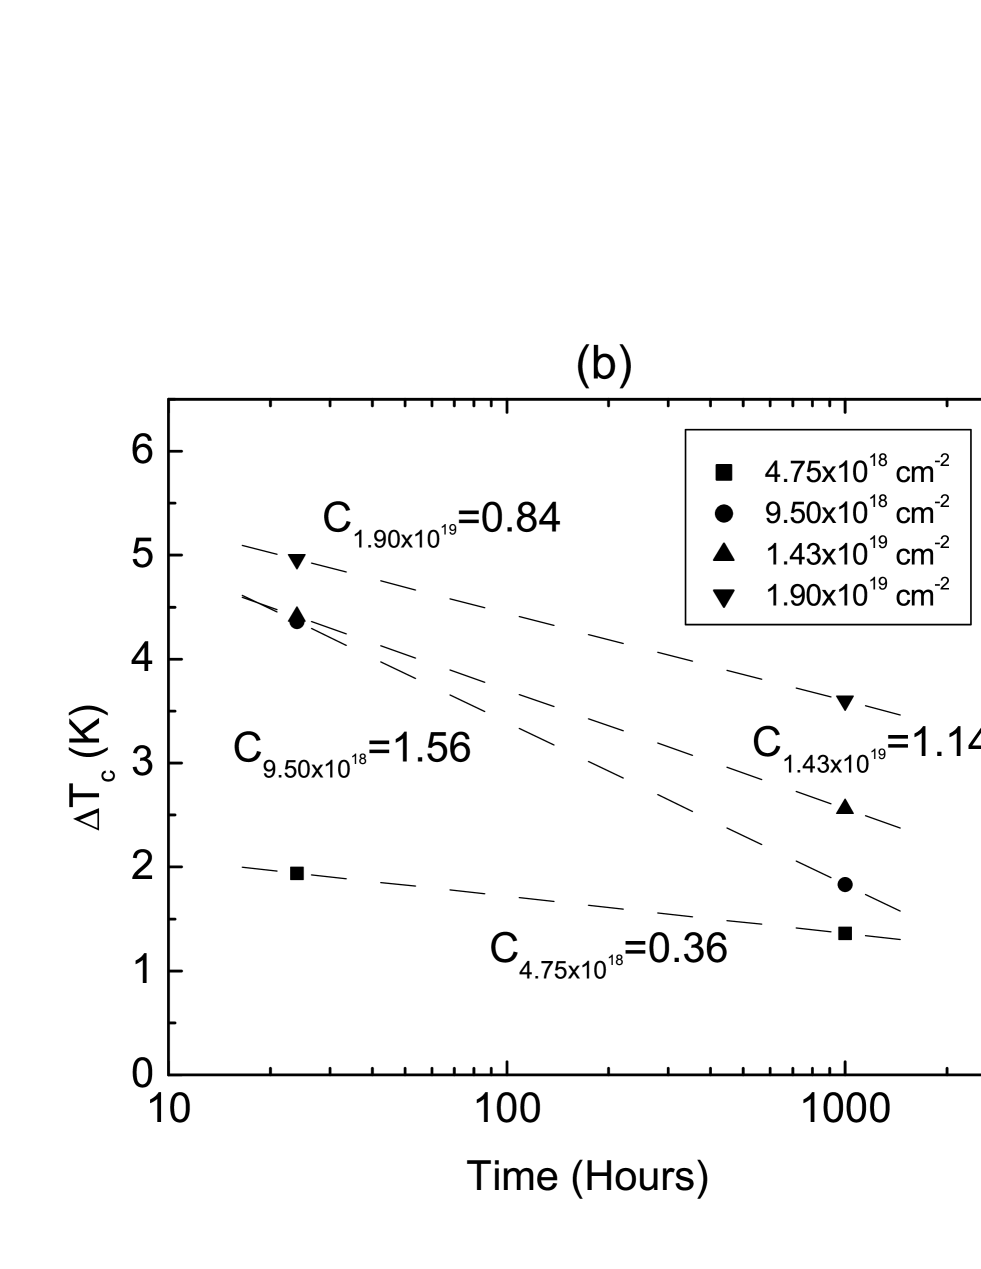
We therefore annealed all four of the damage levels for 1000 hours at 500oC. Normalized magnetization curves for this series are plotted in figure 15a. In each case the transition temperatures have increased relative to samples annealed at 500 oC for 24 hours as can be seen by plotting versus time (Figure 15b). Using a linear fit on the semi-log plot, the resultant slopes are much lower than was seen for the cm-2 fluence level samples annealed for various times at 200oC, 300oC, and 400oC (Figure 9), indicating is beginning to saturate above 24 hours. Since we don’t have any intermediate time points, we can’t determine if we’ve achieved fully saturated values at 1000 hours, but we can take the 1000 hour anneals at 500oC as an upper limit on the effects of lithium doping.
Transport measurements were performed in order to determine the normal state resistivity and temperature dependance of for these samples. We were unable to contact the samples exposed to the two highest dose levels. The normal state resistivity (T=40 K) for the sample exposed to a fluence of cm-2 and annealed for 1000 hours was approximately 5.3 cm, which is more than three times the 1.6 cm measured on the sample annealed for 24 hours. The 1000 hour anneal sample also had a lower residual resistivity ratio (RRR), 3.3 versus 5.9, indicating the increase in isn’t merely an artifact associated with possible geometric effects (cracks within the sample). The cm-2 fluence level sample, which was annealed for 1000 hours, had a normal state resistivity of 6.6 cm and RRR=5.0. Karkin et al. saw increases in for annealing temperatures above 300oC, which they attributed to changes in inter-grain transport 14 . It is possible that by annealing at an elevated temperature for 1000 hours we have degraded the inter-grain connectivity in some fashion, leading to the observed increases in resistivity.
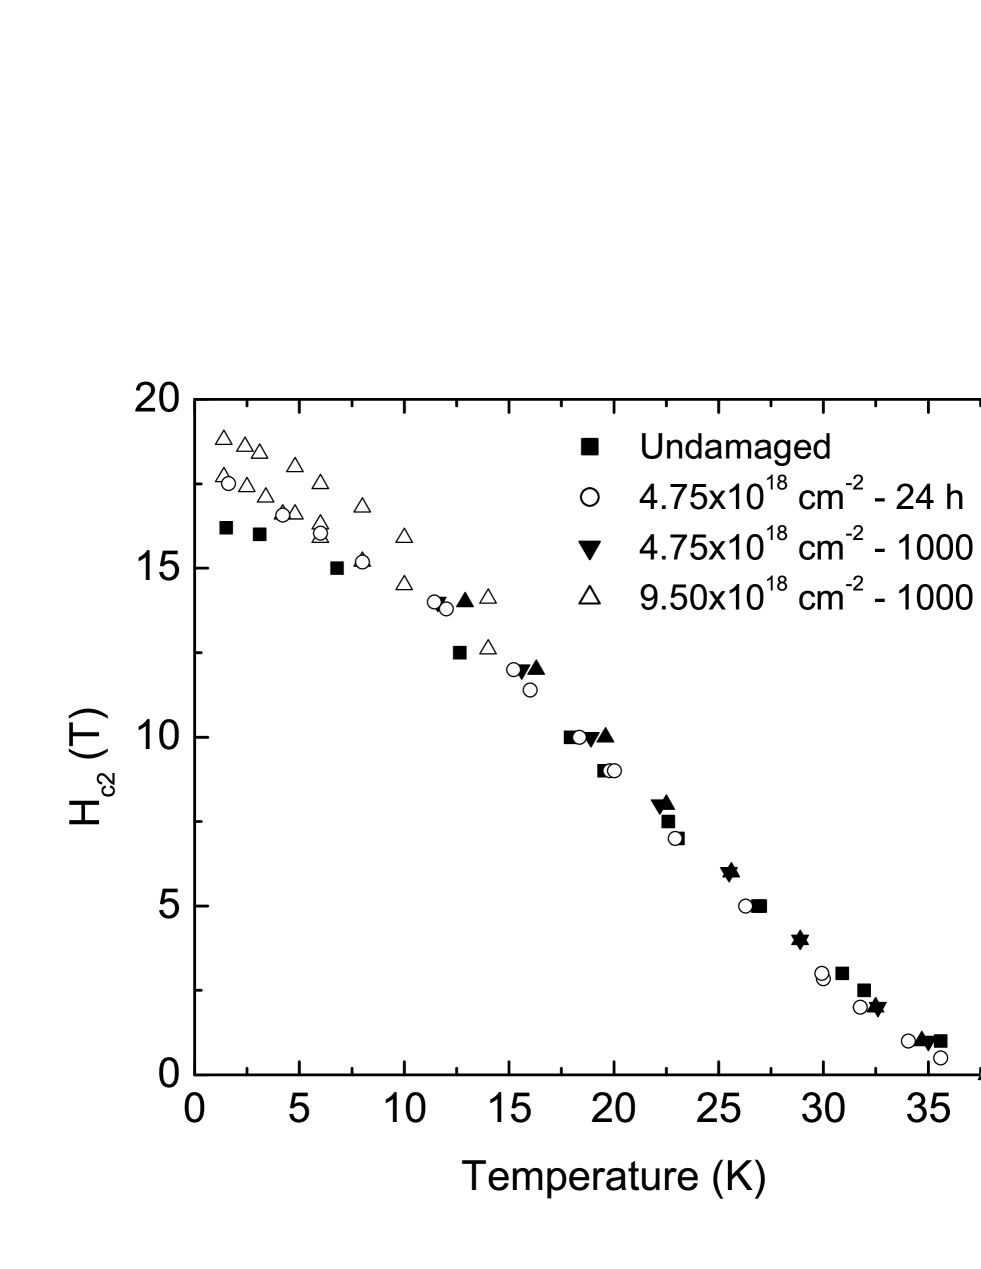
The temperature dependance of Hc2 is plotted in figure 16. It was found that for the cm-2 fluence level (T) data for a 1000 hour anneal sample was comparable to that of the 24 hour anneal sample, both showing possible, slight enhancement relative to the pure sample. In the case of the 1000 hour anneal on the cm-2 fluence level, Hc2 had some spread in the data, but extrapolated to 18-19 T at zero Kelvin. The upper critical fields of the two lowest fluence levels annealed at 500oC for 1000 hours appear to be similar, with slight differences arising due to inherent sample to sample variation.
IV Discussion
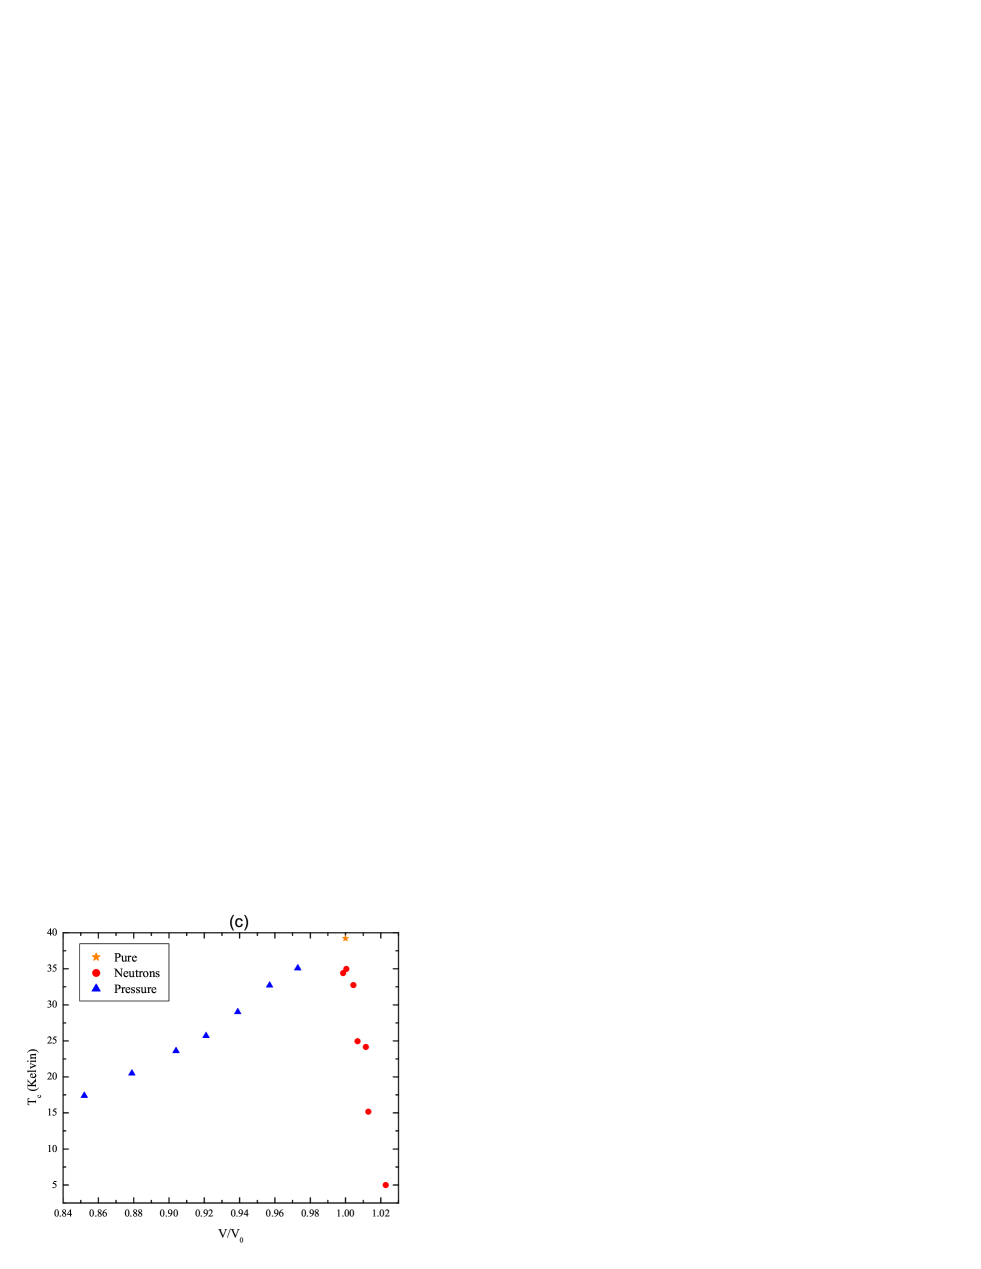
The initial irradiation of MgB2 wire segments results in an increase in the size of the unit cell and suppression of the superconducting transition temperature. Post exposure annealing tends to return both the lattice parameters and Tc towards their undamaged values. If the superconducting properties of the neutron irradiated samples were purely a result of changes in the unit cell dimensions, correlations should exist between the superconducting properties of neutron irradiated MgB2 and pure MgB2 placed under external pressure. Since an expansion is qualitatively analogous to an effective negative pressure one would anticipate the the changes in Tc to be an extension to negative pressure of the results attained for the application of positive pressure. Application of external pressure has been shown to compress the unit cell and suppress Tc 34 . Thin films grown epitaxially on (0001) sapphire substrates exhibited an enhanced Tc above 41 K which was attributed to tensile strain 35 . In the case of neutron irradiated MgB2, the expansion of the lattice parameters coincides with a decrease in Tc and the evolution of Tc as a function of a, c, and V/V0 behaves differently than MgB2 under pressure (Figure 17). In the case of externally applied pressure, it is believed that the changes in the frequency of the E2g phonon mode are responsible for the suppression of Tc 34 ; 36 . With such dramatically different behavior between the neutron irradiation and pressure results, it is clear that the changes in Tc can not simply be linked to changes in the unit cell volume.
In addition to the structural changes, neutron irradiation also introduces a chemical impurity into the system through the 10B neutron capture and subsequent alpha decay to 7Li. The amount of lithium produced in this manner is, however, quite small and for all but the 1000 hour anneals at 500oC, we can not sort the possible effects of such from the effects of the structural perturbations. The atomic percentage of B converted to Li through nuclear processes for all four exposure levels is estimated to be on the order of 1% (Table 1). Therefore, for lower temperature and/or shorter time anneals the effects of Li production are presumably insignificant next to the changes resulting from structural damage caused by inelastic collisions between the fast neutrons, emitted alpha particles, and recoiled 7Li atoms and the underlying lattice. It is worth noting, though, that whereas low level Li substitution for Mg was proposed as a possible route to increasing Tc 84 , our data show suppressed Tc values for our 1000 hour annealed samples. This does not preclude the possibility that Li substitution could, under other circumstances, raise Tc, but it certainly does not support it. It should be noted though that this form of lithium doping is far from the ideal one. In the case of transmutation of 10B the resulting sample is MgLixB2-x with boron vacancies and no clear site for the lithium. The more desirable form of lithium doping is Mg1-xLixB2 with the lithium substituting for the magnesium and no disruption of the boron sublattice.
The samples annealed at 500oC for 1000 hours suggest that at low levels, Li doping has little or no effect on . The cm-2 fluence sample has twice the amount of Li of the cm-2 fluence sample, yet their (T=0) values are approximately equal and only slightly differ from the un-damaged case. If the 18 T Hc2 value seen for the cm-2 fluence level is truly a 2 T enhancement relative to the un-damaged sample and is the result of Li doping, then we would expect the cm-2 fluence level to exhibit a near 20 T, which we did not observe. Since we can not insure that we have fully annealed out all of defects, it is possible that this slight increase in is a result of scattering associated with structural defects. In this case should be determined more by than by the particular fluence level or post exposure annealing profile. The values for the cm-2 fluence level annealed at 500oC for 24 and 1000 hours and that of the cm-2 fluence level annealed at 500oC for 1000 hours are all within half a degree of one another. This suggests that is controlled more by scattering associated with residual defects rather than any inadvertent Li doping. Since these low levels of Li do not appear to have any major impact on the superconducting properties, we can limit the discussion to possible influences of disorder, scattering, and possible changes in the Fermi surface.
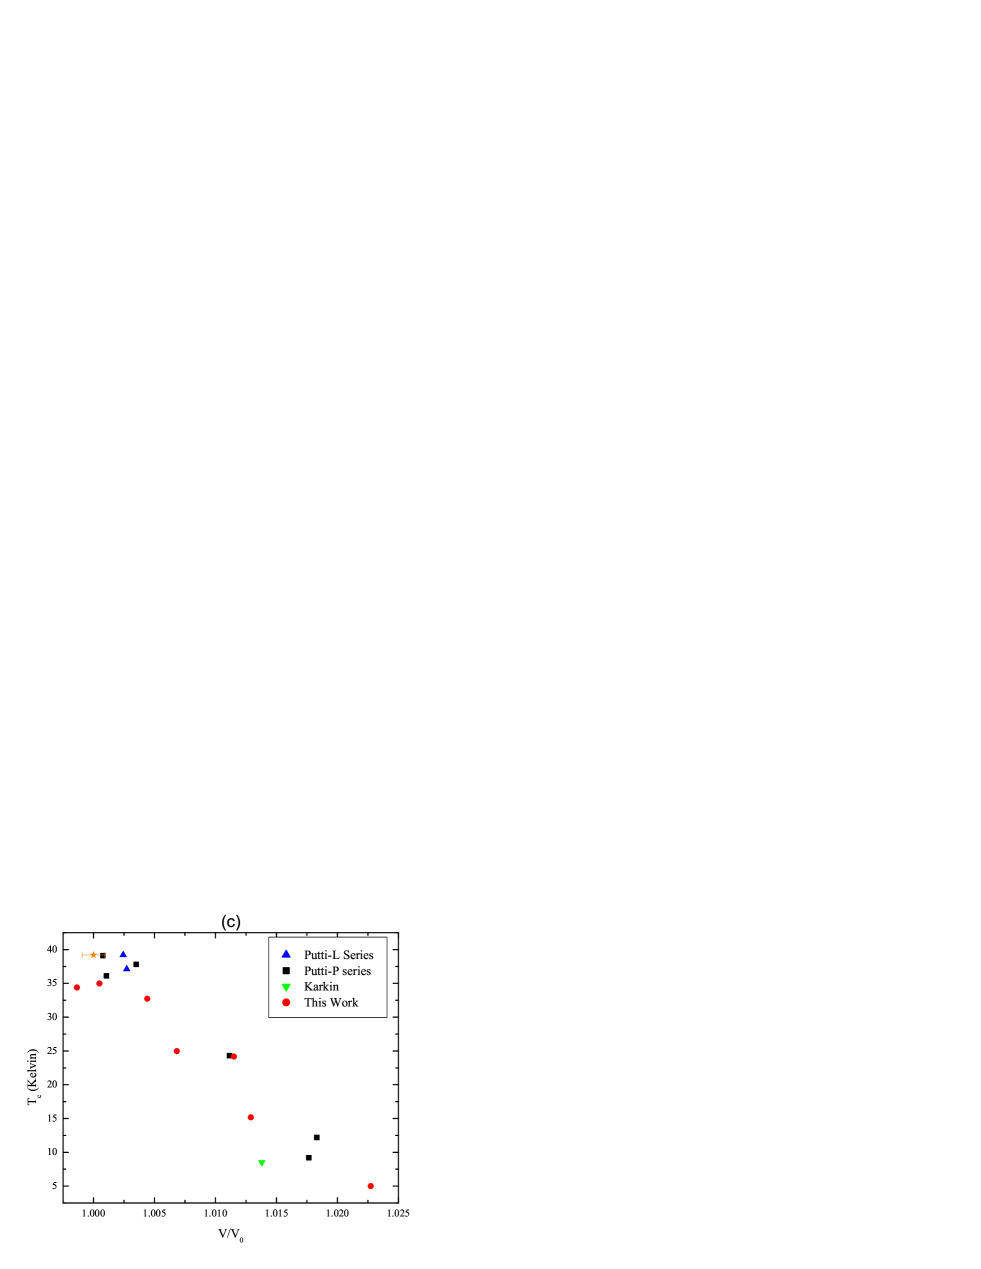
The evolution of the superconducting transition temperature as a function of the unit cell dimensions (a, c, and V/V0) shows definite trends and is in good agreement with the results of other neutron irradiation studies 14 ; 20 (Figure 18). Although there is considerable spread in the data, all three reports show that Tc tends to decrease with both a and c and hence V/V0. These data show that, for neutron damaged samples, there is some correlation between the unit cell dimensions and the superconducting properties. They do not, however, uniquely determine if the changes are a result of changes in the Fermi surface, perhaps due to a repositioning of the atoms, or if they are due to an introduction of additional scattering centers. In the case of substantial neutron irradiation induced damage, where Tc is below 10 K, NMR measurements indicate the suppression of superconductivity is the result of a decrease in the density of states of the boron px,y orbitals 29 . This technique has been successful in experimentally determining a decrease in the density of states in Mg1-xAlxB2 and AlB2 30 ; 31 . It should be noted however, that measurements of the nuclear spin relaxation rate, T, on 11B yielded comparable T1T values, which are directly related to the density of states at the Fermi surface, for both a neutron irradiated sample which had a Tc near 7 K 29 and a sample with 30% aluminum substituted for magnesium which had a Tc near 25 K 30 . That the neutron damaged sample exhibits a dramatically lower Tc despite having virtually the same density of states at the Fermi surface suggests additional mechanisms act to suppress superconductivity in neutron irradiated MgB2. This notion is supported by the fact that for the 24 hour anneals at 300oC, 400oC, and 500oC, the relative changes in the lattice parameters are fairly small. This should only contribute to minor changes in the Fermi surface, yet Tc is suppressed to near 25 K in the case of the 300oC anneal.
Although there exist correlations between our data and literature reports on the evolution of Tc and the lattice parameters, the evolution of varies depending upon the irradiation conditions. This present work on heavily irradiated MgB2 containing natural boron followed by post exposure annealing led to little or no enhancement of the upper critical field. In contrast others have reported enhancements of for low fluence levels on MgB2 containing either natural boron or isotopically enriched 11B 15 ; 18 as well as fast neutron irradition of natural boron containing MgB2 1217 .
In order to better understand this conspicuous difference it is useful to review what happened during damage and subsequent annealing. When a neutron capture and subsequent alpha decay event occurs, the resultant damage is a large cluster of dislocations. Primary knock-on events cause a cascade of displacements which can be spread over a distance as large as a hundred atomic distances 24 .
As mentioned previously, suppression in as damaged samples containing natural boron is much more rapid than those with either isotopically enriched 11B or those which have been shielded from low energy neutrons. Therefore it is presumably the clusters associated with the neutron capture event which are primarily responsible for the suppression of . These clusters presumably have low activation energy and can be largely repaired by the annealing process, which explains why we saw such a rapid increase in for short time and low temperature anneals. In order to see an enhancement in we need to anneal for a sufficient time and temperature so as to increase to a level where we aren’t being limited by a low transition temperature. Since the defect clusters from the alpha decay of 11B to 7Li are presumably large, and we are relying on random diffusion to recombine vacancies and interstitials, higher reaction temperatures are necessary to restore .
By going to higher annealing temperatures we begin to repair defects with higher activation energies. Therefore, regardless of the actual energy associated with repairing the defects responsible for the enhancement of , we are most likely annealing many of them away while restoring .
If it is these defects which are responsible for enhancement then it is the annealing process which causes the different development of we observe.
Based on this analysis it seems likely that a study of wire samples that have been exposed to much smaller fluences of neutrons (e.g. an exposure level that yields as damaged samples with a transition temperature in the range 30 37) should yield different, and higher, data.
The transmutation of 10B following the absorption of a neutron results in the emission of an alpha particle of energy 1.7 MeV, which is quite comparable in energy to the 2 MeV He ion irradiation of MgB2 films done by Gandikota et al. 476 ; 477 . One might therefore expect rather similar results between the two studies. Comparison of the results indicates these two different types of irradiation give rise to different superconducting and normal state properties. Gandikota and coworkers irradiated with heavy ion fluences up to cm-2, which was sufficient to suppress to below 5 K 476 . Unlike the case of heavy neutron irradiation presented here, He++ irradiation led to a slight enhancement in for samples exposed to lower fluence levels, where was only suppressed by a few degrees 477 , analogous to the results obtained for lower fluence level neutron irradiation 15 ; 18 . did tend to scale with for samples with below 30 K and, as with neutron irradiated samples, begins to exhibit more WHH like behavior when in the vicinity of 10 K. Additionally, could readily be restored by annealing at temperatures as low as 100oC 477 . However, x-ray measurements indicated that the He ion irradiation did not change the c-lattice parameter, even for the highest fluence level 476 . Thus, He++ irradiation presumably creates more point defects rather than large defect clusters which are likely to arise from neutron irradiation. He ion irradiation therefore presents yet another different avenue to systematically change the scattering levels in MgB2.
Damage induced by neutron irradiation is fundamentally different from doping with aluminum or carbon. Both carbon and aluminum enter the structure and are believed to act as point defects in addition to electron doping the system. Arguments based on the temperature dependence of the anisotropy of the upper critical field suggest both carbon and aluminum doping increase scattering within the band relative to the band, with the effect is much more pronounced in the case of carbon doping 7 . It should be noted that other researchers have concluded that changes in the temperature and magnetic field dependence of the thermal conductivity, (T,H), for carbon substituted single crystals are consistent with carbon doping resulting in an enhancement in intra--band scattering 1226 . Although there exists some debate as to the exact nature of the enhancement in scattering in carbon doped MgB2, it is clear that the development of Hc2 is dominated by scattering effects for carbon substitutions and and Fermi surface changes effects for aluminum substitution. For neutron irradiated samples, as discussed above, the effects of the introduction of Li through nuclear processes are negligible and the changes in the superconducting properties are due to an increase in interband scattering and a decrease in the density of states. Insights can be made into the effects of neutron irradiated samples by comparison to carbon and aluminum doping.
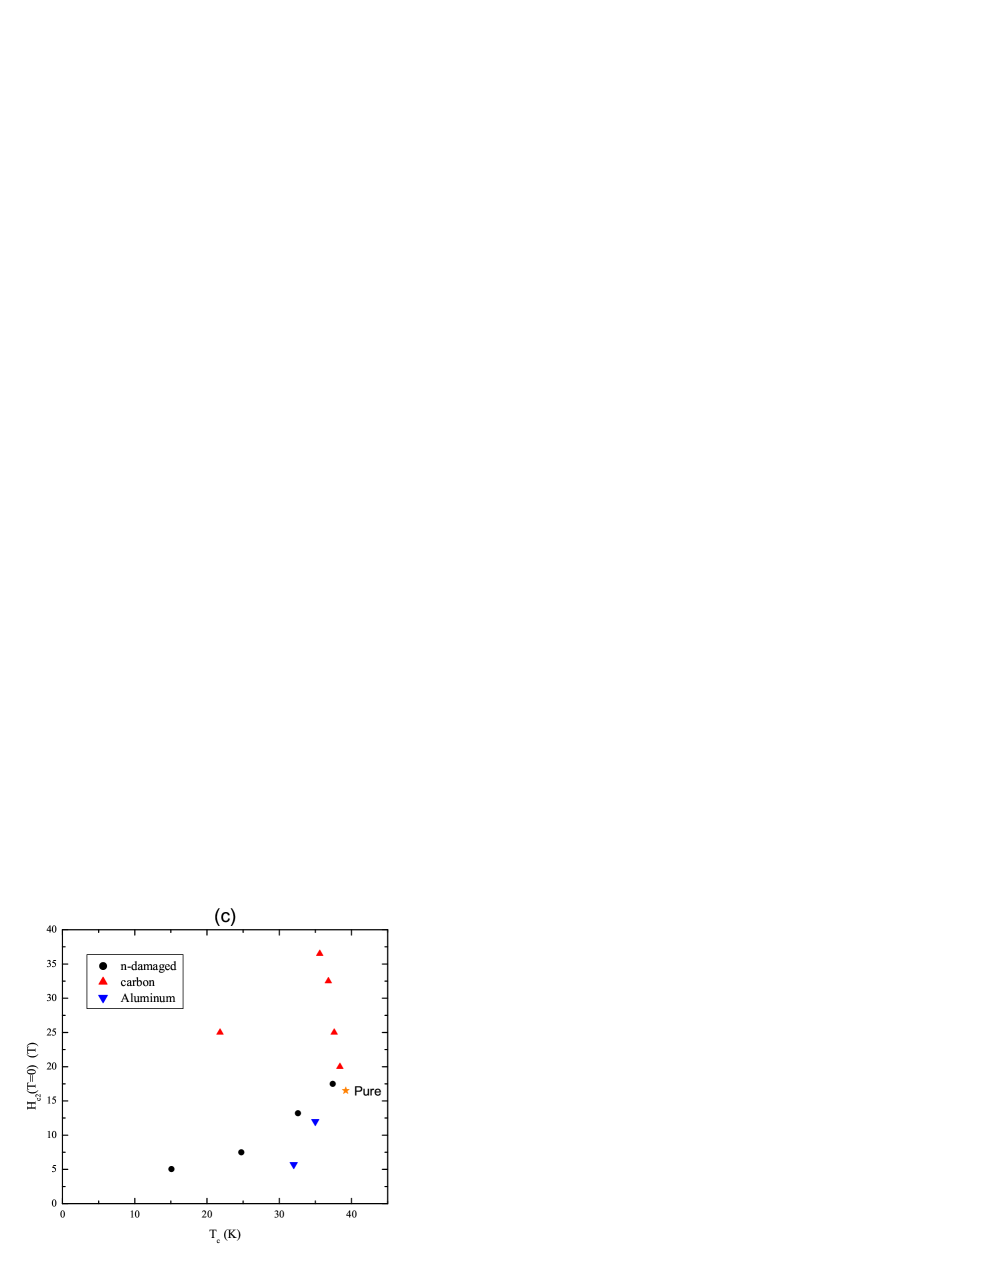
The different development of interdependencies of H, Tc, and in aluminum doped 9 , carbon doped 187 ; 188 , and neutron irradiated samples, those exposed to a fluence of cm-2 and annealed for 24 hours, are plotted in figure 19. Figure 19a shows the evolution of the transition temperature as a function of residual resistivity for these three types of perturbations. The suppression of with for low resistivity values is quite similar for the neutron damaged and aluminum doped samples; drops rapidly with increased scattering. In contrast, the suppression of as a function of resistivity in carbon doped samples is quite gradual. This is consistent with both aluminum doping and neutron damaged samples having more interband scattering than carbon doped compounds.
Figure 19b plots as a function of . Here all three perturbations behave uniquely. The aluminum and neutron damage samples show a decrease in , whereas the carbon doped samples show a dramatic increases. The decrease in is more rapid in the aluminum doped samples than in neutron damaged samples. This can also be seen by plotting as a function of (Figure 19c).
Direct comparison between the evolution of and for carbon doping and neutron irradiation shows the scattering associated with each type of perturbation is different. Within the model proposed by Gurevich 11 , enhancements in result from differences in the relative strength of scattering within each band, whereas the suppression of is a function of scattering between the bands. The neutron irradiated samples on these plots with a greater than 25 K are samples which were annealed at 300oC, 400oC, and 500oC. In each of these samples, annealing has reduced the a-lattice parameter to nearly the undamaged value (Figure 2b). With the defect structure lying between nearly undamaged boron planes, one would not expect the scattering within the band to be substantially affected. If the scattering was confined primarily to the 3-D band, the resultant differences in intraband diffusivity values should manifest themselves in terms of enhanced . Since no significant enhancement is seen, we believe the scattering is primarily interband scattering and contributes to the suppression of . The range in for in post exposure annealed samples (Figure 18c) supports the notion that neutron irradiation increases interband scattering.
The suppression in in neutron irradiated samples is the result of a combination of a decrease in the density of states at the Fermi surface and an increase in interband scattering. In the case of aluminum doping, the suppression of is believed to be primarily a result of a changes in the Fermi surface 7 . Samples of neutron damaged MgB2 exhibit higher values than aluminum doped MgB2 samples with similar values (Figure 19c). This suggests that, for neutron irradiated samples, changes in the density of states suppress to a greater degree than interband scattering.
V Conclusions
We systematically studied the effects of neutron fluence level, annealing temperature, and annealing time on the superconducting and normal state properties of MgB2. As damaged samples showed an anisotropic expansion of the unit cell and a suppression of to below 5 K. Defects introduced by the irradiation process had relatively low activation energy and hence much of the damage could be repaired by post-exposure annealing. values tended to scale with and the evolution of with was dramatically different than in the case of carbon doping. Lithium produced through nuclear processes appeared to have no significant effects on the superconducting properties. We attribute the changes in the superconducting properties of neutron irradiated samples primarily to an increase in scattering between the two bands and possible changes in the density of state at the Fermi surface.
VI Acknowledgements
Ames Laboratory is operated for the U.S. Department of Energy by Iowa State University under Contract No. W-7405-Eng-82. This work was supported by the Director for Energy Research, Office of Basic Energy Sciences. A portion of this work was performed at the National High Magnetic Field Laboratory, which is supported by NSF Cooperative Agreement No. DMR-0084173 and by the State of Florida.
References
- (1) J. Nagamatsu, N. Nakagawa, T. Muranaka, Y. Zenitani, J. Akimitsu, Nature (London) 2001 (410) 6824.
- (2) S.L. Bud’ko, G. Lapertot, C. Petrovic, C.E. Cunngingham, N. Anderson, and P.C. Canfield, Phys. Rev. Lett. 86 (2001) 1877-1880.
- (3) J. Kortus, I. I. Mazin, K. D. Belashchenko, V. P. Antropov, and L. L. Boyer, Phys. Rev. Lett. 86 (2001) 4656.
- (4) R.A. Fisher, G. Li, J.C. Lashley, F. Bouquet, N.E. Phillips, D.G. Hinks, J.D. Jorgensen, and G.W. Crabtree, Physica C 385 (2003) 49.
- (5) Physica C 385 (2003), edited by G. Crabtree, W. Kwok, S.L. Bud’ko, and P.C. Canfield.
- (6) R.J. Cava, H.W. Zandergen, K. Inumaru, Physica C 385 (2003) 8.
- (7) M. Angst, S.L. Bud’ko, R.H.T. Wilke, and P.C. Canfield, Phys. Rev. B 71 (2005) 144512.
- (8) B. Kang, H.J. Kim, H.S. Lee, S.I. Lee, and T. Dahm, cond-mat/0409496.
- (9) J. Karpinski, N.D. Zhigadlo, G. Schuck. S.M. Kazakov, B. Batlogg, K. Rogacki, R. Puzniak, J. Jun, E. Muller, P. Wagli, R. Gonnelli, D. Daghero, G.A. Ummarino, V.A. Stepanov, and P.N. Lebedev, Phys. Rev. B 71 (2005) 174506.
- (10) M. Putti, C. Ferdeghini, M. Monni, I. Pallecchi, C. Tarantini, P. Manfrinetti, A. Palenzona, D. Daghero, R.S. Gonnelli, and V.A. Stepanov, Phys. Rev. B 71 (2005) 144505.
- (11) R.H.T. Wilke, S.L. Bud’ko, P.C. Canfield, D.K. Finnemore, Raymond J. Suplinskas, and S.T. Hannahs, Phys. Rev. Lett. 91 (2004) 217003.
- (12) R. Puzniak, M. Angst, A. Szewczyk, J. Jun, S.M. Kazakov, and J. Karpinski, cond-mat/0404579.
- (13) A. Gurevich, Phys. Rev. B. 67 (2003) 184515.
- (14) A.C. Damask and G.J. Dienes, Point Defects in Metals, Gordon and Breach, Science Publishers, Inc., New York, 1963.
- (15) A.E. Karkin, V.I. Voronin, T.V. Dyachkova, A.P. Tyutyunnik, V.G. Zubkov, Yu. G. Zainulin, and B.N. Goshchitskii, JETP Letters 73 (2001) 570.
- (16) M. Eisterer, M. Zehetmayer, S. Tönies, H. W. Weber, M. Kambara, N. Hari Babu, D.A. Cardwell, and L.R. Greenwood, Superconductor Science and Technology 15 (2002) L9-L12.
- (17) E. Babic, D. Miljanic, K. Zadro, I. Kusevic, Z. Marohnic, D. Drobac, X.L. Wang, and S.X. Dou, Fizika A 10 (2001) 87-94.
- (18) U.P. Trociewitz, P.V.P.S.S. Sastry, A. Wyda, K. Crockett, and J. Schwartz, IEEE Transactions on Applied Superconductivity 13 (2003) 3320-3323.
- (19) Kenneth S. Krane, Introduction to Nuclear Physics, John Wiley & Sons, Inc., New York, 1988.
- (20) Y. Wang, F. Bouquet, I. Sheikin, P. Toulemonde, B. Revaz, M. Eisterer, H.W. Weber, J. Hinderer, and A. Junod, J. Phys.: Condens. Matter 15 (2003) 883-893.
- (21) M. Zehetmayer, M. Eisterer, J. Jun, S.M. Kazakov, J. Karpinski, B. Birajdar, O. Eibl, and H.W. Weber, Phys. Rev. B 69 (2004) 054510.
- (22) M.Putti, V. Braccini, C. Ferdeghini, F. Gatti, P. Manfrinetti, D. Marre, A. Palenzona, I. Pallecchi, C. Tarantini, I. Sheikin, H.U. Aebersold, and E. Lehmann, App. Phys. Lett. 86 (2005) 112503.
- (23) M. Ortolani, D. Di Castro, P. Postorino, I. Pallecchi, M. Monni, M. Putti, and P. Dore, Phys. Rev. B 71 (2005) 172508.
- (24) P.C. Canfield, D.K. Finnemore, S.L. Bud’ko, J.E. Ostenson, G. Lapertot, C.E. Cunningham, and C. Petrovic, Phys. Rev. Lett. 86 (2001) 2423.
- (25) R.H.T. Wilke, S.L. Bud’ko, P.C. Canfield, D.K. Finnemore, Raymond J. Suplinskas, and S.T. Hannahs, Physica C 424 (2005) 1.
- (26) R.A. Ribeiro, S.L. Bud’ko, C. Petrovic, and P.C. Canfield, Physica C 382 (2002) 194.
- (27) R.H.T. Wilke, S.L. Bud’ko, P.C. Canfield, D.K. Finnemore, Raymond J. Suplinskas, J. Farmer, and S.T. Hannahs, cond-mat/0507275
- (28) R. Gandikota, R.K. Singh, J. Kim, B. Wilkens, N. Newman, J.M. Rowell, A.V. Pogrebnyakov, X.X. Xi, J.M. Redwing, S.Y. Xu, and Q. Li, App. Phys. Lett. 86 (2005) 012508.
- (29) I.I. Mazin, O.K. Andersen, O. Jepsen, O.V. Dolgov, J. Kortus, A.A. Golubov, A.B. Kuz’menko, and D. van der Marel, Phys. Rev. Lett. 89 (2002) 107002.
- (30) J.M. Rowell, Supercond. Sci. Tech. 16 (2003) R17.
- (31) M. Eisterer, Phys. Stat. Sol. C 2 (2005) 1606.
- (32) N.R. Werthamer, E. Helfand, and P.C. Hohenberg, Phys. Rev. 147 (1966) 295.
- (33) M. Putti, M. Affronte, C. Ferdeghini, C. Tarantini, and E. Lehmann, cond-mat/050852
- (34) C.P. Bean, Phys. Rev. Lett 8 (1962) 250.
- (35) M. Eisterer, M. Zehetmayer, and H.W. Weber, Phys. Rev. Lett. 90 (2003) 247002.
- (36) I. Pallecchi, J.C. Tarantini, H.U. Aebersold, V. Braccini, C. Fanciulli, C. Ferdeghini, F. Gatti, E. Lehmann, P. Manfrinetti, D. Marre’, A. Palenzona, A.S. Siri, M. Vignolo, and M. Putti, Phys. Rev. B 71 (2005) 212507.
- (37) S.X. Dou, S. Soltanian, J. Horvat, X.L. Wang, S.H. Zhou, M. Ionescu, H.K. Liu, P. Munroe, and M. Tomsic, APL 81 (2002) 3419.
- (38) M.W. Thompson, Defects and Radiation Damage in Metals, Cambridge University Press, London, 1969.
- (39) D.K. Finnemore, J.E. Ostensen, S.L. Bud’ko, G. Lapertot, and P.C. Canfield, Phys. Rev. Lett. 86 (2001) 2420.
- (40) A.A. Golubov and I.I. Mazin, Phys. Rev. B 55 (1997) 15146.
- (41) M.R. Eskildsen, M. Kugler, S. Tanaka, J. Jun, S.M. Kazakov, J. Karpinksi, and . Fischer, Phys. Rev. Lett. 89 (2002) 187003.
- (42) A.F. Goncharov and V.V. Struzhkin, Physica C 385 (2003) 117.
- (43) X.H. Zeng, A.V. Pogrebnyakov, M.H. Zhu, J.E. Jones, X.X. Xi, S.Y. Xu, E. Wertz, Qi Li, J.M. Redwing, J. Lettieri, V. Vaithyanathan, D.G. Schlom, Zi-Kui Liu, O. Trithaveesak, and J. Schubert, Appl. Phys. Lett. 82 (2003) 2097.
- (44) S. Deemyad, T. Tomita, J.J. Hamlin, B.R. Beckett, J.S. Schilling, J.D. Jorgensen, S. Lee, and S. Tajima, Physica C 385 (2003) 105.
- (45) V.P. Antropov, K.D. Belashchenko, M. van Shilfgaarde, and S.N. Rashkeev, Studies of High Temperature Superconductors 38 (2002) 91.
- (46) A.P. Gerashenko, K.N. Mikhalev, S.V. Verkhovskii, A.E. Karkin, and B.N. Goshchitskii, Phys. Rev. B 65 (2002) 132506.
- (47) S. Serventi, G. Allodi, C. Bucci, R. De Renzi, G. Guidi, E. Pavarini, P. Manfrinetti, and A. Palenzona, Supercond. Sci. Technol. 16 (2003) 152-155.
- (48) S.H. Baek, B.J. Suh, E. Pavarini, R.G. Barnes, S.L. Bud’ko, and P.C. Canfield, Phys. Rev. B 66 (2002) 104510.
- (49) R. Gandikota, R.K. Singh, J. Kim, B. Wilkens, N. Newman, J.M. Rowell, A.V. Pogrebnyakov, X.X. Xi, J.M. Redwing, S.Y. Xu, Q. Li, and B. Moeckly, App. Phys. Lett. 87 (2005) 072507.
- (50) A.V. Sologubenko, N.D. Zhigadlo, S.M. Kazakov, J. Karpinski, and H.R. Ott, Phys. Rev. B 71 (2005) 020501.
- (51) Z. Hoľanová, J. Kačmarčík, P. Szabó, P. Samuely, I. Sheikin, R. A. Ribeiro, S. L. Bud’ko and P. C. Canfield, Physica C 404 (2004) 195.
![[Uncaptioned image]](/html/cond-mat/0507185/assets/x1.png)

![[Uncaptioned image]](/html/cond-mat/0507185/assets/x3.png)
![[Uncaptioned image]](/html/cond-mat/0507185/assets/x5.png)
![[Uncaptioned image]](/html/cond-mat/0507185/assets/x6.png)
![[Uncaptioned image]](/html/cond-mat/0507185/assets/x7.png)

![[Uncaptioned image]](/html/cond-mat/0507185/assets/x10.png)

![[Uncaptioned image]](/html/cond-mat/0507185/assets/x13.png)
![[Uncaptioned image]](/html/cond-mat/0507185/assets/x14.png)
![[Uncaptioned image]](/html/cond-mat/0507185/assets/x15.png)


![[Uncaptioned image]](/html/cond-mat/0507185/assets/x23.png)

![[Uncaptioned image]](/html/cond-mat/0507185/assets/x25.png)
![[Uncaptioned image]](/html/cond-mat/0507185/assets/x28.png)
![[Uncaptioned image]](/html/cond-mat/0507185/assets/x29.png)
![[Uncaptioned image]](/html/cond-mat/0507185/assets/x31.png)
![[Uncaptioned image]](/html/cond-mat/0507185/assets/x32.png)
![[Uncaptioned image]](/html/cond-mat/0507185/assets/x34.png)
![[Uncaptioned image]](/html/cond-mat/0507185/assets/x35.png)
| Exposure Time (Hours) | Fluence (cm-2) | Atomic % Li |
|---|---|---|
| 24 | 0.37 | |
| 48 | 0.74 | |
| 72 | 1.11 | |
| 96 | 1.48 |