Manipulating vortex motion by thermal and Lorentz force in high temperature superconductors
Abstract
By using thermal and Lorentz force, the vortex motion is successfully manipulated in the mixed state of underdoped La2-xSrxCuO4 single crystals and optimally doped YBa2Cu3O7-δ thin films. A conclusion is drawn that the strong Nernst signal above is induced by vortex motion. In the normal state, in order to reduce the dissipative contribution from the quasiparticle scattering and enhance the signal due to the possible vortex motion, a new measurement configuration is proposed. It is found that the in-plane Nernst signal ( ) can be measurable up to a high temperature in the pseudogap region, while the Abrikosov flux flow dissipation can only be measured up to . This may point to different vortices below and above if we attribute the strong Nernst signal in the pseudogap region to the vortex motion. Below the dissipation is induced by the motion of the Abrikosov vortices. Above the dissipation may be caused by the motion of the spontaneously generated unbinded vortex-antivortex pairs.
pacs:
74.40.+k, 74.25.Fy, 74.72.DnI Introduction
One of the core issues in high temperature superconductor is the origin of the pseudogap above in the underdoped region. In order to understand the physics of the pseudogap, many theoretical models have been proposed such as spin fluctuationPines , preformed cooper pairEmery1 ; Millis , charge stripesEmery2 , d-density wave (DDW)Affleck ; Chakravarty , etc. Among many of them, the pseudogap state has been considered as the precursor to the superconducting state. In the pseudogap region above , a significant in-plane Nernst signals has been discovered by Xu et al.Xu in the underdoped La2-xSrxCuO4 single crystal, and they attributed this signal to vortex-like excitations above . This result has been confirmed in other families of cuprate superconductors WYY1 ; WYY2 . By doing experiments with the magnetic field applied along different directions, Wen et al.Wen gave a strong indication for a 2D feature of the Nernst effect in the pseudogap region of underdoped cuprate superconductors. About the origin of the strong Nernst signal above , it remains highly controversial. Wang et al. WYY2 ; WYY3 suggested that the large Nernst signal supports the scenarioEmery1 where the superconducting order parameter disappears at a much higher temperature instead of . KontaniKontani suggested that the pseudogap phenomena including the strong Nernst signal can be well described in terms of the Fermi liquid with antiferromagnetic and superconducting fluctuations. Ussishkin et al.Ussiahkin proposed that the Gaussian superconducting fluctuations can sufficiently explain the Nernst signal in the optimally doped and overdoped region, but in the underdoped region the actual is suppressed from meanfield temperature by non-Gassian fluctuation. Tan et al.Tan believed that a preformed-pair alternative to the vortex scenario can lead to a strong Nernst signal. Alexandrov and ZavaritakyAZ proposed a model based on normal state carrier without superconducting fluctuation, which, as they asserted, ‘can describe the anomalous Nernst signal in high- cuprate’AZ .
It is thus strongly desired to investigate the feature of Nernst signal below and above . One possibility is that the strong Nernst signal above is originated from or partly from the motion of vortex, but the structure and the feature of the vortices above is different from that below . We thus measured the in-plane Nernst voltage and the resistance of the underdoped La2-xSrxCuO4 single crystals and optimally doped YBa2Cu3O7-δ thin films in the magnetic field perpendicular to the ab-plane. Besides the temperature gradient, we applied a transverse current to manipulate the possible motion of the vortices. Especially we measured the longitudinal voltage in a new configuration which may reduce the dissipative contribution from the quasiparticle scattering and enhance the signal due to the possible vortex motion. In this new configuration, a strong signal measured from the Nernst leads above is observed in underdoped samples. The signal maybe caused by the motion of quasiparticles and vortex. Our results indicate that the Nernst signal above is contributed by vortex. The results were analyzed and we think that if strong Nernst signal in the pseudogap region is contributed by the vortex motion, vortices are different below and above . Below the dissipation is induced by the motion of the Abrikosov vortices. Above the dissipation may be caused by the motion of the spontaneously generated unbinded vortex-antivortex pairs (vortex plasma).
II Experimental techniques
The La1.89Sr0.11CuO4 single crystals measured in this work were prepared by the traveling solvent floating-zone techniqueZhou . The perfect crystallinity of the single crystals were characterized by X-ray diffraction patternsZhou . The single crystal sample is shaped into a bar with the dimensions of of 4.2 mm (length) 1 mm (width) 0.5 mm (thickness). The crystal along the length direction is [110]. The optimally doped YBa2Cu3O7-δ thin films were prepared by co-evaporation on MgO substrates with dimensions of 10 mm (length) 1 mm (width), and the thickness of the film is about 5000 angstrom. We annealled the YBa2Cu3O7-δ film to underdoping state and measured its Nernst voltage in the mixed and normal state. The resistance characteristics of the samples measured is shown in FIG 1.

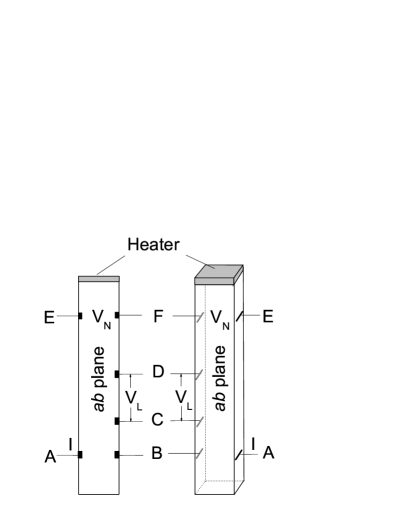
The measurement configuration in our experiment is illustrated in FIG. 2. The magnetic field is applied along the c-axis of the samples. The curves of the samples were obtained by standard four-point method at different temperatures. A heater with a power of 1 mW (for the single crystal) or 9 mW (for the thin film) producing the thermal gradient is adhered fast on one end of the YBa2Cu3O7-δ thin film sample (left) and La1.89Sr0.11CuO4 single crystal sample (right). The other end of the samples is adhered fast on a cold sink. Along the direction E-F (perpendicular to the thermal gradient) the Nernst voltage signal is measured. Two thermometers are attached onto the sample to detect the temperature gradient of the samples. In order to control the vortex motion by Lorentz force, we applied a direct transverse current of 3 mA along A-B and measured the longitudinal voltage between the points C and D. Since the DC current here can exert a Lorentz force to the vortices down or againt the thermal stream direction, the motion of the vortex can be manipulated by thermal and/or Lorentz force. All leads are stuck onto the samples by solidified silver paste at corresponding electrodes with the contact resistance below 0.1 . All measurements are based on an Oxford cryogenic system ( Maglab-12 ) with temperature fluctuation less than 0.04% and magnetic fields up to 12 T. The Nernst voltage and the longitudinal voltage are measured by a Keithley 182-Nanovoltmeter with a resolution of about 5 nV in present case. During the measurement for Nernst and longitudinal voltage the magnetic field is applied parallel to c - axis and swept between 12 to -12 T. The Nernst signal is obtained by subtracting the positive field value with the negative one in order to remove the Faraday signal during sweeping the field and the possible thermal electric power due to asymmetry of the electrodes. The Longitudinal signal is obtained by averaging the data obtained from positive field and the negative field.
III Results and discussion
III.1 Pure Nernst Signal
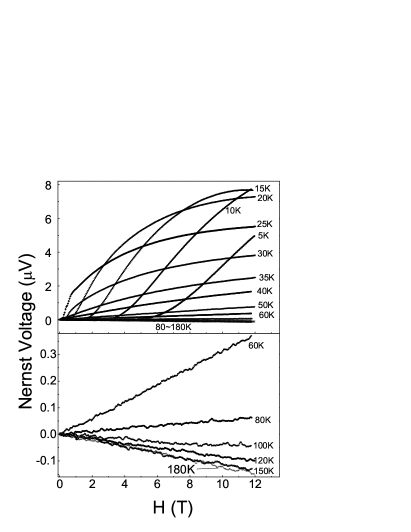
FIG. 3. shows the Nernst voltage measured on the La1.89Sr0.11CuO4 single crystal with a thermal gradient along [110] (length) direction at temperatures from 5 K to 180 K. In low temperature region, the Nernst signal is dominated by the motion of Abrikosov vortices. One can see that the Nernst signal is precisely zero when the vortices are frozen in the case of 5, 10 and 15 K. The flow of vortices after melting leads to a Nernst signal increasing drastically with . A strong in-plane Nernst signal resulting from vortices flow can also be seen in the curves for 20, 25, 30 K, and can be measured far above (29.3 K for our sample). When the temperature is above 80 K, the signal becomes negative and gradually approaches a background. When the temperature is above 150 K the Nernst signal becomes insensitive to temperature and does not change anymore with . Similar results appear in the Nernst voltage measured on the underdoped YBa2Cu3O7-δ thin film, though it is not as strong as that of La1.89Sr0.11CuO4 single crystal sample. But no strong Nernst signal above is observed in optimally doped YBa2Cu3O7-δ thin film.
III.2 Flux Flow Resistance

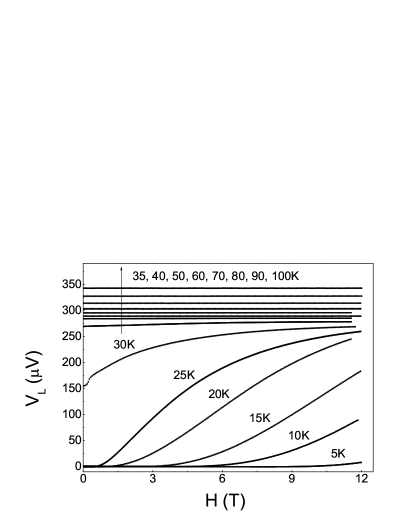
FIG. 4 shows the curves of the La1.89Sr0.11CuO4 single crystal at temperatures from 10 to 80 K measured by standard four-point method. A zero resistance can be seen when the flux lattice is frozen at the low temperature of 10, 15 and 20 K. The Abrikosov flux flow dissipation after vortex melting can be seen in higher temperature region. But the curvature due to the motion of Abrikosov vortices disappears when the temperature is above . The dissipation becomes very weakly dependent on in the normal state, which can not be explained by the motion of Abrikosov vortices.
III.3 Longitudinal Signal
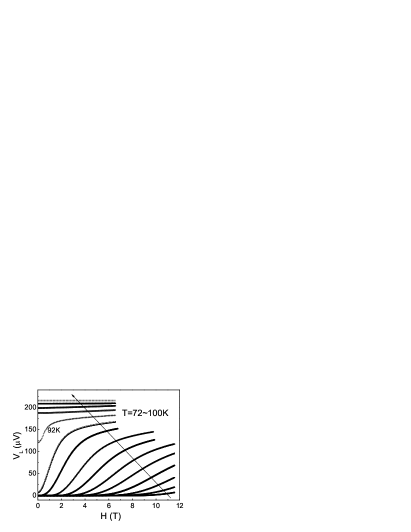
The dissipation shown above may be comprised of the contributions of both the flux flow and the quasiparticle scattering. The new configuration in our experiment can reduce the dissipative contribution from the quasiparticle scattering and enhance the signal due to the possible vortex motion if we send a current between A-B and measure the voltage between C-D. As shown in FIG. 2, the current was applied in A-B direction, and the longitudinal voltage between the points on the side of the sample C and D was measured. As the C-D direction is perpendicular to the current direction and the two points are located outside the regime where the main current can reach, so the voltage induced by the motion of quasiparticles is practically reduced; while the motion of the vortex crossing C-D induced by the current pump can be detected and are enhanced relatively as a consequence. The results of the longitudinal voltage measurement for underdoped single crystal at the temperature 5100 K and optimally doped YBa2Cu3O7-δ thin film at the temperature 72100 K are shown in FIG. 5 and FIG. 6 respectively. We can see in both figures the similar dissipation manner as that of the resistance of the samples in magnetic field shown in FIG. 4. The dissipation deriving from the motion of Abrikosov vortices disappears when the temperature is above , where the dissipation of the samples is independent on magnetic field at fixed temperatures.
The results from the measurement of Nernst voltage, resistance and longitudinal voltage of our samples at different temperatures may indicate different vortices below and above , provided that the dissipation is attributed to the vortex motion. Apparently, below the dissipation is induced by the motion of the Abrikosov vortices. The Abrikosov vortex dissipation leads to the resistance in mixed state and, at the same time, the phase slip caused by the motion of Abrikosov vortices along the thermal gradient leads to strong Nernst signal. The longitudinal voltage below shows a non-linear field dependence which indicates the feature of Abrikosov flux flow.
Above , the dissipation may be caused by the motion of the spontaneously generated vortex-antivortex pairs. According to the theory derived by BerezinskyBerezinsky and by Kosterlitz and ThoulessKT (BKT), just below a transition temperature which lies very nearby , in samples there are thermally excited vortices and antivortices binding in pairs, even in the absense of an external magnetic field. Above the pairs unbind to form vortex plasma which can flow freely as pancake vortices with their cores confined inside individual superconducting layers. The possibility of this BKT transition was verified and studied in layered HTS systemTomoko ; Culbertson ; Matsuda ; Pradhan ; Miu ; Martin . In the region above , the magnetic field applied on the samples influences the neutral vortices plasma, and polarizes part of the vortices. The dissipation caused by vortex and antivortex on the tolal resistance is the same, although the moving directions of them are different. In other words, the dissipation resulted from the current driven vortex motion is not related to the polarization of, but to the total number of the vortex and the antivortex in the sample, which is constant when changing . So the resistance of the sample in magnetic field above is weakly dependent on the magnetic field as illustrated in FIG. 4. For the same reason, the longitudinal voltage induced by the motion of the vortex plasma in the normal state is also independent on the magnetic field.
In the case of Nernst effect a different consequence appears in the pseudogap region. The vortex plasma redirected by the external magnetic field moves across E-F along the thermal gradient, leading to the phase slips and a transverse Nernst electric field appears consequently. The direction of the caused by the vortex is different from that of the caused by the antivortex moving along the same direction. So the direction and strength of is not determined by the total number but by the amount of the difference between vortex and antivortex, i.e. by the sign and the amount of the net vortex. The density of the net vortex in the samples increases with increasing external magnetic field, leading to the increase of Nernst voltage with in the field range of our experiment. The 2D feature of the Nernst effect in the pseudogap region of underdoped cuprate superconductors has been proved by the experiments of Wen et alWen , which supports our postulation above.
III.4 Manipulating Vortex Motion by Thermal and Lorentz Force
The Nernst signal and the longitudinal voltage as the result from the motion of vortex manipulated solely by the thermal gradient and solely by Lorentz force are discussed above. Now let’s go on to discuss the result of manipulating the motion of the vortex by the thermal gradient and the Lorentz force together. With a transverse current applied along A-B direction and a temperature gradient along the length direction of the La1.89Sr0.11CuO4 single crystal at the same time, the voltage between the Nernst leads E and F are measured.
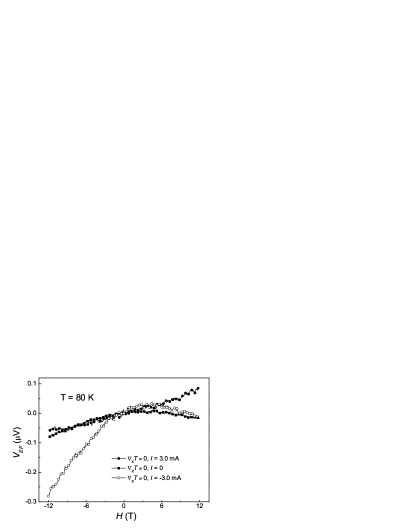
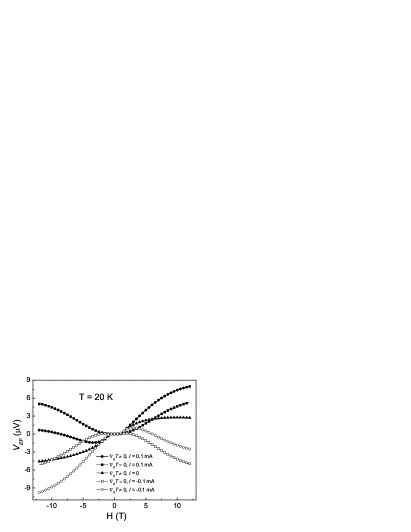
FIG. 7 shows the result of at 20 K for the case = 0, = 0.1 mA, and = -0.1 mA with and without thermal gradient. with thermal gradient and without current (presented by solid triangles) is the Nernst signal at this temperature, where we can see the sign of is dependent on the direction of magnetic field. For the case of = 0 and 0, (solid and open squares) shows the characteristics of Abrikosov vortices and the sign of the after vortices melting is independent on the direction of current. The features of the curves is similar to those in FIG. 4. The results manipulating vortex motion by thermal and Lorentz force is shown in the case of 0 and = 0.1 mA (solid and open circles) in FIG. 7. All the curves show that the transport properties in mixed state is dominated by Abrikosov vortex motion.
FIG. 8 shows the result at 80 K with the current of 0 mA, 3 mA and -3 mA. In FIG. 8, all the curves have been moved along axis and hence the values of is zero when = 0 for the convenience of comparison. The influence of the Faraday effects and the resistive components of the data are taken away by moving the curves. We can see from FIG. 8 that with positive transverse current, the measured under negative magnetic field is almost equivalent to the without current, but for the case under positive field, there is an obvious difference between the with current and that without current. With negative transverse current, the measured under positive magnetic field is almost equivalent to the without current, but for the case under negative field, there is an obvious difference between the with current and that without current. So we can conclude that the effects of the Lorentz force on the Nernst effect in the normal state is related to the direction of the magnetic field. This phenomenon can not be explained by the effects of quasiparticles and may be explained only by the motion of vortex. So the Nernst signal above is also contributed by flux motion, although the vortex structure and feature may be very different below and above .
IV Conclusions
The in-plane resistance, Nernst voltage and longitudinal voltage in a new experimental configuration of the underdoped La1.89Sr0.11CuO4 single crystal and optimally doped YBa2Cu3O7-δ thin film are measured by sweeping magnetic field at fixed temperatures. The vortex motion is successfully manipulated by using thermal and / or Lorentz force in the mixed and normal states of the samples. The Nernst signal in the normal state is observed. The signal maybe caused by the motion of quasiparticles or vortex or both. Our results indicate that Nernst signal above may be contributed by vortex motion, though the contribution of the quasiparticle has not been excluded. Different vortices below and above are expected if the strong Nernst signal in the pseudogap region was attributed to the vortex motion. Below the dissipation is induced by the motion of the Abrikosov vortices. Above the dissipation may be caused partly by the motion of the spontaneously generated unbinded vortex-antivortex pairs (vortices plasma).
V Acknowledgements
This work is supported by the National Natural Science Foundation of China (NSFC), the Ministry of Science and Technology of China, and the Chinese Academy of Sciences.
References
- (1) D. Pines, Physica C 235,113 (1994).
- (2) V. J. Emery, and S. A. Kievelson, Nature 374, 434 (1995).
- (3) A. J. Millis, Nature 398, 193 (1999).
- (4) V. J. Emery, S. A. Kievelson, and O. Zachar, Phys. Rev. B 56 6120 (1997).
- (5) Ian Affleck, and J. Brad Marston, Phys. Rev. B 37, 3774 (1988).
- (6) Sudip Chakravarty, R. B. Laughlin, Dirk K. Morr, and Chetan Nayak, Phys.Rev. B 63, 94503(2001).
- (7) Z. A. Xu, N. P. Ong, Y. Wang, T. Kakeshita, and S. Uchida, Nature 406, 486 (2000).
- (8) Yayu Wang, Z. A. Xu, T. Kakeshita, S. Uchida, S. Ono, Yoichi Ando, and N. P. Ong, Phys. Rev. B 64, 224519 (2001).
- (9) Yayu Wang, N. P. Ong, Z. A. Xu, T. Kakeshita, S. Uchida, D. A. Bonn, R. Liang, and W. N. Hardy, phys. Rev. Lett. 88, 257003 (2002).
- (10) H. H. Wen, Z. Y. Liu, Z. A. Xu, Z. Y. Weng, F. Zhou, and Z. X. Zhao, Europhys. Lett. 63 (4), 583 (2003).
- (11) Yayu Wang, S. Ono, Y. Onose, G. Gu, Yoichi Ando, Y. Tokura, S. Uchida, and N. P. Ong, Science 299, 86 (2003).
- (12) Hiroshi Kontani, Phys. Rev. Lett. 89, 237003 (2002).
- (13) Iddo Ussiahkin, S. L. Sondhi, and David. A. Huse, Phys. Rev. Lett. 89, 287001 (2002).
- (14) Shina Tan and K. Levin, Phys. Rev. B 69, 064510 (2004).
- (15) A. S. Alexandrov and V. N. Zavaritaky, Phys. Rev. Lett. 93, 217002 (2004).
- (16) F Zhou, W X Ti, et al, Superc. Sci. Tech. 16, L7 (2003)
- (17) V. L. Berezinsky, and Zh. Eksp. Teor. Fiz. 59, 907 (1970). [Sov. Phys. JEPT 32, 493 (1971).]
- (18) J. M. Kosterlitz and D. J. Thouless, J. Phys. C 6, 1181 (1973).
- (19) Tomoko Ota, Ichiro Tsukada, Ichiro Terasaki, and Kunimitsu Uchinokura, Phys.Rev. B 50, 3363 (1994).
- (20) J. C. Culbertson, U. Strom, S. A. Wolf, and W. W. Fuller, Phys.Rev. B 44, 9609 (1991).
- (21) Y. Matsuda, S. Komiyama, T. Terashima, K. Shimura, and Y. Bando, Phys.Rev. Lett. 69, 3228 (1992).
- (22) A. K. Pradhan, S. J. Hazell, J. W. Hodby, C. Chen, Y. Hu, and B. M. Wanklyn, Phys.Rev. B 47, 11374 (1993).
- (23) L. Miu, G. Jakob, P. Haibach, Th. Kluge, U. Frey, P. Voss-de Haan, and H. Adrian, Phys.Rev. B 57, 3144 (1998).
- (24) S. Martin, A. T. Fiory, R. M. Fleming, G. P. Espinosa, and A. S. Cooper, Phys.Rev. Lett. 62, 677 (1989).
- (25) C. Capan, K. Behnia, Hinderer and A. G. M. Jansen, W. Lang, C. Marcenat, C. Marin, and J. Flouquet, Phys. Rev. Lett. 88, 056601 (2002).