Formation of nematic liquid crystalline phase of F-actin varies from continuous to biphasic transition
Abstract
We show that the isotropic to nematic liquid crystalline phase transition of F-actin can be either continuous or discontinuous, depending critically on the filament length. For F-actin with average filament length , we confirm that the transition is continuous in both filament alignment and local concentration. In contrast, for filament length the F-actin solution undergoes a first order transition. Tactoidal droplets of co-existing isotropic and nematic domains were observed. Phenomena of nucleation-and-growth and spinodal decomposition both occur, depending sensitively on the exact concentration and average filament length of F-actin. In the late stage, the tactoidal droplets continually grow and occasionally coalesce to form larger granules.
pacs:
61.30.Eb, 64.70.Md, 87.15.-vCytoskeletal protein actin is responsible for cell morphology and motility Alberts and et al. (2002). Globular actin (G-actin) polymerizes to form long filaments, F-actin. F-actin has a diameter of 8 nm Holmes et al. (1990) and a distribution of lengths characteristic of the stochastic polymerization process Sept et al. (1999). F-actin is a semiflexible polymer with a persistence length of 15-18 Isambert et al. (1995); Gittes and et al. (1993), which is larger than their average length in cells or in vitro. There have been extensive studies concerning many remarkable properties of F-actin, including dynamic filament assembly and dissembly Fujiwara et al. (2002), phase transitions Coppin and Leavis (1992); Furakawa and et al. (1993); Viamontes and Tang (2003), and rheology Gardel et al. (2003). Many of these properties are shared by other self-assembled protein filaments such as microtubules and collagen-based intracellular matrix Alberts and et al. (2002).
Of particular relevance to this report is that F-actin undergoes an isotropic (I) to nematic (N) liquid crystalline phase transition. The onset concentration of the transition is inversely proportional to the average filament length Coppin and Leavis (1992); Furakawa and et al. (1993); Suzuki and et al. (1991); Viamontes and Tang (2003), consistent with statistical mechanical theories Onsager (1949); Flory (1969). The experimental studies use optical birefringence methods to measure the F-actin alignment across the I-N transition region. Under certain preparation conditions, ”zebra” birefringence patterns were observed, which have been attributed to the spontaneous separation of F-actin into I and N domains Suzuki and et al. (1991). Two more recent studies show Coppin and Leavis (1992); Viamontes and Tang (2003), however, that the F-actin I-N transition appears to be continuous in both filament alignment and concentration for . It has been argued that perhaps due to the extreme filament length, polydispersity, and semi flexibility, a combined outcome of defect suppression and entanglement renders the F-actin I-N transition continuous Viamontes and Tang (2003). The phenomenon may be relevant to the theory of Lammert, Rokshar, and Toner (LRT) Lammert et al. (1993, 1995), which predicts that a high disclination line defect energy renders the I-N transition into two continuous ones.
In this paper we confirm the continuous features of the I-N transition for solutions of long F-actin (), but also show for the first time the I-N co-existence and domain separation of F-actin for solutions with . Tactoidal droplets were observed in at least three types: N tactoids in an I background, I tactoids in an N background, coexistence of N and I tactoids on a uniform backgroud of weak alignment. The droplets grow in two distinct ways: 1. nucleation of scattered tactoids and growth; 2. spinodal decomposition, followed by coasening. In the late stage for both cases, coalescence of tactoidal droplets were observed and studied. Slow axis measurements of the N tactoids suggest that the director field smoothly follows the surface contour, connecting point defects at two opposite poles, which are called boojums Prinsen and van der Schoot (2003); Drzaic (1995)
G-actin was extracted from rabbit skeletal muscle following an established method Pardee and Spudich (1982). F-actin was varied by addition of gelsolin, a filament severing and end-capping protein Janmey et al. (1986); Tang and Janmey (1996). G-actin was polymerized upon addition of KCl and MgCl2 upto 50 mM and 2 mM, respectively. Rectangular capillary tubes from VitroCom Inc. (Mt. Lks., N.J) of crossectional dimensions 0.22 mm were used for measurements by fluorescence and birefringence microscopy. Both ends of the capillary tube were sealed by an inert glue to eliminate flow. Birefringence measurements were performed on a Nikon E-800 microscope equipped with the CRI PolScope package Viamontes and Tang (2003). PolScope is capable of measuring the optical birefringence and the direction of slow axis at each pixel position, thus reporting local alignment Oldenbourg and Mei (1995); Shribak and Oldenbourg (2003). F-actin was labeled 1 to 1000 with TRITC-Phalloidin (Sigma, St Louis, MO) for fluorescence measurements, performed as previously described Viamontes and Tang (2003). 2D Fast Fourier Transform (2D-FFT) analysis was performed similarly to Bees and Hill Bees and Hill (1997), using the MatLab 7.0 software (The MathWorks, Inc.).
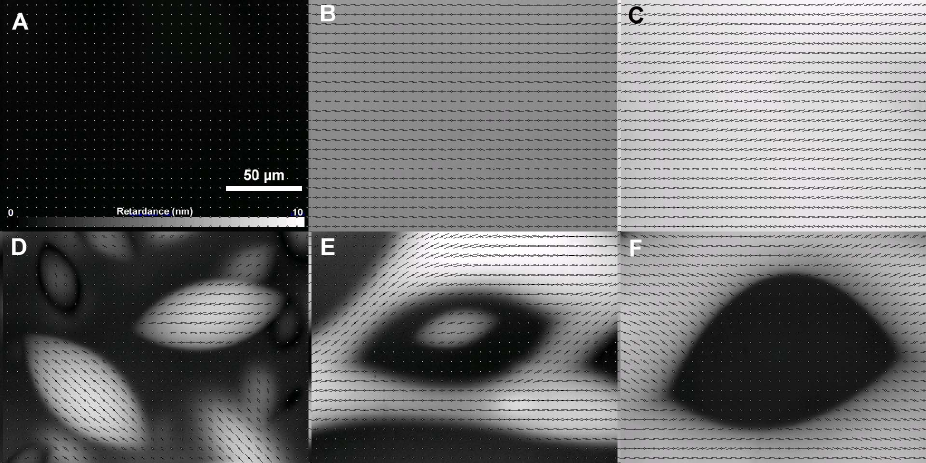
Different features are observed between samples of several of F-actin in their respective ranges of concentration over which the I-N transition occurs. F-actin with no gelsolin added were measured to be of . Fig. 1 shows representative results of birefringence and filament alignment of F-actin in the I phase (Fig. 1A), transition region (Fig. 1B), and the N phase (Fig. 1C). Of particular note is that in the I-N transition region uniform retardance is found, suggesting that F-actin is continuous in alignment (Fig. 1B) and in concentration Viamontes and Tang (2003). Zebra patterns are occationally observed, especially near the wall of a capillary tube, or at an air liquid interface, examples of which have been shown by previous studies Coppin and Leavis (1992); Suzuki and et al. (1991); Viamontes and Tang (2003). Even at the location of a zebra pattern, the local concentration of actin remains uniform, suggesting a lack of co-existence in long F-actin samples Viamontes and Tang (2003). In contrast, upon further reduction of to the F-actin solution phase separates into tactoidal droplets and their surrounding medium (Fig. 1D). An increase in concentration gives rise to co-existence of I and N tactoids (Fig. 1E), and I tactoids in N background (Fig. 1F). Local concentration of F-actin is measured by quantitative fluorescence labelling, which shows that N tactoids are denser in protein than the surrounding background, but only by 20-30 %. The actin concentration within the I tactoids is lower than the sorrunding N region by a similar percentage. These results comfirm the weakly first order nature of the I-N transition.
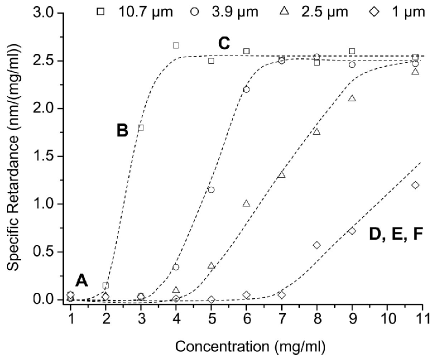
We have measured the average alignment of F-actin at four as a function of actin concentration over the range of I-N transition (Fig. 2). was determined by fluorescence imaging or AFM (for the shortest ) of single F-actin for at least 500 filaments for each . Below a threshold concentration F-actin solution is in the I phase, thus the retardance is zero (Region A). As the concentration increases, the solution reaches the I-N transition region, characterized by the sharp increase of specific retardance (Region B). In the high concentration region, F-actin solution is completely in the N phase (Region C). As decreases, the onset concentration of the I-N transition increases, consistent with the earlier reports Coppin and Leavis (1992); Furakawa and et al. (1993); Suzuki and et al. (1991); Viamontes and Tang (2003). D,E,F on Fig. 2 indicate the I-N transition region for , where the specific birefringence values were measured prior to phase separation as shown in Fig. 1.
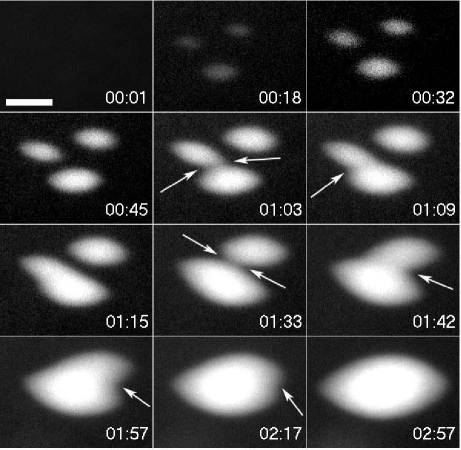
When actin is polymerized at slightly above or below the co-existing I or N concentrations, nascent tactoids are nucleated in the transition region for F-actin with . Coalescence of tactoidal droplets is an efficient form of growth. Fig. 3 shows how N tactoids coalesce, viewed under a polarization microscope. Initially the tactoids are separated from each other. Upon growth, two tactoids reach close proximity and fuse. Once two tactoids have coalesced the final shape is again a similar tactoid. The process repeats itself as the 3rd tactoid coalesces to form one final tactoid. One charactistic of such a large molecular system is its slow dynamics, as the sequence in display took nearly 3 hours.
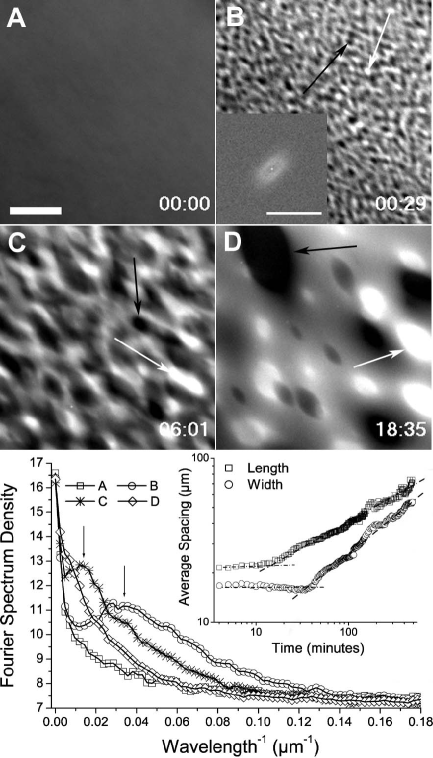
When the actin concentration is close to midway between the co-existing I and N concentrations (both are sensitive functions of ), we reproducibly observed the phenomenon of spinodal decomposition. At the high concentration of several mg/ml, F-actin polymerization occurs within seconds following the addition of KCl and MgCl2 Carlier et al. (1984). Therefore, the solution becomes weakly aligned by the shear flow as it is injected into the capillary tube. Fig. 4A-D show a time sequence of tactoidal growth from initiation of actin polymerization to the formation of large tactoids. Fig. 4A represents the actin solution immediately after it was prepared for observation, which took about 30 seconds. A granular structure appears throughout the capillary tube within minutes after initiation of polymerization. The characteristic domain size is determined by 2D-FFT and is (see inset on the bottom plot). The domain size appears to be nearly constant within the first 15 or 30 min for length and width. The dominant size of the spinodal growth can be explained by adding a density gradient term to the free energy of the system following the classical Cahn-Hilliard treatment Jones (2002). Based on the observed peak wave factor , we predict that the thickness of the I-N interface Larson (1999), assuming that filaments tend to align parallel to the interface. By the 30 min time point, both I and N droplets are discernable (Fig.4B). The late stage growth lasts for many hours. For instance, Fig.4C represents the time point when coalescence has become the main form of tactoidal growth. The large tactoids in Fig. 4D are formed by both continuous growth and occasional coalescence of smaller tactoids. The plot in Fig 4 shows progression of the radial peak in the Fourier spectrum density, whereas the tactoidal length and width shown in the inset were obtained by analyzing line plots along the long and short axes separately.
It is important to note that the actin tactoids we report here are fundamentally different from what we recently reported Tang et al. (2005). Actin granules reported in our recent study were induced by an actin crosslinking protein, alpha-actinin. As a result, the density of actin in the published actin granules is over 10 times higher than in this study. The dense actin granules observed in our recent report are clearly discernable with phase contrast imaging, which is not the case for either I or N droplets reported here. Also, in the present study, we have not observed variant shapes such as triangular tactoids. The tactoids formed due to I-N separation easily disappear upon dilution, unlike the permenant tactoids due to crosslinking of alpha-actinin. Nevertheless, it is remarkable that in both cases the much similar tactoidal shape prodominates. We argue that the tactoidal shape is general among granules consisting of long and stiff filaments, which is dictated by the minimization of the surface energy while accomodating the long and stiff constituent filaments. It is thus not surprising that tactoids of similar shapes are found in two distinct types of actin granules, and in concentrated suspension of Tobacco Mosaic Virus (TMV) Freundlich (1938) and filamentous phage fd Dogic and et al. (2004), as well.
In conclusion, we have shown new features of I-N phase transition of F-actin solutions as a function of . At , the I-N phase transition is continuous, consistent with previous findings Viamontes and Tang (2003); Coppin and Leavis (1992). However, biphasic behavior characteristic of a first order transition is observed for , including both phenomena of nucleation-growth and spinodal decomposition. Tactoidal droplets of either I or N domains form in the N or I background. Tactoids of both phases can also co-exist with a weakly aligned background state, suggesting slow kinetics and metastability. The process for tactoidal growth involves both constant recruitment of the surrounding filaments and coalescence of existing neighboring tactoids.
This work is supported by the National Science Foundation (NSF DMR 0405156) and the Petroleum Research Fund, administered by the American Chemical Society. We thank Professors Robert Meyer, Robert Pelcovits, Tom Powers and Jim Valles for valuable suggestions.
References
- Alberts and et al. (2002) B. Alberts and et al., Mol. biol. of the cell (Garland, New York, 2002), 4th ed.
- Holmes et al. (1990) K. C. Holmes, D. Popp, W. Gebhard, and W. Kabsch, Nature 347, 44 (1990).
- Sept et al. (1999) D. Sept, J. Xu, T. D. Pollard, and J. A. McCammon, Biophys. J. 77, 2911 (1999).
- Isambert et al. (1995) H. Isambert, P. Vernier, A. C. Maggs, and et al., J. of Biol. Chem. 270, 11437 (1995).
- Gittes and et al. (1993) F. Gittes and et al., J. of cell biol. 120, 923 (1993).
- Fujiwara et al. (2002) I. Fujiwara, S. Takahashi, H. Tadakuma, T. Funatsu, and S. Ishiwata, Nature Cell Biol. 4, 666 (2002).
- Coppin and Leavis (1992) C. Coppin and P. Leavis, Biophys. J. 63, 794 (1992).
- Furakawa and et al. (1993) R. Furakawa and et al., Biochemistry 32, 12346 (1993).
- Viamontes and Tang (2003) J. Viamontes and J. X. Tang, Phys. Rev. E 67, 040701(R) (2003).
- Gardel et al. (2003) M. L. Gardel, M. T. Valentine, J. C. Crocker, Bausch, and D. A. Weitz, Phys Rev. Lett. 91, 158302 (2003).
- Suzuki and et al. (1991) A. Suzuki and T. M. et al., Biophys. J. 59, 25 (1991).
- Onsager (1949) L. Onsager, Ann. NY. Acad. Sci. 51, 627 (1949).
- Flory (1969) P. J. Flory, Statistical Mechanics of Chain Molecules (Interscience Publishers, New York, 1969).
- Lammert et al. (1993) P. Lammert, D. Rokhar, and J. Toner, Phys. Rev. Lett. 70, 1650 (1993).
- Lammert et al. (1995) P. Lammert, D. Rokhar, and J. Toner, Phys. Rev. E 52, 1778 (1995).
- Prinsen and van der Schoot (2003) P. Prinsen and P. van der Schoot, Phys. Rev. E 68, 021701(1) (2003).
- Drzaic (1995) P. Drzaic, Liquid Crystal Dispersions (World Scientific, Singapore, 1995).
- Pardee and Spudich (1982) J. Pardee and J. Spudich, Methods Cell Biol 24, 271 (1982).
- Janmey et al. (1986) P. Janmey, J. Peetermans, K. Zaner, and et al., J. Biol. Chem 261, 8357 (1986).
- Tang and Janmey (1996) J. X. Tang and P. A. Janmey, J. Biol. Chem. 271, 8556 (1996).
- Oldenbourg and Mei (1995) R. Oldenbourg and G. Mei, J. of Micro. 180, 140 (1995).
- Shribak and Oldenbourg (2003) M. Shribak and R. Oldenbourg, Appl. Opt. 42, 3009 (2003).
- Bees and Hill (1997) M. Bees and N. Hill, J. of Exp. Biol. 200, 1515 (1997).
- Carlier et al. (1984) M.-F. Carlier, D. Pantaloni, and E. D. Korn, J. of Biol. Chem. 259, 9983 (1984).
- Jones (2002) R. A. L. Jones, Soft Condensed Matter (Oxford University Press, New York, 2002).
- Larson (1999) R. G. Larson, The Structure and Rheology of Complex Fluids (Oxford University Press, New York, 1999).
- Tang et al. (2005) J. X. Tang, H. Kang, and J. Jia, Langmuir 21, 2789 (2005).
- Freundlich (1938) H. Freundlich, J. Phys. Chem. 41, 1151 (1938).
- Dogic and et al. (2004) Z. Dogic and et al., Phys. Rev. Lett. 92, 125503 (2004).