Probing Magnetic Gap Collapse within a Three-band Model of Resonant inelastic x-ray scattering (RIXS) in the Cuprates
Abstract
We present a three-band Hubbard Hamiltonian and the associated Cu K-edge RIXS spectra for electron and hole doped cuprates over a wide range of energy and momentum transfers. By comparing computed spectra for the unfilled case with the corresponding results for 15% electron or hole doping at two different values of the effective Hubbard parameter , generic signatures of the collapse of the magnetic gap and the characteristic momentum dependencies and evolution of the spectra with doping are identified. Available RIXS data support the gap collapse scenario for electron doped cuprates, but the situation in hole doped systems is found to be less clear.
In a resonant inelastic x-ray scattering (RIXS) experiment, the incident x-ray photon is scattered after inducing electronic transitions in the vicinity of the Fermi energy (), as in Raman scattering.KoShin Since no charged particles enter or leave the sample, the technique is attractive as a genuine bulk probe and a new spectrocopic tool for getting a handle on the nature of both filled and unfilled electronic states within a few eV’s of . Although filled states are also accessible via angle-resolved photoemission spectroscopy (ARPES), the unique ability of RIXS to access unfilled states makes it ideal for probing how the magnetic gap in insulating half-filled cuprates evolves with doping. The momentum-space evolution of this process and the possible collapse of the magnetic gap at optimal doping are fundamental pieces of information necessary for identifying different routes from the insulating to the superconducting state and the mechanism which underlies the remarkable phenomenon of high-temperature superconductivity.
This article discusses a three band Hubbard Hamiltonian and the associated Cu K-edge RIXS spectra for energy transfer extending to 8 eV and momentum transfer along the symmetry line. Our purpose is to obtain a systematic scheme for interpreting spectral features and their evolution with electron and hole doping in the cuprates. The specific parameters are chosen to describe Nd2-xCexCuO4 (NCCO), but the results are expected to be representative of the cuprates more generally. The electronic structure is treated at the Hartree-Fock level with variable to simulate the collapse of the magnetic gap. The solution at half-filling for = 7.2 eV is found to be antiferromagnetically (AFM) ordered and to display a ‘charge transfer’ gap of 2 eV between the Cu d and O-p orbitals. At fixed =7.2 eV, the effect of electron doping is to move most RIXS transitions to lower energies (in relation to half-filling), while hole doping introduces new ‘bands’ of transitions in the spectrum, although both electron and hole doping yield additional weak transitions at low energy transfers in the 0-2 eV range. For =5.7 eV, on the other hand, where the AFM gap collapses near optimal electron or hole doping, strong features in the RIXS spectra are predicted with characteristic -dependencies at low energies. In confronting our predictions with available experimental resultsAbba ; Hill1 ; HHH ; Hasan2 ; Hill3 ; Hasan4 ; ITE ; LuG , we find that the RIXS data on NCCO support the scenario of a collapsed magnetic gap at optimal doping, while the situation with the hole doped systems is less clear. Our study suggests regions of space where further experimental work would be valuable.
As general background, we note that Cu -edge RIXS is an indirect probe of the magnetic gap, since the x-ray excites a core electron, leading to a shake-up of the near-Fermi level states associated with screening the core hole. The relative merits of indirect and direct RIXS in the cuprates have been debatedUTI ; ZC ; VF , where the latter refers to -edge RIXS and the excitation of an electron from the Cu directly into the Cu states. The polarization selection rules in RIXS are equivalent to those in Raman. Screening excitations in K-edge RIXS satisfy =0,2 selection rule, so that the RIXS gap can be different from the optical gap (=1)ZC .
Most treatments of RIXS spectra are based on cluster modelsHill1 ; HHH ; Hasan2 ; TTM2 ; IKo ; Hasan3 ; ITE , which are intrinsically limited in describing solid-state band dispersions, although some studies have involved single band, infinite dimensional modelsDev1 . We consider a 3-band Hubbard model Hamiltonian with Cu and two O orbitals:
| (1) |

Here is the bare on-site energy of the Cu orbital with respect to that of the O orbitals (taken to define the energy zero), and are the Cu-O and O-O nearest neighbor (NN) hopping parameters and [] is the Cu [O] on-site Coulomb repulsion. The single [double] angular brackets on the summations denote that these sums are restricted to the Cu-O[O-O] NN terms. The specific values of the parameters have been obtained from an analysisfoot1 ; MKII ; Ar3 of the doping-dependent ARPES spectra of NCCO: eV, eV, eV, eV, and eV for . is found to decrease with doping with a value of 5.7 eV at optimal doping, while the other parameters are doping independent. Accordingly, computations with =5.7eV as well as =7.2 eV are presented. Since similar parameter values describe LSCOAr3 , we expect our computations to capture generic features of the RIXS spectra of both electron and hole doped cuprates.
As a prelude to RIXS computations, we solve the electronic structure at the level of the Hartree-Fock approximation. Note that the treatment of terms involving the Hubbard parameters and , renormalize to an effective parameter , where and are the average electron density and magnetization on Cu, with similar definitions for the oxygens. At half-filling, the self-consistent magnetization is found to be on Cu-sites, while the O-sites are unpolarized. The computed doping dependence of is similar in 3-bandMKII and one-bandfoot1 models.
For orientation, Fig. 1(a) shows the density of states (DOS) for =7.2 eV at half-filling (). The AFM ordering yields a total of six bands marked A-F. At half filling lies in the gap between the two highest bands the ‘upper Hubbard band’ A at eV and the ‘charge transfer’ or ‘Zhang-Rice’ band B at eV. Note that the splitting between bands A and F, which are dominated by the Cu contribution (red), is the main Mott gap controlled by , while the A-B splitting is related to the product , which is the AFM gapfoot5 .
The K-shell RIXS cross-section for the Cu core level excitation can be written as NoI ; foot2
| (2) |
where
| (3) |
Here . The Cu band is assumed dispersionless at energy , the Cu band is modelled by a 2D tight binding band with NN hopping, and the near-FS bands are described by energies , occupation numbers , and eigenvectors of spin and orbital which include a magnetic structure factor. [] and [] are the energy and wave number of the incident [scattered] photon, with energy and momentum transfer given by, and . Polarization effects arise via the Cu transition factor , which for simplicity is taken as a constant. The core hole broadening is treated phenomenologically by the damping parameter with a value of 0.8 eVLuG ; NoI . is the total number of Cu atoms. is the effective potential for creating an on-site Cu electron-hole pair. Although the predominant excitations are expected to be on-site Cu, we include the possibility of NN O excitations via , where is the potential for O excitations, as well as second NN Cu excitations via . We assume small values of , in this study. is a vector from the core hole to the atom on which the electron-hole pair is excited. Finally, is a vertex correction describing excitonic coupling of the electron-hole pair; we set , which is generally a good approximationNoI .
If the matrix element (ME) of Eq. 3 is approximated as a constant, then Eq. 2 becomes a relatively simple weighted k-resolved joint density of states (WK-JDOS) involving bands and where the weights involve only CuCu or OO transitions. More generally, at a fixed photon energy , the factor provides an -dependent modulation of the WK-JDOS. Computations with and without the RIXS cross-section approximated as WK-JDOS will be considered.
Fig. 1 shows the RIXS cross-section approximated as WK-JDOS for a number of different cases to allow the unfolding of effects of electron or hole doping and those due to the collapse of the AFM gap. We focus first on the RIXS ‘bands’foot3 in (b) for the undoped system and their relationship to the six DOS ‘bands’ A-F in (a). Here each of the five filled bands B-F can be excited into the unfilled band A, yielding five RIXS bands in (b). The lowest RIXS band comes from B A transitions and lies around 2 eV, while the highest band around 6 eV in (b) comes from F A transitions. The overlapping complex of bands around 3.5 eV is related to transitions from the O-related DOS bands C-E. With adequate resolution and statistics, RIXS should be able to map the RIXS bands of the sort shown in (b) and thus adduce the nature of the near- electronic structure in considerable detail.
We next consider the effect of electron doping by comparing (b) and (d), where (d) refers to 15% electron doping at =7.2 eV. Electron doping adds electrons to the bottom of the DOS band A, causing the portion of band A available for transitions to become narrower, so that transitions from bands B-E A will display a smaller spread in energy. At a fixed value of this will induce a shift in the RIXS bands to higher energies, but this effect is counteracted by a reduction of with doping (even when is held fixed). For example, the B A RIXS band near in (d) finally lies at a lower energy of 0.2 eV than in (b). Also, the added electrons at the bottom of A can be excited intraband within A and yield a new RIXS band at low energies below 1 eV in (d), especially along the line.
The effect of hole doping is fundamentally different in that holes remove states from the top of band B. Since bands A and C-F remain unchanged, transitions from C-F A will see little change, but the narrowing of band B due to added holes would move B A transitions to higher energies (if remained constant).foot4 Moreover, the added holes allow the formation of four new RIXS bands associated with excitations from C-F to the top of B as seen, for example, by comparing (b) and (c) at the middle of the line around 1.4 eV and at 4.3 eV. New intraband transitions within B also become possible, and much like the case of electron doping discussed above, these appear at low energies below 1 eV. However, the k-dependencies of such low energy RIXS bands for the hole and electron doping are seen by comparing (c) and (d) to differ substantially, reflecting the differing k-space locations of the respective band edges.
While decreases with doping at fixed , the resulting magnetic gap is still too large to explain the ARPES spectra of NCCO, suggesting that the mean field theory does not properly account for screening of . Reducing to 5.7 eV leads to a near collapse of the band splitting with = 0.063, in good agreement with NCCO ARPES data. [For hole doping, =5.7 eV yields =0.12.] The effects on the RIXS spectrum can be seen by comparing Fig. 1(d) with (f) for electron doping and Fig. 1(c) with (e) for hole doping. The most prominent signature of the collapse of the AFM gap is that the lowest RIXS band is shifted down to nearly zero energy at .
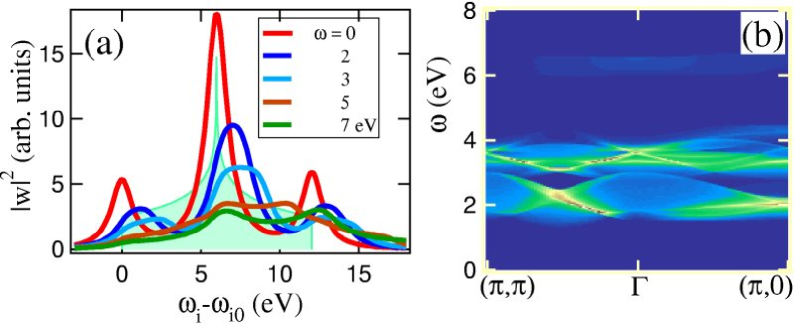
Fig. 2 illustrates the nature of the factor of Eq. 3 and its effect on the spectra. (a) shows the behavior of as a function of for several values of . [Note that Eq. 3 for does not depend on .] The peaks in are seen to be tied to the Van Hove singularities in the underlying DOS (green shaded area). In (b), the full RIXS spectrum of Eqs. 1 and 2 for , including the effect of , is shown for a particular photon energy. A comparison of Figs. 2(b) and 1(b) indicates that the modulation of the spectra due to is relatively weak.
Interestingly, the AFM order shows up in the =7.2eV spectra in Figs. 1(b)-(d) and Fig. 2(b) as an approximate symmetry in the RIXS bands about the point along the M- line. However, for =5.7eV, the reduced magnetism leads to a loss of this symmetry as seen from Figs. 1(e) and (f). Note that the underlying bands in all cases possess the symmetry of the AFM orderfoot5 , but that this symmetry is in general not obeyed by various spectroscopic measurements [e.g., the ‘shadow bands’ seen in ARPES].
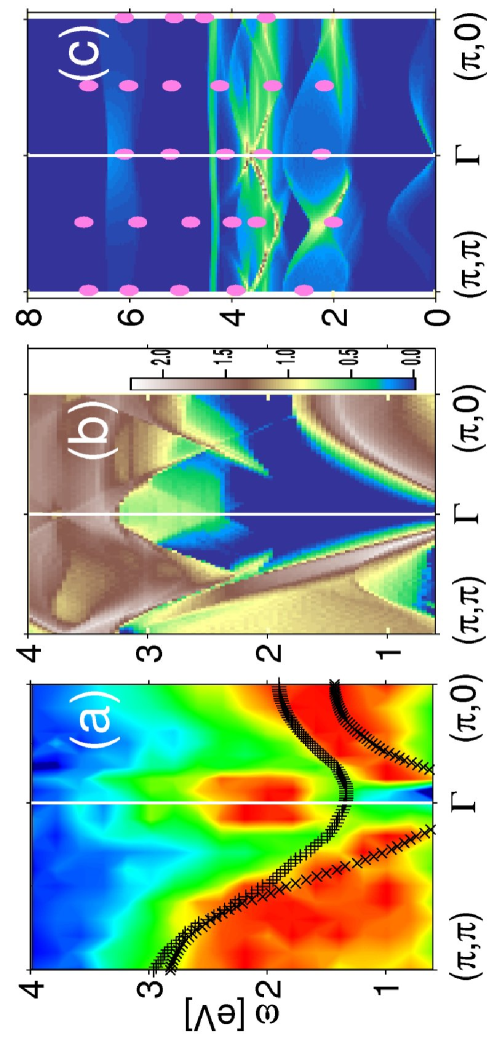
We comment now on the implications of some of the available experimental RIXS data in the light of our computations. In this connection, the RIXS data of Ref. ITE, from optimally doped NCCO is reproduced in Fig. 3(a), where the lowest RIXS bands highlighted in Figs. 1(d) and 1(f) are superposed as ’s and ’s, respectively. In comparing the theoretical spectra of Figs. 1(d) and 1(f) in the low energy regime of up to 3 eV with the results of Fig. 3(a), it is clear that the experiments are in substantially better accord with the results of Fig. 1(f) than 1(d). In particular, the data of Fig. 3(a) display a larger dispersion and presence of intensity extending to quite low energies along , while along the line the data show a smaller dispersion and are concentrated in a narrower window of energies, rather like the results of Fig. 1(f). In sharp contrast, Fig. 1(d) shows little intensity in the 0-1.5 eV range. Since the computations of Fig. 1(f) for =5.7 eV involve a collapsed AFM gap, while those of Fig. 1(d) for =7.2 eV do not, we are lead to adduce that the RIXS data on NCCO support an AFM gap collapse scenario.
Fig. 3(a) also shows a feature around 2 eV at . The intensity of this feature, assigned to interband transitions, is enhanced in the representation of Fig. 3(a) where data are normalized to maximum at each -point after subtracting high energy contributions. In reasonable accord, a weak feature around 2.5 eV at is seen in our computations in Fig. 3(b), which is due to interband transitions from the top of the C-E band complex to the upper magnetic bandfigplot ; otoc . However, we should keep in mind that a quantitative description of the RIXS spectra with increasing energy transfer will require the inclusion of additional Cu-O and O bands beyond the present three-band model. For this reason, other high energy features present in the spectra of Ref. ITE, and in the theoretical spectra of Fig. 3(b) are not analyzed further here.
The situation in hole-doped cuprates is less clear. Earlier RIXS experimentsHill3 ; Hasan4 reported a few, strongly dispersing peaks, but recently Lu, et al.,LuG find several additional weakly dispersing bands both in optimally doped HgBa2CuO4+δ (Hg1201) and in a reanalysis of the LSCO data. Fig. 3(b) shows the measured peak positions in Hg1201 overlayed on the computed RIXS spectrum of Fig. 1(c) for =7.2eV. The placement in energy of the observed peaks (red dots) is in qualitative accord, but it is difficult to make any definitive assigments of spectral features in view of the rather sparse set of -values sampled in the experiment. With reference to Fig. 1(e) for small , the most discriminating test of AFM gap collapse is the position of the prominent dispersing feature at low energies along the line. While a recent STM studySeam hints that the collapse of the AFM gap is far from complete in at least some compounds, optical spectra of hole-doped cuprates find large changes in the lowest gap with dopingUch . Some differences between the optical and RIXS spectra may arise due to presence of the core hole in the latter case. Nanoscale phase separation may also play a role. The appearance of new spectral features with hole doping (e.g. at 4.3 eV and at 1.4 eV at in Fig. 1(d)), delineated above in connection with the discussion of Fig. 1, would be tell-tale signatures of the uniformly doped state.
In conclusion, our study provides a systematic scheme for interpreting features in the RIXS spectra of the electron as well as hole doped cuprates, although the issue of nanoscale phase separation needs to be addressed in the latter case. In this way, signatures of collapse of the AFM gap in the RIXS spectra can be identified and their evolution with doping and momentum transfer vector at low energies can be connected to the behavior of the spectra at high energies to develop a robust understanding of the filled and unfilled states within a few eV’s around the Fermi energy.
Acknowledgements.
This work is supported by the US Department of Energy contract DE-AC03-76SF00098 and benefited from the allocation of supercomputer time at NERSC and Northeastern University’s Advanced Scientific Computation Center (ASCC).References
- (1) A. Kotani and S. Shin, Rev. Mod. Phys. 73, 203 (2001).
- (2) P. Abbamonte et al., Phys. Rev. Lett. 83, 860 (1999).
- (3) J.P. Hill et al., Phys. Rev. Lett. 80, 4967 (1998).
- (4) K. Hämäläinen et al., Phys. Rev. B61, 1836 (2000).
- (5) M.Z. Hasan et al., Science 288, 1811 (2000).
- (6) Y.J. Kim et al., Phys. Rev. B70, 094524 (2004).
- (7) M.Z. Hasan et al., cond-mat/0406654.
- (8) K. Ishii et al., Phys. Rev. Lett. 94, 207003 (2005).
- (9) L. Lu et al., Phys. Rev. Lett. 95, 217003 (2005).
- (10) M. Usuda, et al., Phys. Rev. B69, 014408 (2004).
- (11) G.P. Zhang et al., Phys. Rev. Lett. 92, 219702 (2004).
- (12) M. van Veenendaal and A.J. Fedro, Phys. Rev. Lett. 92, 219701 (2004).
- (13) K. Tsutsui et al., Phys. Rev. Lett. 91, 117001 (2003).
- (14) T. Idé and A. Kotani, J. Phys. Soc. Jpn. 68, 3100 (1999), 69, 3107 (2000).
- (15) M.Z. Hasan et al., cond-mat/0102492.
- (16) T.P. Devereaux et al., Phys. Rev. Lett. 90, 067402 (2003); A.M. Shvaika et al., cond-mat/0408400.
- (17) The approach for finding fitting parameters is a straightforward generalization of that described by Kusko et al.[Phys. Rev. B66, 140513(2002)] for a one-band model (see also Appendix A of Ref. 18).
- (18) R.S. Markiewicz, Phys. Rev. B 70, 174518 (2004).
- (19) R.S. Markiewicz et al., cond-mat/0503064.
- (20) One-band model results [Ref. MKII, ] suggest that the AFM gap persists in the presence of short-range AFM order.
- (21) T. Nomura and J.-i. Igarashi, Phys. Rev. B71, 035110 (2005).
- (22) The present calculation differs from that of Ref.NoI, by inclusion of , and a doping dependent .
- (23) By RIXS ‘bands’ we mean features in RIXS spectra such as those of Figs. 1(b)-(f) which arise from a particular pair of bands and present a band-like appearance. These should be distinguished from the conventional energy bands and the related DOS bands in Fig. 1(a).
- (24) In a one-band model only the lowest JDOS band is reproduced and electron- and hole-doping are nearly indistinguishable. [Ref. TTM2, ]
- (25) A plot of the spectrum of Fig. 3(b) over 0.5-3.0 eV by renormalizing to the maximum at each -point, yields a theoretical map quite similar to that of Fig. 3(a) in highlighting the 2-3 eV region around .
- (26) The top of the C-E band complex in the present 3-band model mainly possesses O-like character. The weak intensity of the 2.5 eV feature in our computations reflects the limitation of the 3-band model in properly describing the Cu-character of states at the top of the C-E band complex.
- (27) T. Hanaguri, Bull. A.P.S., 50, 1453 (2005).
- (28) S. Uchida et al., Phys. Rev. B43, 7942 (1991).