Unusual behaviour of the ferroelectric polarization in PbTiO3/SrTiO3 superlattices
Abstract
Artificial PbTiO3/SrTiO3 superlattices were constructed using off-axis RF magnetron sputtering. X-ray diffraction and piezoelectric atomic force microscopy were used to study the evolution of the ferroelectric polarization as the ratio of PbTiO3 to SrTiO3 was changed. For PbTiO3 layer thicknesses larger than the 3-unit cells SrTiO3 thickness used in the structure, the polarization is found to be reduced as the PbTiO3 thickness is decreased. This observation confirms the primary role of the depolarization field in the polarization reduction in thin films. For the samples with ratios of PbTiO3 to SrTiO3 of less than one a surprising recovery of ferroelectricity that cannot be explained by electrostatic considerations was observed.
The construction of artificial ferroelectric oxide superlattices with fine periodicity presents exciting possibilities for the development of new materials with extraordinary properties and furthermore is an ideal probe for understanding the fundamental physics of ferroelectric materials.
The most studied system at present is BaTiO3/SrTiO3 Tabata1994 ; Ishibashi2000 ; Nakagawara2000 ; Shimuta2002 ; Neaton2003 ; Johnston2005 ; Jiang2003 ; Rios2003 . Other combinations that have been studied include KNbO3/KTaO3 Christen1996 ; Sigman2002 ; Sepliarsky2001 ; Sepliarsky2002 , PbTiO3/SrTiO3 Jiang1999 , PbTiO3/BaTiO3 LeMarrec2000 , PbTiO3/PbZrO3Bungaro2002 ; Bungaro2004a and most recently high quality tricolour superlattices of SrTiO3/BaTiO3/CaTiO3Lee05 . In BaTiO3/SrTiO3, first principles studies Neaton2003 suggest that both the SrTiO3 and BaTiO3 layers are polarized such that the polarization is approximately uniform throughout the superlattice. The driving force behind this is the large electrostatic energy penalty for a build-up of charge at the interface caused by discontinuous polarization in the normal direction. The electrostatic model proposed by Neaton and Rabe Neaton2003 to explain their first principles results for BaTiO3/SrTiO3 superlattices is very similar to the electrostatic model applied to calculate the effect of the depolarization field in ultra-thin ferroelectric films with realistic electrodes Batra1972 ; Junquera2003 ; Dawber2003 . Experimentally it was recently shown that the reduced polarization observed in monodomain thin PbTiO3 can be explained by the presence of a depolarization field resulting from imperfect screening of the polarization Lichtensteiger . Recent work also suggests that, under certain conditions, the electrostatic energy due to depolarization fields will drive the system to form domains as observed by Fong et al. Fong2004 and Nagarajan et al. Nagarajan . In this letter we use PbTiO3/SrTiO3 superlattices to probe the effect of a reduced ferroelectric thickness in a dielectric environment. Our data show that the behaviour observed in PbTiO3 thin films is reproduced for PbTiO3 layers thicker than three unit cells. However, for thinner ferroelectric layers a surprising recovery of ferroelectricity that cannot be explained by electrostatic considerations was observed.
The superlattices of PbTiO3/SrTiO3 were prepared on conducting 0.5 Nb doped (001) SrTiO3 substrates using off-axis RF magnetron sputtering with conditions similar to those used for growing high quality epitaxial c-axis PbTiO3 thin films Lichtensteiger . For all the samples discussed in this paper, the SrTiO3 thickness was fixed at three unit cells (about 12 Å). At room temperature the in-plane lattice parameters of tetragonal ferroelectric PbTiO3 (a=3.904 Å,c=4.152 Å) and cubic dielectric SrTiO3 (3.905 Å) are an excellent matchLandolt-Bornstein . It is thus expected that PbTiO3 will grow coherently on SrTiO3 substrates, and that the strain interactions will be dominated by the constraint imposed by the substrate. The growth temperature for the superlattices was 460o C. Investigation by Transmission Electron Microscopy (TEM) revealed excellent quality in superlattices with layers of SrTiO3 thinner than 5 unit cells, though beyond this thickness the quality of the SrTiO3 layers deteriorated with thickness, presumably because of the low temperature. On the other hand, samples processed with higher temperatures were of lower quality, probably because of lead losses from the PbTiO3. The low temperature growth used thus seemed to be optimal for making superlattices in which the SrTiO3 layers are very thin, but without limitation on the thickness of PbTiO3.
In the principal series of interest we grew superlattices consisting of 20 PbTiO3/SrTiO3 bilayers in which the SrTiO3 layer thickness was maintained at 3 unit cells while the PbTiO3 layer thickness n was varied from 54 unit cells down to just one unit cell (denoted n/3). The first layer deposited was PbTiO3. The layer thicknesses were determined by calibrating x-ray diffraction patterns with deposition time.
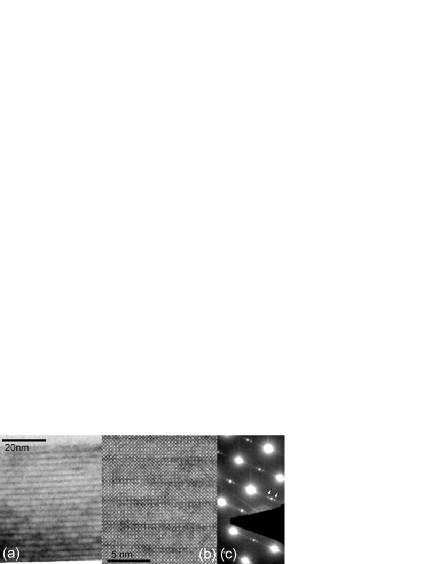
Cross-sectional TEM investigations were performed on several samples and reveal the coherent growth and artificial layering of the samples. Fig. 1 shows a summary of the results obtained on a 3/3 sample. The bright field image, Fig.1 (a), shows the layering throughout the sample. The perfect crystalline structure and coherent growth are demonstrated by the high resolution TEM (HRTEM) image Fig.1 (b), while the periodicity of the superlattice is demonstrated by the superlattice reflections in the diffraction image Fig.1 (c) (arrows).
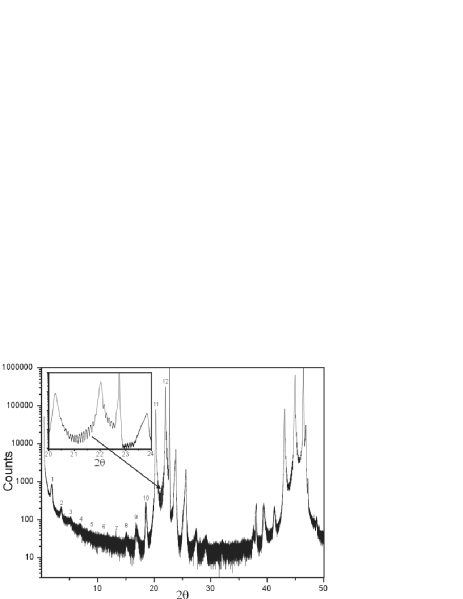
Further structural characterization were performed using standard x-ray diffraction. Fig. 2 shows the scan for a superlattice in which the PbTiO3 layers are 9 unit cells thick and the SrTiO3 layers are 3 unit cells thick (9/3). The periodicity of the superlattice is therefore 12 perovskite unit cells and 12 reflections from to the angle corresponding to the 001 peak of the average perovskite unit cell lattice parameter (at ) are expected, most of which are observable in the scan. In between the main superlattice peaks, the presence of 18 finite size effect peaks, clearly visible in the inset of Fig. 2, is due to the finite total thickness of the sample which is 20 times the superlattice periodicity.
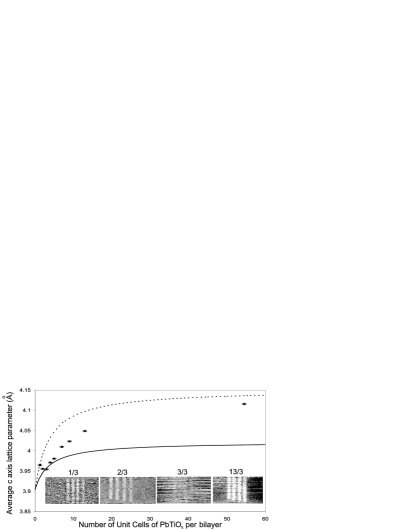
Because of the large strain-polarization coupling in PbTiO3 Cohen92 , a change in polarization results in a change in material tetragonality Lichtensteiger . We take advantage of this to follow the evolution of the polarization in the superlattice by following the evolution of the average c axis lattice parameter, , as the PbTiO3 layer thickness is varied. If the wavelength of the superlattice is then the nth peak in a scan will always correspond to irrespective of the value of allowing the average c axis lattice parameter of the superlattice to be easily determined. In practice, this peak is easily identifiable due to its high intensity and proximity to the substrate peak. Intuitively one expects, as the thickness of the PbTiO3 layers relative to the SrTiO3 layers is reduced, a decrease of the ferroelectric polarization which should result in a concomitant decrease of the average lattice parameter. The measured average c axis lattice parameters as a function of the thickness of the PbTiO3 layer thickness are shown in Fig. 3. For comparison, we also show the average c axis lattice parameters obtained by fixing c of SrTiO3 at its paraelectric cubic value 3.905 Å and taking c of PbTiO3 in two limiting cases: first, at the value 4.022 Å corresponding to a hypothetical paraelectric tetragonal structure coherent with the substrate (solid line)Lichtensteiger and then at the fully polarized bulk value 4.152 Å (dashed line). As can be seen in Fig. 3, superlattices with thick PbTiO3 layers have “large” average lattice parameters clearly suggesting a ferroelectric polarization. On reduction of the layer thickness the average lattice parameter decreases and approaches the solid line. However, surprisingly, after reaching this line superlattices with very small PbTiO3 layer thicknesses display larger average lattice parameters which indicate a recovery of ferroelectricity.
This behavior was confirmed using atomic force microscopy (AFM) which allows the ferroelectric domain structure to be modified and detected on a local scaleParuch01 . Applying a voltage between the metallic tip of the AFM and the metallic substrate, stripes were “written” (poled) using alternatively positive and negative voltages. Piezoelectric atomic force microscopy (PFM) was then used to detect the domain structure. PFM images are shown in the insets of Fig. 3 for different superlattices, the contrast revealing domains with up and down polarization. As can be seen, the 1/3, 2/3 and 13/3 samples reveal a clear domain structure and are indeed ferroelectric whereas no significant contrast could be obtained in the 3/3 superlattice, confirming the behavior suggested by the x-ray analysis. The written domains for all samples in which domains could be written were confirmed to be stable for a number of days. All domains written into the down direction have the same piezoelectric response as the existing background, implying that before writing the entire sample is uniformly poled in the down direction, demonstrating that none of the samples formed a polydomain state. This is a particularly important observation for the 1/3 and 2/3 samples since a multidomain configuration could possibly explain the observed increase in average c axis lattice parameter at very small PbTiO3 layer thicknesses.
To understand the observed behaviour, a simple electrostatic model similar to the one proposed by Junquera and Ghosez Junquera2003 has been developed. The total energy per unit cell area of an superlattice is written as
| (1) |
where and are the total energies per 5-atom unit cell of bulk PbTiO3 and SrTiO3 in zero field as a function of their polarization and (assumed to be homogeneous in each layer) and is the macroscopic electrostatic energy resulting from the presence of non-vanishing electric fields in the layers when and differ.
The electrostatic energy of a given layer, of thickness or , in the presence of a finite electric field , to leading order in the field, is . In the superlattice, the electric fields and are determined by and through the condition of continuity of the normal component of the electric displacement field at the interfaces:
| (2) |
For a system under short-circuit boundary conditions, the potential drop along the structure must vanish so that
| (3) |
Combining the last two conditions and summing the electrostatic energies of the PbTiO3 and SrTiO3 layers we obtain
| (4) |
The total energies and have been obtained from density functional theory (DFT) calculations on bulk compounds using the abinit package abinit . The calculations were performed within the local density approximation (LDA) using extended norm conserving pseudopotentials Teter with the Pb (5d,6s,6p), Sr (4s,4p,5s), Ti (3s,3p,3d,4s) and O (2s,2p) treated as valence states. Convergence was reached for a 1225 eV (45 Ha) cutoff and a mesh of special -points. We obtain computed lattice constants for cubic paraelectric SrTiO3 ( Å) and for tetragonal ferroelectric PbTiO3 ( Å, Å), with a polarization of 0.69 C/m2. Both materials lattice parameters are underestimated relative to the experimental values as is typical for the LDA. For each compound, and were obtained expansion following the formalism of Ref. NaSai, by relaxing the atomic positions and the lattice parameter at fixed polarization in the space group , constraining the in-plane lattice parameter to 3.846 Å. For bulk PbTiO3 constrained in plane to 3.846 Å the c axis lattice parameter was found to be 4.009 Å with a polarization of 0.73 C/m2. For any choice of and , minimization of Eq. 1 gives equilibrium values for and , and thus also for and .
To see whether the model correctly describes the behaviour as the thickness of the PbTiO3 layers decreases to the atomic scale, we performed full DFT-LDA calculations of the structure and polarization of PbTiO3/SrTiO3 superlattices for = 3 and = 1,… 7 with the Vienna ab initio Simulations Package (vasp) Kresse1996a , using projector augmented wave (PAW) potentials Blochl1994a ; Kresse1999a with the same valence configurations as in the abinit calculation. Convergence was reached for a 600 eV (22 Ha) cutoff and a mesh of special -points. The computed lattice constants are for SrTiO3, Å, and for tetragonal ferroelectric PbTiO3, Å and Å, with a polarization of 0.75 C/m2 calcnote . For the superlattices, the atomic positions and lattice parameter were fully relaxed in the space group , constraining the in-plane lattice parameter to 3.86 Å. Polarizations were calculated using the modern theory of polarization Vanderbilt1993 as implemented in vasp.
Fig. 4 (a) shows the evolution of the polarization as a function of for = 3. According both to the model and to the first principles local polarizations (not shown), the difference between the polarizations in the two layers is quite small, highlighting the large electrostatic energy cost of having different polarizations in the layers. As the ratio increases, the polarization of the superlattice asymptotically approaches the constrained bulk PbTiO3 value, though rather slowly due to the large energy cost of maintaining a high polarization in SrTiO3 . The figure inset shows the corresponding increase in the tetragonality (c/a) of the two layers, with the high polarization-strain coupling in the SrTiO3 layer (higher even than for the PbTiO3 layer expansion ) being evident. Both the model and the first principles calculations show a monotonic decrease of the polarization as the PbTiO3 volume fraction is reduced, due to the increase in the relative energy cost of the polarization in the SrTiO3 layers. While the polarization vs thickness curve for the model at the lowest thicknesses is shifted to lower polarizations relative to the first principles results, the model works overall very well, considering the simplifying assumptions and lack of any adjustable parameters.
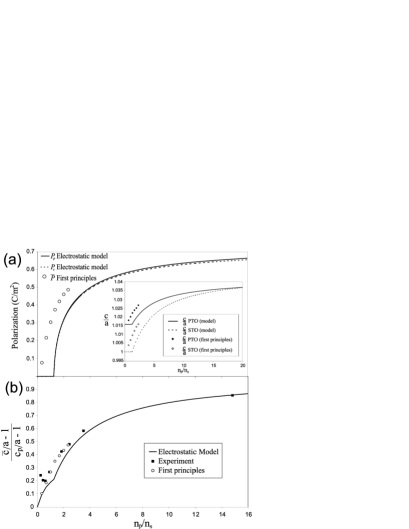
In Fig. 4 (b) we compare results from the first principles calculations (open circles), the electrostatic model (solid line) and experiment(solid squares), by plotting the fractional change in the superlattice tetragonality relative to the tetragonality of bulk PbTiO3 with the in plane lattice parameter constrained to the SrTiO3 substrate calcnote . Good agreement between both theoretical approaches and experiment is seen for samples that are predominantly PbTiO3. It should be noted that both theoretical calculations are at zero temperature, whilst the experiments are conducted at room temperature. Specifically this means that samples predicted from first principles to be ferroelectric with a small polarization at zero temperature might be expected to be paraelectric in our room temperature experiment, as is observed in the case of the 3/3 sample. The fact that unexpected recovery of the ferroelectric polarization in the experimental 1/3 and 2/3 superlattices is observed in neither the electrostatic model, nor the first principles calculations, suggests that it is related to aspects not accounted for in our theoretical approaches, for example, the precise nature of the substrate-superlattice interface, some degree of intermixing at the superlattice interfaces, or the possible formation of a new entropically stabilized PbTiO3 phase similar to that formed under negative hydrostatic pressure in the first principles studies of Tinte et al Tinte2003 .
This work was supported by the Swiss National Science Foundation through the National Center of Competence in Research “Materials with Novel Electronic Properties-MaNEP”, the VolkswagenStiftung (project “Nano-sized ferroelectric hybrids”, I80 899), FNRS-Belgium (grant 2.4562.03), the European NoE FAME and ESF (THIOX) and DOE Grant DE-FG02-01ER45937.
References
- (1) H.Tabata, H.Tanaka, and T.Kawai, Appl. Phys. Lett. 65 1970 (1994).
- (2) Y. Ishibashi, N.Ohashi, and T.Tsurumi, Jap. J. Appl. Phys. 39 186 (2000).
- (3) O.Nakagawara, T.Shimuta and T. Makino, Appl. Phys. Lett. 77 3257 (2000).
- (4) T. Shimuta, O.Nakagawara and T.Makino, Jap. J. Appl. Phys. 91 2290 (2002).
- (5) J.B. Neaton and K.M. Rabe, Appl. Phys. Lett. 82 1586 (2003).
- (6) K. Johnston, X. Huang, J.B. Neaton and K.M. Rabe Phys. Rev. B 71 100103(R) (2005).
- (7) A.Q. Jiang, J.F. Scott, H. Lu and Z. Chen, J. Appl. Phys. 93 1180 (2003).
- (8) S. Rios et al., J. Phys. Cond. Matt. 15 305 (2003).
- (9) H.M. Christen et al., Appl. Phys. Lett. 68 1488 (1996).
- (10) J. Sigman et al., Phys. Rev. Lett. 88 097601 (2002).
- (11) M. Sepliarsky, S.R. Phillpot and D. Wolf, J. Appl. Phys. 90 4509 (2001).
- (12) M. Sepliarsky, S.R. Phillpot, M.G. Stachiotti and R.L. Migoni, J. Appl. Phys. 91 3165 (2002).
- (13) J.C. Jiang et al., Appl. Phys. Lett. 74 2851 (1999).
- (14) F. Le Marrec et al. Phys Rev B 61 R6447 (2000).
- (15) C. Bungaro and K.M. Rabe, Phys. Rev. B 65 224106 (2002).
- (16) C. Bungaro and K.M. Rabe, Phys. Rev. B 69 184101 (2004).
- (17) H.N. Lee et al., Nature 433 395 (2005).
- (18) I.P. Batra and B.D. Silverman, Solid State Commun. 11 291 (1972).
- (19) J. Junquera and P. Ghosez, Nature 422 506 (2003).
- (20) M. Dawber, P. Chandra, P.B. Littlewood and J.F. Scott, J. Phys. C. 15 L393 (2003).
- (21) C. Lichtensteiger, J.-M. Triscone, J. Junquera and P. Ghosez, Phys. Rev. Lett. 94 047603 (2005).
- (22) R. Cohen, Nature(London) 358 136 (1992).
- (23) D.D. Fong et al., Science 304 1650 (2004).
- (24) V. Nagarajan, J. Junquera et al., unpublished.
- (25) Landolt-Börnstetin, III, 16a, eds. K.H. Hellwege and A.M. Hellwege, Springer-Verlag (1981).
- (26) P. Paruch, T. Tybell and J.-M. Triscone, Appl. Phys. Lett. 79 530 (2001).
- (27) X. Gonze et al., Computational Materials Science 25, 478 (2002).
- (28) Na Sai, K. M. Rabe and D. Vanderbilt, Phys. Rev. B 66, 104108 (2002).
- (29) M. Teter, Phys. Rev. B 48, 5031(1993).
- (30) The calculations provide and . For in [eV/cell] and in [C/m2] : .
- (31) P.E. Blöchl, Phys. Rev. B 50 17953 (1994).
- (32) G. Kresse and J. Furthmüller, Phys. Rev. B 54 11169 (1996).
- (33) G. Kresse and D. Joubert, Phys. Rev. B 59 1758 (1999).
- (34) The abinit abinit and vasp calculations have been done with different pseudopotentials, cutoffs and exchange-correlation functionals, which collectively accounts for the difference in the c axis lattice parameter obtained for PbTiO3. For this reason we compare fractional changes in the structural parameters, rather than absolute values, as ns and np vary.
- (35) R. D. King-Smith and D. Vanderbilt, Phys. Rev. B 47 R1651 (1993).
- (36) S. Tinte, K.M. Rabe and D. Vanderbilt Phys. Rev. B. 68 144105 (2003).