Absence of molecular mobility on nano–second time scales in amorphous ice phases
Abstract
High–resolution neutron backscattering techniques are exploited to study the elastic and quasi-elastic response of the high–density amorphous (HDA), the low–density amorphous (LDA) and the crystalline ice Ic upon temperature changes. Within the temperature ranges of their structural stability (HDA at K, LDA at K, ice Ic at K) the Debye–Waller factors and mean–square displacements characterise all states as harmonic solids. During the transformations HDALDA ( K), LDAIc ( K) and the supposed glass transition with K no relaxation processes can be detected on a time scale ns. It can be concluded from coherent scattering measurements (D2O) that LDA starts to recrystallise into ice Ic at K, i.e. at the supposed . In the framework of the Debye model of harmonic solids HDA reveals the highest Debye temperature among the studied ice phases, which is in full agreement with the lowest Debye level in the generalised density of states derived from time–of–flight neutron scattering experiments. The elastic results at low indicate the presence of an excess of modes in HDA, which do not obey the Bose statistics.
pacs:
63.50.+x, 64.70.Kb, 78.70.CkI. INTRODUCTION
Water, although comprising one of the most simple molecules, reveals extremely complicated properties in its condensed states. In the solid state for example, there exist not only twelve well known crystalline phases but also a number of disordered structures Hobbs-Book ; Petrenko-Book . Two of the disordered structures are known as high–density amorphous (HDA) and low–density amorphous (LDA) ice, characterised by a molecular density of molec./nm3 and molec./nm3, respectively Mishima-Nature-1984 ; Mishima-Nature-1985 . The origin of a number of different disordered phases within a single substance, often referred to as amorphous polymorphism, has not been understood, yet. It has been conjectured on the basis of computer simulation results that HDA and LDA might represent the supercooled glassy structures of two different liquid phases of water Poole-PRE-1993 ; Poole-PRL-1994 ; Debenedetti-Book ; Mishima-Nature-1998 ; Stanley-PCCP-2000 . Obviously, this scenario implies the existence of a glass–transition designated by a glass–transition temperature .
From the experimental point of view, there is a number of results backing the findings from computer simulations. Structures equivalent to HDA and LDA can be obtained from the liquid by extremely fast quenching of m–droplets or from the gas phase by vapour deposition Narten-JCP-1976 ; Mayer-Nature-1982 ; Mayer-JCP-1983 ; Mishima-JCP-2001 ; Comment-0 . As far as LDA–type structures are concerned, they all transform exothermally to a crystalline cubic phase (ice Ic) at K on an endothermal plateau setting in at K, which has been observed by differential scan calorimetry (DSC) and other calorimatric experiments Handa-JCP-1986 ; Johari-Nature-1987 ; Handa-JPC-1988 ; Hallbrucker-JPC-1989 ; Hallbrucker-PM-1989 ; Johari-JCP-1990 ; Johari-JPC-1990 ; Mayer-JMS-1991 ; Johari-JCP-1991 ; Salzmann-PCCP-2003 ; Mishima-JCP-2004 . The very onset of the endothermal contribution has been interpreted as water’s in literature, whereby in LDA the lowest K of all low–density amorphous structures is discussed Handa-JPC-1988 .
A comparable has been deduced from DSC studies of different aqueous solutions, whose specific s extrapolate upon dilution toward the single value of 135 K Angell-AC-1976 ; Angell-CR-2002 . Finally, from observation of D2O–H2O interlayer mixing upon heating of LDA–type vapour deposited water a higher molecular mobility at K has been concluded Smith-Nature-1999 ; Smith-CP-2000 .
However, these experimental results do not establish unequivocally a glass–transition or a glass–transition temperature in water. For each of the cited experiments there can be found at least one experiment reported in literature whose results either contrast the glass transition scenario or give an alternative explanation for the observed phenomena. For example, endothermal transitions have been observed at the same thermodynamic conditions in transformations of high–density crystalline ice phases to ice Ic. They are understood as entropy driven order disorder transitions in the proton sublattice of the phases Handa-JDP-1987 ; Handa-CJC-1988 ; Salzmann-PCCP-2003 a feature equally detected in ice Ic Yamamuro-JPCS-1987 . In this context, it is noteworthy that recently well established DSC results on apparent LDA samples Hallbrucker-JPC-1989 ; Johari-JCP-1990 ; Mayer-JMS-1991 ; Johari-JCP-1991 had to be reinterpreted as such a reversible order disorder transition in the proton sublattice of ice XII Salzmann-PCCP-2003 . The very low K reported in Handa-JPC-1988 remains to be reexamined Salzmann-PCCP-2003 . Consequently, one may ask what is the unique dynamic feature by which, on the one hand, the endothermic plateau in the amorphous systems is interpreted as a glass–transition but, on the other hand, it is identifiied in the crystalline structures as a disorder phenomenon of the proton sublattice only. Whether the recently observed endothermic effect in pressure dependent experiments on emulsified amorphous samples is a unique feature of the disordered system requires equally a closer examination Mishima-JCP-2004 .
In contrast to the D2O–H2O interlayer mixing effect Smith-Nature-1999 ; Smith-CP-2000 ion diffusion experiments have not shown any higher mobility of guest molecules in the amorphous ice matrix Tsekouras-PRL-1998 neither have isotopic exchange measurements shown any translational motion of water molecules Fisher-JPC-1995 . Instead, they have given the picture of a defect promoted proton mobility responsible for the endothermic transition, a feature directly detectable by Nuclear Magnetic Resonance in crystalline ice and clathrate hydrates Fujara-JCP-1988 ; Kirschgen-PCCP-2003 .
Recently, models of a so called shadow glass–transition have been proposed that explain the thermal anomalies observed at K with a real but experimentally unaccessible glass–transition at K Velikov-Science-2001 . Whether this shadow glass–transition could be indeed applicable to water is the issue of current debates Johari-JCP-2003 ; Yue-Nature-2004 .
Another idiosyncratic feature which has not been satisfactorily explained, yet, is the inelastic response of the amorphous ice structures. Dynamic properties of bulk HDA, LDA and LDA–type structures differ strongly from established features of supercooled glassy systems Sokolov-PRL-1997 ; Sette-Science-1998 . The dynamic response of LDA does not exhibit any phonon damping Schober-PRL-2000 ; Koza-PhD-2001 , any remarkable Boson–peak Koza-PhD-2001 ; Koza-ILL-Report ; Schober-PB-1998 ; Yamamuro-JCP-2001 , and any two–level systems (TLS) Agladze-PRL-1998 ; Agladze-EPL-2001 ; Agladze-PB-2002 . Consequently, its spectral density and thermal conductivity are reminiscent of a harmonic crystalline state Andersson-PRB-2002 . In the case of HDA, this departure from the characteristics of glassy states is apparently less pronounced, since TLS modes have been unequivocally observed in optical absorption experiments Agladze-PRL-1998 ; Agladze-EPL-2001 ; Agladze-PB-2002 . Similar features are observed by inelastic neutron experiments Svensson-PB-1994 ; Tulk-APA-2002 ; Tse-PRL-2000 , where an excess of modes in the density of vibrational states is reported. However, the detailed phonon dispersion and also the spectral density at K of HDA are identified as crystal–like in other experiments pointing at an intriguing high degree of short–range order Koza-PRB-2004 ; Schober-PRL-2000 .
In the light of the above outlined experimental facts the idea of HDA and LDA being strongly disordered crystalline systems not thermodynamically connected to water’s liquid phase Johari-PCCP-2000 , may at first glance seem rather tempting. Such a nano–crystalline scenario has been discussed for water Johari-PCCP-2000 but also for other systems showing amorphous polymorphism Tarjus-JPCM-2003 . A discontinuity between the liquid state, vapour deposited and hyper–quenched amorphous water on the one hand and LDA on the other hand has been indeed postulated based on theoretical concepts and results from spectroscopic experiments and computer simulations Tse-Nature-1999 ; Klug-PRL-1999 ; Johari-JCP-2000 ; Shpakov-PRL-2002 . Giving the subject some further thinking it becomes, however, obvious that a nano-crystalline scenario does not provide a more stringent explanation for the absence of glassy features in the dynamics. The inherently high disorder within the nano-crystals should leave a clear trace in the low-frequency dynamics not too different from that of a glassy state.
To advance the question further it is obviously indispensable to characterize the fundamental, microscopic relaxation processes responsible for the endothermic plateau in DSC experiments. This characterization must be carried out both in time and space. While order–disorder phenomena and the glass relaxation may take place on similar time scales the spatial correlations are different. In particular, the spatial patterns should allow to discern the hypothetical relaxation channels of the glass–transition from processes observed during the transitions of high–density crystalline structures to ice Ic.
The present work represents our first attempt of scrutinizing the glass–transition hypothesis of water with a supposed K on a microscopic scale by neutron backscattering and time–of–flight techniques, i.e. by spectroscopic techniques sampling time and spatial correlations. Both techniques have been extensively used for studying glass transition phenomena and proved to be substantial for their understanding. Both, time–of–flight and backscattering spectroscopy offer the opportunity of studying the microscopic dynamics of a sample directly as an energy resolved response. In addition, neutron backscattering can be also used to exploit the elastic scattering within a narrow energy range eV from which important dynamic properties can be deduced Springer-Book ; Bee-Book . This enables us, in principle, to characterise relaxation processes on a molecular scale during the apparent glass–transition.
All experiments performed reveal that the properties of HDA and LDA follow a temperature dependence in complete accordance with the harmonic theory of the solid state Bee-Book ; Lovesey-Book . Beyond the low–temperature limit, where zero–point oscillations are predominant, the molecular mean–square displacements of HDA and LDA are proportional to the temperature increase. This behaviour is expected if the degrees of freedom, and thus the spectral density of the sample in its different states is determined by harmonic modes only. The very good conformity with the mean–square displacements deduced from the phonon densities of states of HDA and LDA reinforces this scenario. In the temperature regime of the transitions HDA LDA and LDA ice Ic comprising the apparent glass–transition with K no higher mobility of water molecules, e.g., in terms of translational diffusion, is observed on a time scale shorter than some nano–seconds. From experiments on coherently scattering samples the temperature K is identified as the onset of a recrystallisation of LDA into ice Ic Geil-PCCP-2004 . In addition, an excess of modes in HDA, that however does not follow the Bose–statistics valid for harmonic vibrations, is clearly indicated in the values of the zero–point oscillation.
To bring these findings clearly forward the present paper
is structured in the following way.
The next two chapters render some useful details on the applied
neutron scattering techniques, the samples and experimental procedure,
and introduce some observables (Debye–Waller factor,
mean–square displacement, density of states, velocity
of sound), to which we refer throughout the text.
In section IV, we present and discuss the experimental data in view of
the studied transitions (HDA LDA,
LDA Ic, and the glass–transition),
the Debye–Waller factor and mean–square displacement,
and the excess of modes in HDA.
All results obtained are summarised in section V.
II. EXPERIMENTAL
To meet the requirement of high energy resolution the experiments have been performed on the neutron backscattering spectrometers IN13 and IN16 and the time–of–flight spectrometer IN6 at the Institut Laue Langevin in Grenoble, France yellow-book . The principles of the backscattering spectrometers are based on the neutron beam monochromatization and the energy analysis of the scattered beam by single crystal Bragg reflection
| (1) |
in backscattering geometry Springer-Book ; Bee-Book . Using the CaF2(422) reflection on IN13 and the Si(111) on IN16 the incident neutron energies () and energy resolutions () of meV, eV and meV, eV are obtained, respectively. Beyond the differences in incident energy and energy resolution these spectrometers are optimised for sampling complementary –ranges. IN16 with Å-1 is best utilised for e.g. long range diffusion processes with a correlation length of Å. IN13 with Å-1 is optimised for short range diffusion with Å. Thus, with both instruments we are able to cover a spatial range stretching from correlations within the proton sublattice of water up to its intermolecular distances.
In general, backscattering spectrometers can be utilised in two different modes. Firstly, in the elastic scan mode, the incident neutron energy is kept constant to permanently meet the Bragg condition of the analyser given by eq. 1. The elastic scan mode samples changes of the elastic intensity within due to dynamic and relaxation processes which may be induced by changing experimental parameters like temperature in the present case. Secondly, in the energy scan mode, the incident neutron energy is varied in a well defined, systematic way within a narrow energy range , e.g., eV on IN16. In the energy scan mode, dynamic and relaxation processes can be, in principle, characterised quantitatively. Both, energy and elastic scan mode, were applied on the spectrometer IN16 whereas IN13 was used in the elastic scan mode exclusively.
The time–of–flight spectrometer IN6 was used with incident energies of 3.1 meV ( eV) and 4.8 meV ( eV). The sampled –ranges of 0.3–2.1 Å-1 (3.1 meV) and 0.3–2.6 Å-1 (4.8 meV) matched the regime of the IN16 measurements. However, the energies probed by the instrument IN6 correspond to dynamic processes on a time scale of pico–seconds.
In detail, we studied two fully protonated samples on IN16, one sample, S3, in elastic scan and a second, S4, in energy scan mode, and two samples on IN13, sample S2 fully deuterated and sample S1 partially protonated with vol. H2O. Three fully deuterated samples were measured on IN6. The deuteration was employed for a better control of the sample state via the pronounced coherent scattering contribution of D2O to the signal and for an enhanced signal contribution from the Oxygene atoms. Figure 1 shows the elastic intensity of the samples S1 and S2 in the HDA and the LDA state in comparison to the structure factor of fully deuterated HDA and LDA measured with high resolution on the diffractometer D20 at the Institut Laue Langevin Koza-JPCM-2003 . The coherent signal of the partially protonated sample is, as expected, strongly suppressed and the scattering characteristics are reminiscent of the incoherent contribution.
All samples were prepared by compression of crystalline ice Ih at K (in liquid N2) in a piston–cylinder apparatus up to kbar Koza-PRL-2000 . The formed HDA was recovered at ambient pressure, filled into Aluminum holders used as standard in neutron scattering and placed into precooled ( K) standard cryostats. After remaining N2 had been carefully removed at K the samples were cooled down to K. Table 1 gives details on the thermal treatment and thermal cycling applied to the samples during the experiments. Data were accumulated on IN13 for 60 min per point with the samples gradually heated corresponding with a rate of 3.5 K/60 min. IN16 elastic scan data were accumulated for 2 min with a heating rate of 1 K/2 min. IN16 inelastic scan data were accumulated for min with a heating step of 2 K in the range of the supposed glass transition, whereby in situ data updates were performed every 10 min giving, within the data statistics, identical results as obtained after 90 min acquisition time. As for the LDA state the thermal treatments resulted in phases which had been annealed for 2 h at 125 K plus 1 h at 128.5 K on IN13 and for 1 h at 130 K and a preceeding slow heating on IN16 before the regime of the apparent glass transition was reached. Thus, annealing times and heating rates corresponded with treatments performed in DSC experiments on water’s reported in literature.
Samples measured at IN6 were subject to a comparable thermal cycling procedure whereby the LDA structure was annealed at 127 K and ice Ic was annealed at 160 K. Measurements following the glass–transition have been performed at the temperatures K for min., at K for min., at K for min., at K for min., at K for min., at K for min. and at K for min. before annealing the formed ice Ic at 160 K. Long time measurements of 4–6 hours were carried out with HDA at 2 K, 20 K, 40 K, 60 K and 80 K, with LDA at 2 K, 20 K, 40 K, 60 K, 80 K and 127 K, and ice Ic at 127 K and 160 K.
| phase | sample S1 | sample S2 | sample S3 | sample S4 |
|---|---|---|---|---|
| HDA | 2652125 K | 2125 K | 2130 K | 2160 K |
| LDA | 2170 K | 2170 K | 2260 K | – |
| ice Ic | 2170 K | – | – | – |
Standard data corrections were performed, accounting for empty container and background scattering, self-shielding, absorption effects of the samples and for efficiencies of the instrument detectors. However, due to the scattering power of the samples (optimised for multiple scattering behaviour) and the negligible absorption of the scatterers only minor perturbations of the signal were observed. Nevertheless, the elastic signal measured in the low– range on the spectrometer IN16 encounters a lower sensitivity to temperature changes in comparison to the results taken on IN13. This feature is well reported in literature and associated with contribution from multiple scattering processes Wuttke-PRE-2000 . Depending on the information which is to be extracted from the experimental data, different normalisation standards have to be used. These standards are explicitely described in the text below.
For a clear presentation of the extensive amount of data some data sets have been regrouped to give statistical errors of the order of the data symbols. Error bars are plotted with the data in the figures. The grouping is explicitly indicated in the figure captions for data whose interpretation exceeds a pure qualitativ description. All fitting routines were performed with ungrouped data sets. The simplex minimization algorithm was applied having taken into account the x–grid and y–error of the fitted data.
Please note, that we focus primarily on the backscattering measurements
due to the superior resolution of the instruments, when discussing
potential relaxation processes during the phase transitions HDA
to LDA and LDA to ice Ic.

III. OBSERVABLES IN NEUTRON SCATTERING
For the convenience of the reader let us summarise some basic principles of neutron scattering as they are needed for the comprehension of the data analysis and the discussion. A more detailed introduction into this field can be found in textbooks on neutron scattering Springer-Book ; Bee-Book ; Lovesey-Book . At the beginning we restrict our consideration to a harmonic system whose scattering characteristic is assumed to be isotropic. These terms are well met by amorphous solids. For such a system the intensity measured in an elastic scan mode neutron scattering experiment can be written as
| (2) | |||||
| (3) |
with the Debye–Waller factor, the mean–square displacement of the scatterers, and the static structure factor, which may be approximated for incoherent scattering by a scaling factor representing the number of scatterers in the sample Comment-0b . Harmonicity implies that can be related to the density of states denoted as as
| (4) |
representing the mass of the scatterers Comment-0c . Taking the low and high temperature limits into consideration can be asymptotically approximated by the moments of energy und as
| (5) | |||||
| (6) |
As a consequence, the mean–square displacement is expected to cross over from a constant value at low temperatures to a behaviour upon heating leading to the relation
| (7) |
Please note, that measured in neutron scattering experiments is not the absolute zero–point oscillation of the scatterers. Its value depends on the incident neutron energy. This energy sets a limit to the energy range on which the spectral density of the scatterers is sampled at K. However, denotes a well defined quantity which makes possible to draw comparative conclusions upon the properties of different sample states under identical experimental conditions.
Going back to eq. 2, we can quantitatively determine two physical effects which can induce changes in the observable elastic intensity . Firstly, the structure of the sample detectable as can change due to phase transformations. Secondly, the spectral density can alter and influence both the low and high temperature properties of via eqs. 5 and 6, respectively. From the experimental point of view neutron scattering offers the opportunity of discerning these two points by utilising, on the one hand, incoherent scatterers (protonated samples S1, S3 and S4) to study changes in and, on the other hand, coherent scatterers (deuterated samples S2) to measure also changes in .
Finally, utilising the Debye approximation for Ashkroft-Book
| (8) |
with the average velocity of sound
| (9) |
the observables and given in eqs. 5 and 6 can be compared qualitatively and quantitatively with results from other experimental techniques accessing the velocity of sound. Within the Debye model a characteristic quantity is the Debye temperature
| (10) |
with the density of vibrational modes of the system, which can be also extracted by numerical techniques from eq. 4 as
| (11) |
IV. RESULTS AND DISCUSSION
IV.a. Phase transformations and glass–transition
To give an overview on the temperature dependence of the elastic signal and its changes during the thermal treatment, Fig. 2 reports on the intensity measured in elastic scans with S1 on IN13 and S3 on IN16. is the intensity integrated over the accessible range of the instruments. The data sets are normalised to the intensity detected at K in the crystalline cubic phase Ic (S1, IN13) and LDA (S3, IN16). The phase transformations HDA LDA and LDA Ic can be identified in both samples as rather sharp intensity gains in the elastic response at K and K. They are indicated by vertical arrows. Additionally, a small step in intensity at K indicates the formation of the hexagonal crystal from ice Ic as reported in reference Handa-JCP-1986 ; comment-iceIh .
At sufficiently high ( K), the intensity of all phases decreases linearly upon heating in the logarithmic presentation of Fig. 2. This behaviour is stressed by solid lines. Neither in the range of HDALDA nor in the regime of the LDAIc and, thus, the assumed glass–transition, a pronounced drop off in can be detected. Such a drop off would be a mandatory fingerprint for an enhancement in molecular mobility of the sample (eq. 2) on time scales less than a few nano–seconds.

A missing enhancement in molecular mobility is also confirmed by energy scan measurements with the incoherently scattering sample S4 on IN16. Spectra measured at different temperatures are reported in Fig. 8. To compensate for the here nonrelevant temperature dependence of the elastic intensity the data are normalised to the maximum intensity at the respective temperatures. The identity of all spectra demonstrates that within the instrumental resolution of 1 eV no relaxation processes are present in the sample. From the comparison of the different data to the results measured at 2 K it is evident that the spectra do not change markedly their shape in the energy window of 10 eV, regardless of the state of the sample (The contribution of phonons in this energy window is too weak to leave a trace in the temperature dependence.) In accordance with the IN16 data, no change of the inelastic response apart from the normal harmonic phonon contribution can be observed in the IN6 experiments at temperatures prior to the recrystallisation of the amorphous samples. We may conclude that according to eqs. 2 and 3 there is no evidence for a development of additional decay channels for the elastic intensity at the assumed glass transition with K. There is no evidence of relaxation behaviour in the course of the transformations HDA LDA and LDA Ic, either. Consequently, the presence of relaxation processes like translational diffusion over intermolecular distances on a time scale shorter than some nano–seconds can be excluded.

Before we will discuss the Debye–Waller factor in detail and, thus, the potential relaxation processes on shorter length scales, it is important to establish the regime of stability of the amorphous structures. We focus here primarily on the supposed glass transition and the LDA Ic transformation. Fig. 4 reports on the elastic intensity measured with S2 on IN13 at different temperatures which correspond to the regime of the glass transition. The temperatures are indicated by vertical arrows in Figure 4 c. Here, is normalised to of LDA determined at 2 K. It gives, therefore, the relative changes before and after the conversion of LDA into Ic. The two arrows indicate the values at which the temperature dependent intensity is plotted in Figure 4 a and b. As it is expected from a harmonic system exhibits up to 130 K only a loss of intensity due to the Debye–Waller factor (eq. 3). Whereas at 170 K shows a detailed –dependence arising from changes in (eq. 2). The sharp maxima are Bragg–reflections of crystalline cubic ice as it is presented in detail in reference Geil-PCCP-2004 .
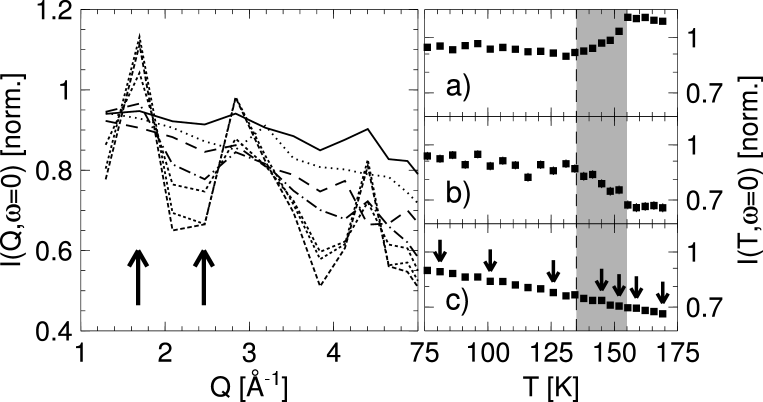
The temperature dependence of the elastic intensity
is reported in the right panel of Fig. 4.
Plotted data are taken at Å-1 (Fig. 4 a)
and Å-1 (Fig. 4 b).
Figure 4 c shows the signal integrated over
the accessed range.
It is evident from Figure 4 c that despite
the intensity gain at the Bragg reflections (Fig. 4 a)
and intensity loss between (Fig. 4 b)
the total scattering power in the accessed range
does not show any anomalies in the temperature range
of the supposed glass transition.
In conclusion, the behaviour of in
Fig. 4 gives evidence of a redistribution
of the signal within the elastic channel only,
which is compatible with a recrystallisation of the LDA matrix.
This recrystallisation is obviously slow at K but
very efficient above 150 K Hage-JCP-1994 ; Hage-JCP-1995 ,
causing the rapid gain in
shown in Fig. 2.
The very onset of the recrystallisation matches with the
supposed glass transition temperature K
that is indicated by the dashed vertical line in Figure 4.
IV.b. Debye–Waller factor and mean–square displacement
As it is outlined in section III the Debye–Waller factor of a harmonic system obeys the simple relation . Figures 5 and 6 show the – and the –dependence of some selected data sets for the samples S1 and S2 measured on IN13. Since, the zero point oscillation of the scatterers is of no importance for the discussion of here, the presented data sets are normalised to the signals measured at 2 K. It is obvious from Fig. 5 that all phases, HDA, LDA, and ice Ic, display a –dependence and are (meeting the requirement of sufficiently high temperature) proportional to . The linearity in is equally fullfilled for the elastic intensity of S2 plotted in Fig. 6 up to temperatures close to the transformations of the phases. Grey shaded areas in Fig. 6 indicate the transformation regions, in which the structural correlations change, as it is shown in Fig. 4. The –dependence is as well fulfilled for HDA and LDA in S2 as it is for HDA, LDA and Ic in S1, which is demonstrated by fits plotted as solid lines in Figs. 5 and 6.

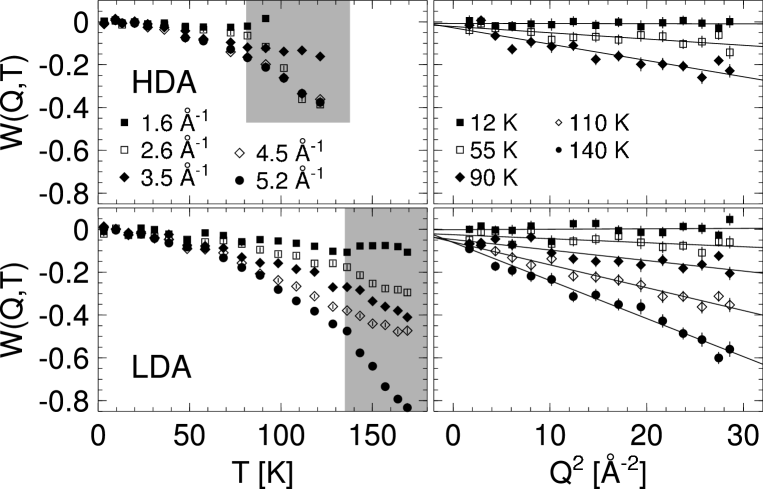
According to eq. 3 the slopes of the fits correspond to the mean–square displacement of the scatterers. They are shown for both S1 and S2 in Fig. 7. Despite the different levels of deuteration of S1 and S2 the of both samples in the HDA and LDA states are comparable. Please note that the onset of structural changes, which the samples encounter during the phase transitions, is demonstarted by the strong enhancement of statistical uncertaintity. The comparable values of both samples in the corresponding phases can be understood when taking into consideration that at the exploited temperatures is strongly influenced by the mean velocity of sound (eq. 9). It has been shown that for the crystalline hexagonal ice Ih the level of deuteration does not change markedly the elastic constants or thermodynamic observables being determined by the vibrational properties Petrenko-Book ; Ermolieff-SSC-1975 ; Leadbetter-PRS-1965 . This means that the velocity of sound does not alter strongly with the level of deuteration. For example, a difference of only 3% was found in specific heat measurements of crystalline ice at K as an effect of deuteration Leadbetter-PRS-1965 . A similar behaviour can be expected in the phases studied here.

Assuming that the Debye model is applicable a Debye temperature can be extracted from fits to via eq. 11. Fit results are plotted as solid (S1) and dotted (S2) lines in Fig. 7 and the obtained are given in Table 2. The upper fitting limits are given by the transition temperatures which are obtained with sample S2 and shown in Fig. 6.
| phase | sample S1 | sample S2 | from Gromnitskaya-PRB-2001 |
|---|---|---|---|
| HDA | 230 6 K | 223 9 K | 230 K |
| LDA | 217 2 K | 202 3 K | 203 K |
| ice Ic | 224 7 K | – | 203 K |
Another observable in neutron scattering from which can be calculated is the density of states (eq. 4). Figure 8 reports measured on the time–of–flight spectrometer IN6 Koza-ILL-Report ; Schober-PB-1998 ; Koza-PhD-2001 . The plotted are calculated from data measured at 80 K (HDA), 127 K (LDA) and 160 K (ice Ic). Within the statistical accuracy of the measurements performed at different no daviations from the presented could have been established. A self consistent multi–phonon calculation was applied to the data in addition to the standard correction procedures Koza-PhD-2001 ; Reichardt-muphocor .

Since the data are obtained with a fully deuterated, coherently scattering sample the determined is an approximation to the true density of states Bredov-SPSS-1967 ; Oskotskii-SPSS-1967 ; Taraskin-PRB-1997 . To account for the perturbations by the coherent scattering a correction factor is introduced. This factor is estimated independently comparing of hexagonal ice Ih and ice XII measured on fully deuterated and fully protonated samples Koza-inprep . The Debye levels of the samples are indicated in Fig. 8 and compared to the Debye levels obtained in ultrasonic experiments on ice Ic Gromnitskaya-PRB-2001 and Brillouin light scattering on ice Ih Gagnon-JCP-1990 , both techniques giving comparable values. Taking and from Fig. 8 into account, a is calculated to the values presented as dashed lines in Fig. 7.
Within the statistics of the measurements and the accuracy of the applied data analysis the results obtained from backscattering and time–of–flight measurements fully agree. For example, in the framework of the Debye model both techniques indicate the highest average velocity of sound and, thus, the highest for HDA. Debye temperatures estimated via eq. 10 from results based on supersonic measurements Gromnitskaya-PRB-2001 are included in Table 2 and their respective Debye levels for are indicated in Fig. 8. Although obtained with a different technique the match nicely the values observed in our elastic neutron scattering experiments giving also a higher value for for HDA Comment-2 .
We would like to recall the fact that the coherent character of the sample introduces uncertainties into although these are well controlled Koza-inprep . Thus, the excellent agreement of with calculated from the Debye–Waller factor should not be over-interpreted. However, qualitatively the results on and , which are determined by studying the elastic signal, and, on the other hand, the data on , which is obtained from the inelastic response, give a coherent picture of the properties of HDA, LDA and ice Ic. They mark them unequivocally as harmonic systems.
Finally, we discuss the Debye temperatures determined by specific heat measurements Handa-JCP-1986 as 288 K for HDA, 305 K for LDA and 325 K for ice Ih. The fundamental difference is that is determined here for , i.e. within the validity limits of the Debye model. For this range specific heat measurements on ice Ih give values of about 200 K with a difference of less than 3 % at K between deuterated and protonated samples Leadbetter-PRS-1965 , as it was already indicated above. At elevated temparatures the specific heat reflects the details of the phonon density of states beyond the acoustic region and the extracted becomes temperature dependent Ashkroft-Book . Taking only translational modes, i.e. phonons, into consideration the of ice Ih reaches a maximum at K with K Leadbetter-PRS-1965 . Consequently, the basic difference of about 100 K between the presented here and cited in Handa-JCP-1986 is due to the applied experimental techniques and the thermodynamic conditions of the measurements, but the data do agree in the general concept of harmonic solids Ashkroft-Book ; Lovesey-Book .
The low value of of HDA given in Handa-JCP-1986
can be, on the one hand, understood by the temperature
sensitivity of in the specific heat measurements.
At about 100 K not only phonons but also librations contribute
to Leadbetter-PRS-1965 ; Koza-PhD-2001 ; Koza-inprep .
It is well established by experiments that the librational band
shifts toward lower energies the higher the density of the
ice phase is.
The shift of the librational band in HDA raises the
specific heat and consequently pulls below the value of
crystalline ice Schober-PB-1998 ; Klug-PRB-1991 ; Koza-PhD-2001 .
This effect is well comparable with the issue of deuterating
a crystalline sample Leadbetter-PRS-1965 ; Koza-PhD-2001 .
On the other hand, it must be stressed that the sample referred
to as HDA in Handa-JCP-1986 was annealed before the measurements
raising the question of the sample state.
In the case of a mixture of HDA–type and LDA–type phases
or even a contribution of ice XII
Koza-JPCM-2003 ; Koza-inprep ; Salzmann-PCCP-2003
the density of states would decrease
more efficiently when increasing .
VI.c. Excess of modes at low T
So far we have not discussed the zero point oscillation of the scatterers in HDA, LDA and ice Ic which is indicated in Fig. 2. Indeed, bearing in mind that the elastic intensity is coupled to the inelastic response (eqs. 2, 3, 4, 5) there is an inconsistency concerning the behaviour of HDA. Since, among all phases the lowest Debye–level is detected for HDA (Fig. 8), it strictly requires the highest elastic intensity at K. However, HDA exhibits the lowest measured in all our experiments (Fig. 2). It must be notified that this inconsistency with holds also for results from other experiments exploiting the dynamic response of the phases Schober-PB-1998 ; Gromnitskaya-PRB-2001 ; Schober-PRL-2000 ; Koza-PRB-2004 .
Moreover, the Debye–Waller factors , the mean–square displacements , and the Debye temperatures calculated from the elastic scan measurements itself display a dependence on temperature which is in full agreement with the determined by time–of–flight techniques. Consequently, the temperature evolution of the elastic intensity of HDA contradicts its own value at very low temperatures .
This self–contradicting behaviour of HDA can be resolved,
if not only phonons, i.e. excitations following the Bose
statistics, are inherent to the dynamic response but
also non–Bose modes predominant at low temperatures
are present.
Such modes have been detected for the first time
by three axis neutron scattering (TAS)
Svensson-PB-1994 ; Tulk-APA-2002 ,
confirmed later and interpreted as the contribution
of two–level systems (TLS) to the inelastic response of HDA
Agladze-PRL-1998 ; Agladze-EPL-2001 ; Agladze-PB-2002 ; Tse-PRL-2000 .
Remarkably, no TLS are observed in the LDA state.
Please note, that the level of deuteration of the sample has no
significant influence on the TLS intensity
Agladze-PRL-1998 ; Agladze-EPL-2001 ; comment-deuteration .
V. SUMMARY AND CONCLUSIONS
We utilised the neutron back–scattering and time–of–flight techniques to gain information on the temperature dependence of the high–density (HDA) and low–density (LDA) amorphous states of ice and the crystalline phase Ic. Particular focus was put on the phase transformations HDA LDA, LDA Ic and the supposed glass–transition of LDA with K, the mean–square displacements of the scatterers in the stable states HDA, LDA and Ic, and their relative zero point oscillations.
Within the best energy resolution of 1 eV of the experiments no relaxation processes, giving evidence of a higher mobility of the scatterers, can be identified during the phase transformations. From results on coherently scattering samples, we may conclude that at or prior to K, i.e., at the very discussed in literature, the recrystallisation of LDA into Ic sets in – thus preventing any data analysis in terms of Mode Coupling Theory as it is oulined in Geil-PCCP-2004 .
The temperature and –dependence of the Debye–Waller factors and the resulting mean–square displacements mark HDA, LDA and ice Ic as harmonic solids. In the framework of the Debye model HDA reveals a higher Debye temperature, a higher average velocity of sound, and thus a lower phonon density of states at low energy when compared with LDA and ice Ic. LDA and ice Ic show rather similar dynamic properties. The conclusions drawn from the elastic scan data on the temperature dependence of all states are in full agreement with results obtained by other experimental techniques.
The relative elastic intensities determined at low temperatures support the existence of additional modes in HDA not obeying the Bose statistics, i.e. this excess should not be confused with a Boson–peak as it is identified in glassy systems Sokolov-PRL-1997 . These modes have been observed in inelastic neutron scattering Svensson-PB-1994 ; Tulk-APA-2002 , confirmed and interpreted as two–level systems from light absorption experiments Agladze-PRL-1998 ; Agladze-EPL-2001 ; Agladze-PB-2002 .
In the case of the protonated samples, the scattering from
hydrogen is by a factor of 40 stronger than the scattering
from oxygen.
Consequently, the signal measured with samples S3 and S4
is not only determined by the dynamic properties
of the water molecules but equally reflects the characteristics of
the hydrogen sublattice.
The absence of anomalies in the Debye–Waller factor excludes
therefore any strong proton relaxation within the matrix.
However, migration of lattice defects, as discussed in
references Fisher-JPC-1995 ; Fujara-JCP-1988 ; Kirschgen-PCCP-2003 ,
is not detectable due to their too low concentration.
ACKNOWLEDGEMENTS:
We wish to thank D.D. Klug and N.I. Agladze for helpfull discussions.
References
- (1) P.V. Hobbs, Ice Physics, Claredon Press Oxford, (1974).
- (2) V.F. Petrenko, and R.W. Whitworth, Physics of ice, Oxford University Press, (1999).
- (3) O. Mishima, L.D. Calvert and E. Whalley, Nature, 310, 393 (1984).
- (4) O. Mishima, L.D. Calvert and E. Whalley, Nature, 314, 76 (1985).
- (5) P.H. Poole, U. Essmann, F. Sciortino, and H.E. Stanley, Phys. Rev. E, 48, 4605, (1993).
- (6) P.H. Poole, F. Sciortino, T. Grande, H.E. Stanley and C.A. Angell, Phys. Rev. Lett., 73, 1632, (1994).
- (7) P.G. Debenedetti, Metastable Liquids – Concepts and Principles, Princton University Press, 1996.
- (8) O. Mishima and H.E. Stanley, Nature, 396, 329, (1998).
- (9) H.E. Stanley, S.V. Buldyrev, M. Canpolat, O. Mishima, M.R. Sadr–Lahijanin, A. Scala and F.W. Starr, Phys. Chem. Chem. Phys., 2000, 1551, (2000).
- (10) A.H. Narten, C.G. Venkatesh, and S.A. Rice, J. Chem. Phys., 64, 1106, (1976).
- (11) E. Mayer, and P. Brueggeller, Nature, 298, 5876, (1982).
- (12) E. Mayer, and R. Pletzer, J. Chem. Phys., 80, 2939, (1983).
- (13) O. Mishima, and Y. Suzuki, J. Chem. Phys., 115, 4199, (2001).
- (14) Please note that structures obtained by vapour deposition and hyper–quenching at ambient pressure, which are often referred to as ASW and HGW in literature, are comparable to the structure of the LDA phase BellFunel-JCP-1992 . Since our study is focussed on LDA exclusively, we refer to other low–density amorphous states as LDA–type phases or LDA–type structures.
- (15) M.C. Bellissent–Funel, L. Bosio, A. Hallbrucker, E. Mayer, and R. Sridi–Dorbez, J. Chem. Phys., 97, 1282, (1992).
- (16) Y.P. Handa, O. Mishima and E. Whalley, J. Chem. Phys., 84, 2766, (1986).
- (17) G.P. Johari, A. Hallbrucker and E. Mayer, Nature, 330, 552, (1987).
- (18) Y.P. Handa and D.D. Klug, J. Phys. Chem., 92, 3323, (1988).
- (19) A. Hallbrucker, E. Mayer, and G.P. Johari, J. Phys. Chem., 93, 7751, (1989).
- (20) A. Hallbrucker, E. Mayer, and G.P. Johari, Phil. Mag. B, 60, 179, (1989).
- (21) G.P. Johari, A. Hallbrucker and E. Mayer, J. Chem. Phys., 92, 6742, (1990).
- (22) G.P. Johari, A. Hallbrucker and E. Mayer, J. Phys. Chem., 94, 1212, (1990).
- (23) E. Mayer, J. Mol. Struc., 250, 403, (1991).
- (24) G.P. Johari, A. Hallbrucker and E. Mayer, J. Chem. Phys., 95, 6849, (1991).
- (25) C.G. Salzmann, I. Kohl, T. loerting, E. Mayer, and A. Hallbrucker, Phys. Chem. Chem. Phys., 5, 3507, (2003).
- (26) O. Mishima, J. Chem. Phys., 121, 3161, (2004).
- (27) C.A. Angell and W. Sichina, Ann. N.Y. Acad. Sci., 279, 53, (1976).
- (28) C.A. Angell, Chem. Rev., 102, 2627, (2002).
- (29) R.S. Smith, and B.D. Kay, Nature, 398, 788, (1999).
- (30) R.S. Smith, Z. Dohnalek, G.A. Kimmel, K.P. Stevenson, and B.D. Kay, Chem. Phys., 258, 291, (2000).
- (31) Y.P. Handa, D.D. Klug, and E. Whalley, J. de Physique, 48, C1–435, (1987).
- (32) Y.P. Handa, D.D. Klug, and E. Whalley, Can. J. Chem., 66, 919, (1988).
- (33) O. Yamamuro, M. Oguni, T. Matsuo, and H. Suga, J. Phys. Chem. Solids, 48, 935, (1987).
- (34) A.A. Tsekouras, M.J. Iedema, and J.P. Cowin, Phys. Rev.— Lett., 80, 5798, (1998).
- (35) M. Fischer, and J.P. Devlin, J. Phys. Chem., 99, 11584, (1995).
- (36) F. Fujara, S. Wefing, and W.F. Kuhs, J. Chem. Phys., 88, 6801, (1988).
- (37) T.M. Kirschgen, M.D. Zeidler, B. Geil, and F. Fujara, Phys. Chem. Chem. Phys., 5, 5247, (2003).
- (38) V. Velikov, S. Borick and C.A. Angell, Science, 294, 2335, (2001).
- (39) G. Johari, J. Chem. Phys., 119, 2935, (2003).
- (40) Y.Z. Yue and C.A. Angell, Nature, 427, 6976, (2004).
- (41) A.P. Sokolov, R.Calemczuk, B. Salce, A. Kisliuk, D. Quitmann and E. Duval, Phys. Rev. Lett., 78, 2405, (1997).
- (42) F. Sette, M.H. Krisch, C. Masciovecchio, G. Ruocco, and G. Monaco, Science, 280, 1550 (1998).
- (43) H. Schober, M.M. Koza, A. Tölle, C. Masciovecchio, F. Sette and F. Fujara, Phys. Rev. Lett., 85, 4100, (2000).
- (44) M.M. Koza, Studium der statischen und dynamischen Eigenschaften amorpher und kristalliner Wasserphasen und ihrer Phasenumwandlungskinetik, PhD, Technische Universität Darmstadt, (2001).
- (45) M.M. Koza, Report on the preparation and performance of time–of–flight experiments on the amorphous and polycrystalline solid D2O, Institut Laue Langevin, No.ILL97KO10T, (1997).
- (46) H. Schober, M. Koza, A. Tölle, F. Fujara, C.A. Angell and R. Böhmer, Physica B, 241–243, 897, (1998).
- (47) O. Yamamuro, Y. Madokoro, H. Yamasaki, and T. Matsuo, J. Chem. Phys., 115, 9808, (2001)
- (48) N.I. Agladze and A.J. Sievers, Phys. Rev. Lett., 80, 4209, (1998);
- (49) N.I. Agladze and A.J. Sievers, Europhys. Lett., 53, 40, (2001);
- (50) N.I. Agladze and A.J. Sievers, Physica B, 316-317, 513, (2002).
- (51) O. Andersson and H. Suga, Phys. Rev. B, 65, 14020(R), (2002).
- (52) J.S. Tse, D.D. Klug, C.A. Tulk, E.C. Svensson, and J. Swainson, Phys. Rev. Lett., 85, 3185, (2000).
- (53) E.C. Svensson, W. Montfrooij, V.F. Sears, and D.D. Klug, Physica B, 316-317, 513. (2002).
- (54) C.A. Tulk, D.D. Klug, E.C. Svensson, V.F. Sears, and J. Katsaras, Apll. Phys. A, 74, S1185, (2002).
- (55) M.M. Koza, H. Schober, B. Geil, M. Lorenzen, and H. Requardt, Phys. Rev. B,69, 024204, (2004).
- (56) G.P. Johari, Chem. Phys. Phys. Chem., 2, 1567, (2000).
- (57) G. Tarjus, C. Alba–Simionesco, M. Grousson, P. Viot, and D. Kivelson, J. Phys.: Cond. Matter, 15, 1077, (2003).
- (58) J.S. Tse, D.D. Klug, C.A. Tulk, I.Swainson, E.C. Svensson, C.–K. Loong, V. Shpakov, V.R. Belosludov, R.V. Belosludov and Y. Kawazoe, Nature, 400, 647, (1999).
- (59) D.D. Klug, C.A. Tulk, E.C. Svensson and C.–L. Loong, Phys. Rev. Lett., 83, 2584, (1999).
- (60) G.P. Johari, J. Chem. Phys., 112, 8573, (2000).
- (61) V.P. Shpakov, P.M. Rodger, J.S. Tse, D.D. klug, and V.R. Belosludov, Phys. Rev. Lett., 88, 155502, (2002).
- (62) T. Springer, Quasielastic neutron scattering for the investigation of diffusive motions in solids and liquids, in ”Springer Tracts in modern physics No.64”, Springer Verlag, (1972).
- (63) M. Bee, Quasielastic Neutron Scattering, Adam Hilger, (1988).
- (64) S.W. Lovesey, Theory of Neutron Scattering from Condensed Matter, Oxford Science Publications, (1984).
- (65) B. Geil, M.M. Koza, F. Fujara, H. Schober, and F. Natali, Phys. Chem. Chem. Phys., 6, 677, (2004).
- (66) The Yellow–Book Guide to neutron research facilities at the ILL, ILL, 1994.
- (67) M.M. Koza, H. Schober, H.E. Fischer, T. Hansen, and F. Fujara, J. Phys.: Condens. Matter, 15, 321, (2003).
- (68) M.M. Koza, H. Schober, T. Hansen, A. Tölle and F. Fujara, Phys. Rev. Lett., 84, 4112, (2000).
- (69) J. Wuttke, Phys. Rev. E, 62, 6531, (2000).
- (70) Please note that, although coherent and incoherent scattering has been exploited in this work we do not distinguish between the Mössbauer–Lamb and the Debye–Waller factor in the nomenclature. The last is used exclusively throughout the text.
- (71) In the energy range accessed in the present experiments the dynamic properties of the samples are determined by vibrational modes of water molecules ( meV). The number of scatterers and their mass can be therefore related to the water molecule.
- (72) N.D. Ashkroft, and N.W. Mermin, Solid State Physics, Sounders College Philadelphia, (1976).
- (73) Please note, that the formation of ice Ih cannot be characterised by a specific transition temperature. The step at K in our data results from the thermal treatment, i.e. the heating rate, applied during the measurement. The formation of ice Ih is stretched over a wide range of temperatures and was observed by us in other experiments on longer time scales already at about 200 K.
- (74) W. Hage, A. Hallbrucker, E. Mayer, and G.P. Johari, J. Chem. Phys., 100, 2743, (1994).
- (75) W. Hage, A. Hallbrucker, E. Mayer, and G.P. Johari, J. Chem. Phys., 103, 545, (1995).
- (76) A. Ermolieff, Solid State Comm., 17, 1013, (1975).
- (77) A.J. Leadbetter, Proc Roy. Soc. A, 287, 403, (1965).
- (78) W. Reichardt, Muphocor, a fortran program to determine the phonon density of states from neutron scattering experiments, Kernforschungszentrum Karlsruhe GmbH, No.13.03.01p06L, (1984).
- (79) M.M. Bredov, B.A. korov, N.M. Okuneva, V.S. Oskotskii, and A.L. Shakh–Budagov, Sov. Phys. Solid State, 9, 214, (1967).
- (80) V.S. Oskotskii, Sov. Phys. Solid State, 9, 420, (1967).
- (81) S.N. Taraskin, and S.R. Elliot, Phys. Rev. B, 55, 117, (1997).
- (82) M.M. Koza, et al., Collective dynamics and inelastic properties of ice XII., in preparation.
- (83) E.L. Gromnitskaya, O.V. Stal’gorova, V.V. Brazhkin and A.G. Lyapin, Phys. Rev. B., 64, 94205, (2001).
- (84) R.E. Gagnon, H. Kiefte, M.J. Clouter and E. Whalley, J. Chem. Phys., 92, 1909, (1990).
-
(85)
The estimation of the transverse and longitudinal
velocity of sound for LDA and Ic from
Gromnitskaya-PRB-2001 is difficult due
to their variation during the heat treatment
of the sample and the data collection.
Therefore we encourage the readers to estimate
the Debye temperature themselves.
The values estimated by us are:
HDA: km/s, km/s,
LDA: km/s, km/s,
ice Ic: km/s, km/s. - (86) D.D. Klug, E. Whalley, E.C. Svensson, J.H. Root, and V.F. Sears, Phys. Rev. B, 44, 841, (1991).
- (87) It is noteworthy, that the TAS experiments exploit the Stokes line, i.e. the neutron energy loss side, whereas TOF experiments performed by our group utilise the anti–Stokes side, i.e. the neutron energy gain side. The difference between the TAS and TOF experiments is manifested by the temperature dependence of the detailed balance factor Lovesey-Book , which results in a lower sensitivity of the TOF experiments to the rather high energy meV of the TLS. In the elastic mode, the back–scattering spectrometers IN13 and IN16 are sensitiv to both, the Stokes and the anti–Stokes line, whereby the incident energy of neutrons determines the maximum energy range on the Stokes side.