Interferometric Time-Resolved Probing of Acoustic Modes in Single Gold Nanospheres
Abstract
We measure the transient absorption of single gold particles with a common-path interferometer. The prompt electronic part of the signal provides high-contrast images for diameters as small as 10 nm. Mechanical vibrations of single particles appear on a longer timescale (period of 16 ps for 50 nm diameter). They reveal the full heterogeneity of the ensemble, and the intrinsic damping of the vibration. We also observe a lower-frequency mode involving shear. Ultra-fast pump-probe spectroscopy of individual particles opens new insight into mechanical properties of nanometer-sized objects.
The confinement of electrons and phonons causes the physical properties of nanometer-sized objects to depart from those of bulk solids Kreibig and Vollmer (1995). One of the ambitions of nanoscience is to exploit these deviations, and to tailor the properties of nanoparticles by controlling their sizes and shapes. The plasmon resonance of noble-metal (silver and gold) particles is a collective oscillation of the conduction electrons, which governs their strong interaction with light. The shift and broadening of the plasmon resonance with changes in size and shape remains an active research area Link and El-Sayed (1999); Hartland (2004); Voisin et al. (2001). A further strong motivation for optical studies of metal nanoparticles is their recently proposed use as labels for molecular biology bio-gold (2001).
Working with ensembles of nanoparticles entails a fundamental difficulty. The current preparation methods generate a distribution of particles with a significant dispersion of sizes and shapes, and with many possible configurations of defects. This problem can be solved by the isolation of single nanoparticles. A number of methods have recently been put forward to study them with far-field optical microscopy (for a review see Ref. van Dijk et al. (2005)). Each single nanoparticle being a well-defined object, it can be studied in detail, and extended statistics can then be accumulated over many individuals. In addition, the method gives access to environmental influences on the particle’s properties. Following one and the same particle as a function of time unravels space- and time-heterogeneity. In the present work, a time-resolved study of single gold nanoparticles reveals different electronic and elastic processes. Combining the time-resolution of short laser pulses with the microscopy of single nanometer-sized objects (molecules van Dijk et al. (2005), semiconductor structures Guenther et al. (2002), or metal particles) offers new insight into their optical and mechanical properties on their characteristic times, picoseconds and shorter.
When an ultrashort pump pulse excites a metal particle, the absorbed energy is first conveyed to the conduction electrons, which collide within some tens of femtoseconds through electron-electron interactions Link and El-Sayed (1999); Voisin et al. (2001); Hartland (2004). On a 1-ps timescale, the hot electrons thermalize with the lattice, and, still later (typically 10 ps for a 10-nm particle), the whole particle cools down to ambient temperature via heat diffusion. The sudden heating of the electron gas has mechanical effects. Just as sharp rap causes a bell to ring, an optical excitation launches elastic oscillations, via two mechanisms: First, a short-lived transient arises from the strong initial surge in electronic temperature and Fermi pressure. This pressure burst is short but strong because of the low heat capacity of the electron gas Perner et al. (2000). Second, as the electronic energy is shared with lattice modes on a picosecond timescale, anharmonicity leads to thermal expansion. For large enough particles, both times are short compared to the period of elastic vibrations (3.3 ps for the breathing of a 10-nm diameter particle).
The optical properties of the hot particle are also modified. The initial excitation spreads the electronic population around the Fermi level, thereby opening new relaxation channels and broadening the surface plasmon resonance Perner et al. (1997). The subsequent thermal expansion of the lattice reduces the electron density, bringing about a red shift of the plasmon resonance. Size variations can thus be optically detected via shifts of the plasmon resonance.
Laser-induced acoustic vibrations of nanoparticles have been previously studied on ensembles Voisin et al. (2001); Hartland (2004). Such bulk observations are only possible as far as the oscillations are synchronized. Small differences in particle size within the ensemble lead to slight differences in oscillation periods. This inhomogeneous broadening often dominates the observed decay of the ensemble oscillation. Here, we present a study of single gold nanoparticles by interferometric pump-probe spectroscopy. Electronic and acoustic properties are determined on a particle-by-particle basis, with complete elimination of inhomogeneous broadening.
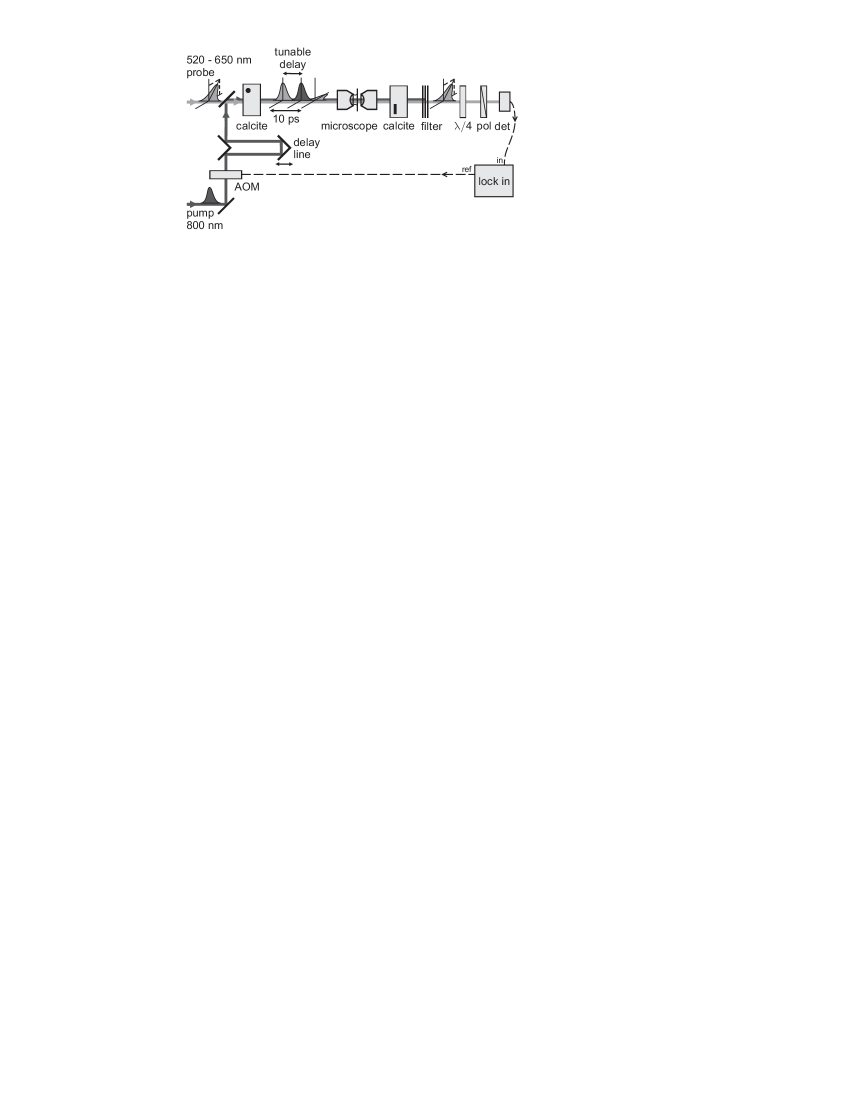
As a single nanoparticle is much smaller than the diffraction-limited laser spot, and as time-dependent changes in optical properties are small, the signals are weak. Measuring minute absorption changes requires many photons and the reduction of all noise sources, down to photon-noise. An interferometer set close to its dark fringe suppresses intensity fluctuations on all timescales. We designed a common-path interferometer, in which two interfering pulses follow the same optical path at different times and with orthogonal polarizations (Fig. 1). Defects of the optical components (particularly of the objectives), being nearly identical for both polarizations, cancel to a large extent.
The measuring light pulse is linearly polarized at 45 degrees from vertical and split into probe and reference pulses by a first birefringent crystal (calcite). The reference pulse is polarized along the crystal’s horizontal fast axis, and the probe along the vertical slow axis. The pump pulse, being polarized along one of the crystal axes, is not split, and travels at a variable delay from the reference-probe pulse pair. After passage through the microscope, reference and probe pulses are recombined in a second, identical calcite crystal, rotated so that its fast axis is vertical. Crystals as splitting elements have the advantage that alignment is easy, but the disadvantage that the time delay is fixed by their thickness (here, 10 ps).
A pump-induced change in the real or imaginary part of the particle’s dielectric permittivity causes a small variation in the probe field’s complex amplitude, from to . This change is detected by the interferometer, either as an amplitude or as a phase variation. The working point of the interferometer is adjusted by independently rotating a quarter-wave plate and a polarizer. The amplitude-sensitive working point is obtained for slightly different amplitudes but equal phases of the interfering waves. The signal then gives the variations of the real part of the probe field. At the phase-sensitive working point, the amplitudes are equal and the phases are slightly different. The signal then follows . In the following, unless mentioned, we use the amplitude-sensitive working point.
The Fourier-limited 1-ps probe pulses are generated at a 76 MHz rate by an intra-cavity, frequency-doubled, optical parametric oscillator (OPO), tunable between 520 and 650 nm. The OPO itself is pumped at 800 nm by the 1-ps pulses of a Ti:sapphire laser. A small fraction of the latter beam, used as pump, is modulated at 400 kHz by an acousto-optical modulator (AOM). The probe (and reference) power varied between 12 and 330 µW, the pump power between 0.5 and 5 mW. The home-built microscope includes an oil-immersion objective (numerical aperture NA=1.4), and an air-spaced objective (NA=0.95). The measurement spot has 300 nm diameter. The sample cover slide, mounted on a piezo stage, can be scanned with 25 nm precision. The interferometer output is fed to an analog avalanche photodiode and demodulated in a lock-in amplifier.
The samples are roughly spherical gold particles with diameters ranging between 10 nm and 80 nm (British Biocell International and Sigma-Aldrich), spin-coated with a poly(vinyl alcohol solution (10 g/L) on a clean glass cover slide. The polymer film was about 20 nm thick.
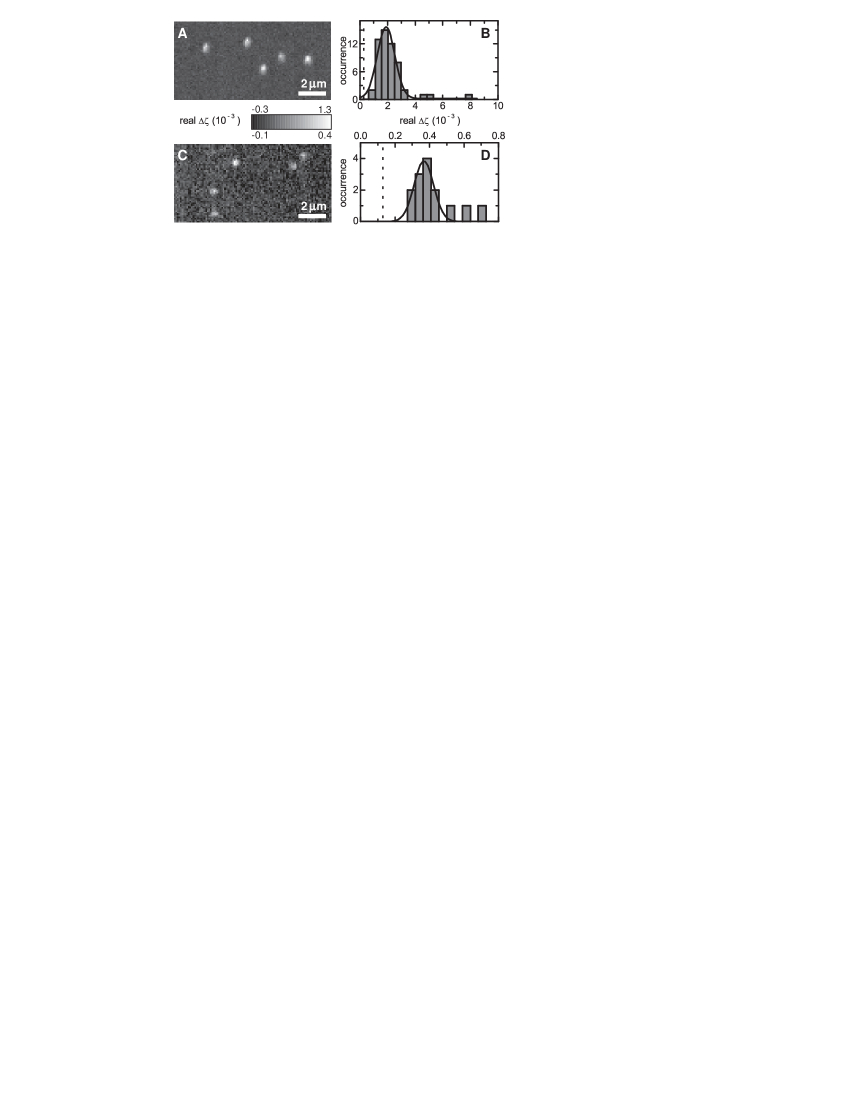
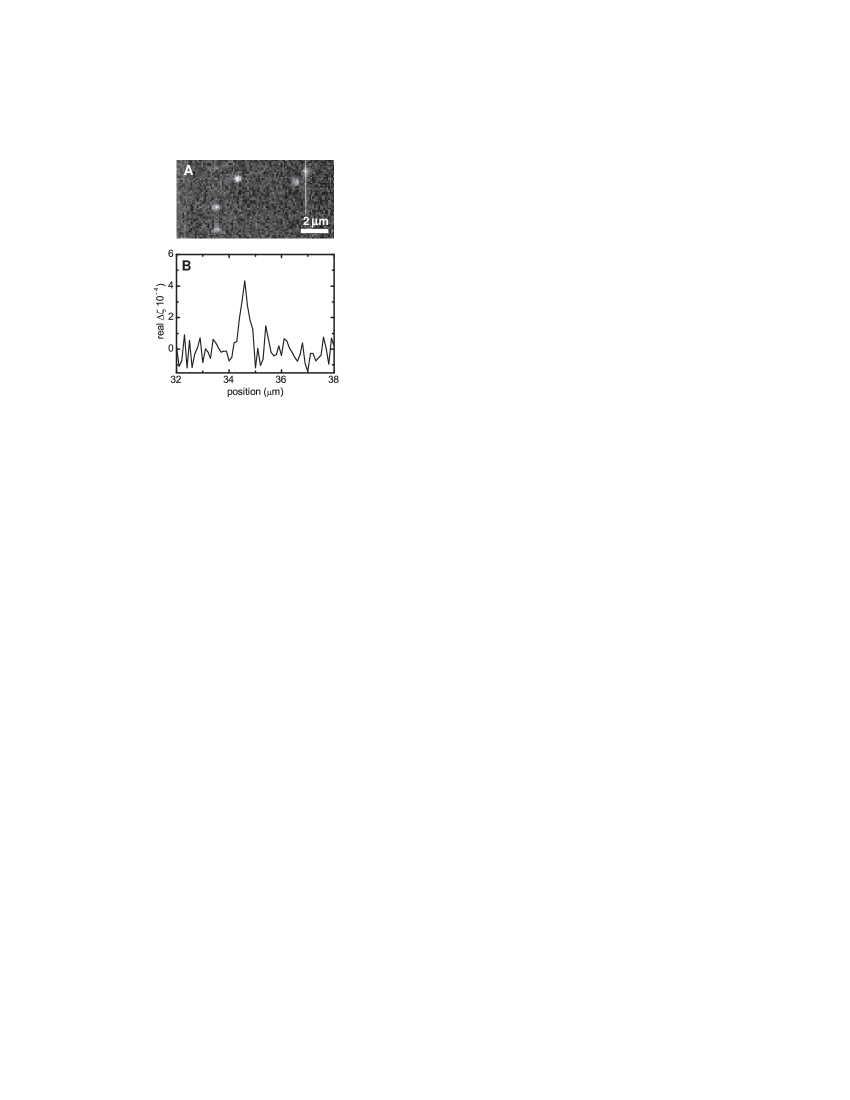
Figure 2 shows images of single gold nanoparticles with 10 and 20 nm diameter. The preparation procedure was that of our earlier study Lippitz et al. (2005), where third-harmonic signals proved that the particles were isolated. Figure 2 is recorded for zero delay, i.e., when the pump and probe pulses impinge simultaneously on the sample, providing maximum contrast. We extracted histograms from a set of images Lippitz et al. (2005). The discrimination threshold between noise and particles was (B) and (D). The resulting distributions, shown in Fig. 2B/D, being mono-modal and well separated from the background, confirm that each spot stems from a single particle. The relative width of the 20-nm distribution, 34 %, is considerably larger than expected from the volume spread given by the manufacturer (19 %). Additional fluctuations in shape, orientation and surroundings of the particles can contribute to this large dispersion via shifts and intensity changes of the plasmon resonance, as recently observed by Berciaud et al. Berciaud et al. (2005). In order to minimize the spread in signal, we recorded the data of Fig. 2 with an off-resonant probe (635 nm), which entailed a significant signal loss. A resonant probe would directly monitor the intensity loss of the plasmon resonance due to temperature broadening, which would provide a stronger signal for zero delay. Shorter and resonant pulses would thus bring the detection limit significantly below 10 nm.
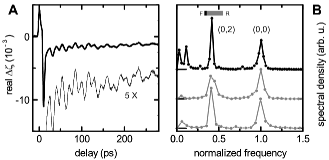
By scanning the delay between the pump and the reference-probe pair, we monitor the time-resolved properties of the gold particles. Figure 3A shows a typical delay scan. The prompt response () stems from the broadening of the plasmon resonance by the pump pulse. It arises when the pump coincides with the reference and probe pulses respectively, with opposite signs because of the interferometric difference. The two peaks are separated by 10 ps. On a longer timescale, reference and probe sample a damped oscillation in a differential way. From its frequency, we assign this oscillation to the fundamental acoustical breathing mode of a spherical particle (this purely radial mode has no angular dependence, and no node along the radius). Delay scans with the probe tuned to the red (595 nm) or to the blue (520 nm) of the particle’s resonance yield out-of-phase oscillations, which clearly shows that the signal mainly stems from a periodic shift of the plasmon resonance, as was observed earlier in bulk experiments Del Fatti et al. (2000).
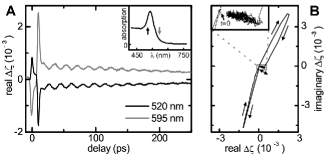
By rotating the quarter-wave plate and the polarizer, we can set the interferometer to measure either purely absorptive or purely dispersive effects. This attractive feature provides both the real and imaginary parts of the a priori unknown optical response , without any need for a model or for previous knowledge. We measured delay scans for the same particle, with the interferometer set first at the amplitude-sensitive, then at the phase-sensitive working points. From the measured interferometer outputs, we plotted the full trace in the complex plane (Fig. 3B). We again distinguish the two contributions discussed above. The fast component due to transient electronic heating is mainly dispersive at the chosen wavelength (520 nm). The second, slow one, originating from acoustic vibrations and indicated with the double arrow, is roughly perpendicular to the first part, and therefore dominantly absorptive. The different orientations of these components in the complex plane illustrate their different origins, as borne out by numerical simulations.
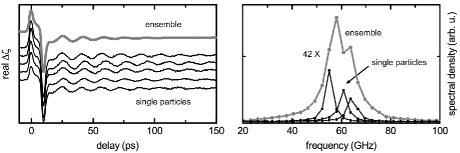
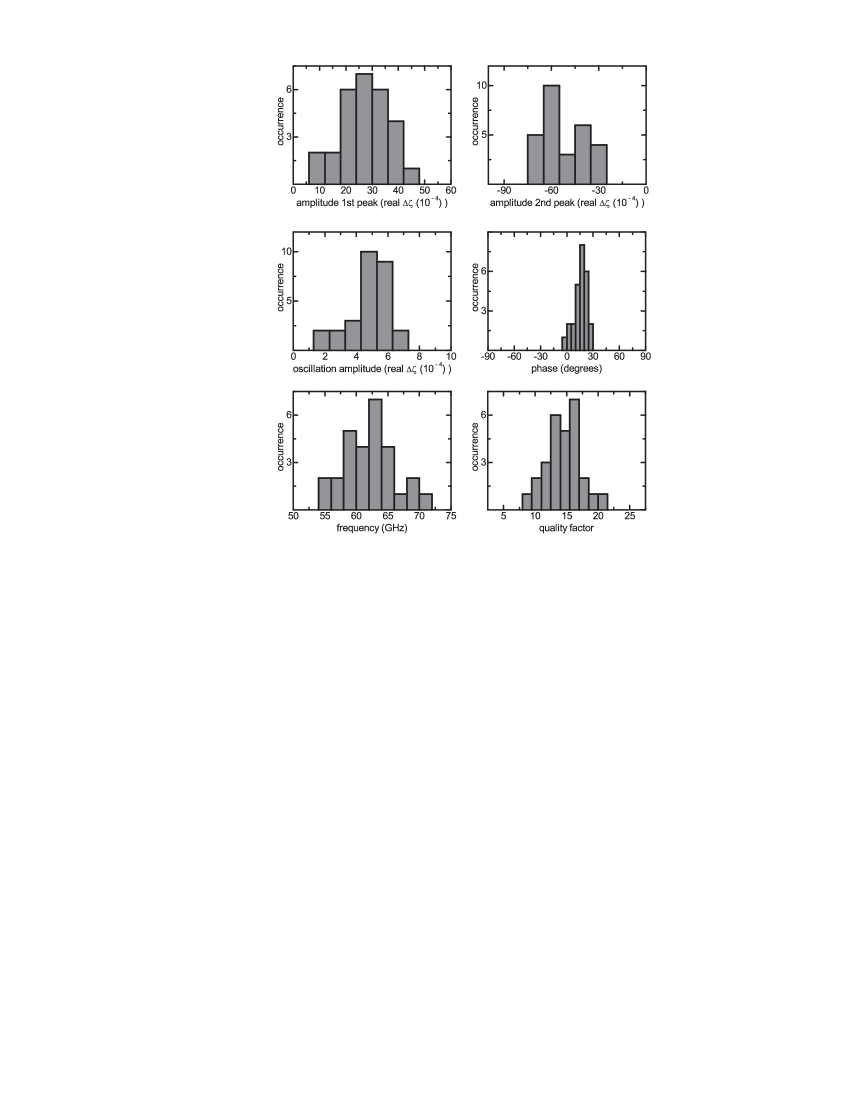
Because of their size and shape distribution, individual particles present slightly different oscillation periods, and they run out-of-phase on longer timescales (see the supplementary material for an example). This inhomogeneous broadening of the breathing mode totally masks any intrinsic damping of the oscillation. Selecting a single particle provides direct access to the intrinsic (or homogeneous) damping, by removing ensemble averaging. The damping rate is found to vary from particle to particle, probably through fluctuations of the environment and of the coupling to acoustic phonons in the substrate. The resonance quality factors ( being the mode’s FWHM in the power spectrum), are about 4-5 for an ensemble, but reach considerably larger values, distributed between 20 and 40, for individual particles in the thin PVA film.
The elastic vibration modes of a solid sphere are labelled in Lamb’s theory Saviot et al. (1996) by two integers, , the harmonic order, i.e., the number of radial nodes, and , the angular momentum number, which represents the angular dependence of the mode. Most of the particles only show the radial breathing mode at a frequency , sometimes with a weak trace of the higher harmonic at about Saviot et al. (1996), as seen in ensemble measurements Nelet et al. (2004). Some particles, however, show an additional mode at a lower frequency. Fig. 4A shows an example, where the time-response clearly deviates from a sine-curve. The power spectrum obtained by Fourier transformation of the oscillation (Fig. 4B, top trace) shows two distinct peaks. The high-frequency peak (at 67 GHz for the upper spectrum) corresponds to the spherical breathing mode of a 45 nm diameter gold sphere. Another peak appears at lower frequency (28 GHz for the upper spectrum). This new peak cannot arise from the breathing mode of a second, larger particle at the same spot, for the optical signal would then be too weak (the optical response scales as the third power of particle diameter). We assign the peak at 28 GHz to the non-spherically symmetric mode, involving shear strain (uniaxial cigar-to-pancake deformations of the sphere), which was seen already in Raman spectra of semiconductor nanoparticles Saviot et al. (1996). We rule out the lower-order mode, corresponding to a pear-shaped deformation, because it does not couple to the optical response, at least at the lowest order and in a spherically symmetric environment. Both modes can only be excited by the isotropic heat pulse if the spherical symmetry of the particle’s expansion is broken either by the substrate, or by the particle’s shape. Indeed, the mode does not appear in ensemble pump-probe experiments, where the particles’ environment is isotropic. The measured frequency of the mode lies between the frequencies expected for a sphere with free and rigid boundaries (see bar in Fig. 4B). We note, however, that its ratio to the breathing mode’s frequency was the same for all measured particles. The shift from the free sphere’s vibration could possibly arise from elastic perturbation by the glass half-space.
Interferometric pump-probe measurements of single metal particles have the double advantage of high sensitivity and of providing the full optical response, including phase and amplitude. We have imaged 10-nm particles with 1-ps pulses, but shorter resonant pulses would give access to even smaller particles. Electronic properties such as scattering times could then be studied on a single-particle basis. On a longer timescale, we recorded time-traces of acoustical breathing modes, displaying particle-to-particle fluctuations in frequency and decay rate, and revealing the intrinsic damping of mechanical vibrations. We found a new mode at lower frequency, so far unobserved in pump-probe experiments, and presumably coupled by a substrate-induced breaking of the spherical symmetry. Mechanical vibration modes are fascinating doorways to the elastic properties of metal particles and of their environment. More generally, probing single nano-objects and nano-structures with short laser pulses opens a wealth of real-time studies of nano-mechanics on picoseconds, the characteristic vibration times at nanometer length scales.
References
- Kreibig and Vollmer (1995) U. Kreibig and M. Vollmer, Optical Properties of Metal Clusters, vol. 25 of Springer Series in Materials Science (Springer, Berlin, 1995).
- Link and El-Sayed (1999) S. Link and M. A. El-Sayed, J. Phys. Chem. B 103, 8410 (1999).
- Hartland (2004) G. V. Hartland, Phys. Chem. Chem. Phys. 6, 5263 (2004).
- Voisin et al. (2001) C. Voisin et al., J. Phys. Chem. B 105, 2264 (2001).
- bio-gold (2001) S. Schultz et al., Proc. Natl. Acad. Sci. U. S. A. 97, 996 (2000). L. Cognet et al., Proc. Natl. Acad. Sci. U. S. A. 100, 11350 (2003). G. Raschke et al., Nano Lett. 3, 935 (2003). C. D. Geddes, A. Parfenov, and J. R. Lakowicz, J. Fluoresc. 13, 297 (2003).
- van Dijk et al. (2005) M. A. van Dijk, M. Lippitz, and M. Orrit, Acc. Chem. Res. in print, DOI: 10.1021/ar0401303.
- van Dijk et al. (2005) E. M. H. P. van Dijk et al., Phys. Rev. Lett. 94, 078302 (2005).
- Guenther et al. (2002) T. Guenther et al., Phys. Rev. Lett. 89, 057401 (2002).
- Perner et al. (2000) M. Perner et al., Phys. Rev. Lett. 85, 792 (2000).
- Perner et al. (1997) M. Perner et al., Phys. Rev. Lett. 78, 2192 (1997).
- Lippitz et al. (2005) M. Lippitz, M. A. van Dijk, and M. Orrit, Nano Lett. 5, 799 (2005).
- Berciaud et al. (2005) S. Berciaud et al., Nano Lett. 5, 515 (2005).
- Del Fatti et al. (2000) N. Del Fatti et al., J. Phys. Chem. A 104, 4321 (2000).
- Saviot et al. (1996) L. Saviot et al., J. Non-Cryst. Solids 197, 238 (1996).
- Nelet et al. (2004) A. Nelet et al., Appl. Surf. Sci. 226, 209 (2004).
S Supplementary material
S.1 Experimental details of the figures
We give here more details of the experimental conditions under which the data presented in the figures was acquired. The particle diameter is the nominal diameter of the particles, and the batch average diameter as given by the manufacturer. The size dispersion, as given by the manufacturer, is in all cases about 6 %. indicates the particle size as deduced from the oscillation frequency. The power in the visible is the average power of the reference and the probe pulses together at the sample position. The power in the near infrared ( nm) is the average power of the pump at the sample position, while the AOM is transmitting (otherwise it is zero). is the pixel dwell time. gives the time-constant of the lock-in amplifier. The filter roll-off was always 24 dB/oct. gives the transmission of the interferometer at the selected working point. It is 0 at the dark fringe and 1 at the bright fringe.
| Figure | 2A | 2C | 3 | 4 | S.1/2 |
|---|---|---|---|---|---|
| (nm) | 20 | 10 | 50 | 50 | 50 |
| (nm) | 22 | 11 | 52 | 52 | 52 |
| (nm) | — | — | 53 | 45, 48, 51 | — |
| (nm) | 635 | 635 | (*) | 595 | 595 |
| (µW) | 160 | 330 | 40 | 12 | 16 |
| (mW) | 5.2 | 5.2 | 0.5 | 2.0 | 0.5 |
| (ms) | 100 | 200 | 470 | 100 | 160 |
| (ms) | 10 | 30 | 30 | 10 | 10 |
| 0.015 | 0.010 | 0.100 | 0.100 | 0.100 |
S.2 Inhomogeneous broadening in an ensemble
A striking illustration of the strength of single-particle observations is displayed in Fig. S.5. The left panel shows delay scans and the right panel power spectra of the oscillatory behavior of nanoparticles. We measured 29 single particles under the same experimental conditions and then averaged them to yield an ”ensemble” signal (thick grey line). Examples of the single particle data are shown as thin black lines. Comparing the ”ensemble” signal to the single particle signal, we clearly see that the ensemble oscillation damps much faster than those of individual nanoparticles, which broadens the peak in the ensemble power spectrum. Because of the size distribution, the nanoparticles present slightly different oscillation periods, and they run out-of-phase on longer timescales. This inhomogeneous broadening easily masks the intrinsic decay of the vibrations of individual particles.
S.3 Second harmonic of the breathing mode

S.4 Cross-section of Figure 2C