Spectral properties and isotope effect in strongly
interacting systems:
Mott-Hubbard insulator and polaronic semiconductor
Abstract
We study the electronic spectral properties in two examples of strongly interacting systems: a Mott-Hubbard insulator with additional electron-boson interactions, and a polaronic semiconductor. An approximate unified framework is developed for the high energy part of the spectrum, in which the electrons move in a random field determined by the interplay between magnetic and bosonic fluctuations. When the boson under consideration is a lattice vibration, the resulting isotope effect on the spectral properties is similar in both cases, being strongly temperature and energy dependent, in qualitative agreement with recent photoemission experiments in the cuprates.
pacs:
71.38.-k, 79.60.-i, 74.72.-hI Introduction
A general feature of strongly interacting electron systems is a sizeable suppression of the metallic character, accompanied by a redistribution of the spectral weight from the region close to the Fermi level towards higher energies. In the presence of a strong electron-electron repulsion, for example, incoherent excitations arise far from the Fermi energy in the so-called upper and lower Hubbard bands, at an energy scale which is ruled by the strength of the interaction. A similar behavior is also found in systems with strong electron-lattice coupling, where the spectral weight is transferred to a broad peak located around the polaron binding energy .
Recent photoemission experiments in the high-Tc cuprates Lanzara01 ; KShenPRL04 ; Gunnarssoncondmat05 ; Zhou05 , which are generally described in terms of purely electronic models due to the proximity to a Mott insulating phase, have revealed the existence of an important electron-lattice coupling. This has given rise to intense theoretical work focusing on the excitation spectra in the presence of electron-boson interactions, both in models with NagaosaPRL04 ; GunnarssonEPJB05 ; Fehske and without Verga ; Hague ; HohenadlerPRB03 ; DevereauxPRL04 ; Kaiji04 ; Korni-alex electronic correlations. Of particular interest are those works which focus on isotope effects (IE), since they can disentangle the properties which are directly related to the coupling to the lattice degrees of freedom. For example, it has been found that an anomalous isotope effect on the effective mass arises at the polaron crossover, signaling the breakdown of the Migdal-Eliashberg adiabatic approximation Paola . An enhancement of the IE is also expected in the proximity of a Mott metal-insulator transition, i.e. at intermediate values of the electron-electron repulsion StJ . On the other hand, a strong electronic repulsion suppresses the effects of the lattice dynamics on the low energy excitations near the Fermi level. These persist at high energy, where they amount essentially to a broadening of the electronic spectra GunnarssonEPJB05 .
In this work, we provide an approximate theoretical framework based on the Coherent Potential Approximation (CPA), which qualitatively describes the high-energy excitation spectra resulting from both electron-electron and electron-boson interactions, treating the fluctuations of magnetic and bosonic origin as a local static disorder. Although simplified, the present analytical treatment is able to account for the existence of broad incoherent peaks at high energy, which are a common characteristic of strongly interacting electronic systems.
We analyze two extreme cases which can be important for our general understanding of the problem: (i) a Mott-Hubbard insulator at half-filling, in the presence of an additional local interaction of the electrons with dispersionless bosons and (ii) a polaronic semiconductor, where the physics is solely determined by the electron-boson coupling. In the former case, the validity of our approach relies on the separation of electronic and bosonic energy scales, which is achieved due to a strong electron-electron repulsion. In the latter case, the present CPA results are controlled by direct comparison with an exact solution obtained by Dynamical Mean Field Theory (DMFT) depolarone .
The consequences of the electron-boson coupling on the dispersion and width of the high energy features in the spectral function are calculated in both situations, in section II and III respectively. Particular attention is devoted to the effect of a shift of the boson frequency, as can be achieved through an isotopic substitution if the bosonic mode that couples to the electrons is a lattice vibration, or more generally if it is a collective mode with a sizeable lattice component (in which case a non-trivial IE can still arise, provided that the frequency of the boson is modified by the isotopic substitution). In the present approximation, the IE on the high energy part of the spectrum turns out to be qualitatively similar in the Mott-Hubbard insulator and in the polaronic semiconductor, being mainly determined by the strength of the electron-boson coupling (albeit slightly enhanced by the presence of electronic correlations): in both cases it is strongly temperature and energy dependent, in agreement with the recently measured IE in the high temperature superconductor Bi2Sr2CaCu2O8+δ Gweon-Nat04 ; Gweonsub . A tentative analysis of the experimental results, performed in section IV, is compatible with the existence of a moderate electron-phonon coupling in the cuprates.
II Electron-boson coupling in a Mott-Hubbard insulator
II.1 Coherent Potential Approximation
We study the following Holstein-Hubbard Hamiltonian:
where electrons in a band with dispersion mutually interact through an on-site repulsion , and are coupled locally to a dispersionless bosonic mode of frequency , with a strength . We shall set the energy units such that . We calculate the spectral properties of the above model at half filling, in the framework of the Coherent Potential Approximation (CPA) HubbardIII ; Vollhardt . This is suitable for the Mott insulating phase at large , but also gives a fair description of the high energy incoherent excitations in the correlated metal, provided that the upper and the lower Hubbard bands are well separated from the low energy quasi-particle peak DMFTreview . The latter, however, is not accessible within this theory, and the position of the chemical potential remains undetermined except at half-filling. Additional features that are not included in the present description are the coherent excited states that arise at low temperature, (even in the insulating phase), due to the quantum nature of the magnetic excitations, in an energy range around the Hubbard band edges Preuss ; Dagotto ; Nasu , and whose dispersion is srongly reminiscent of spin density waves.
Bearing these limitations in mind, the success of the CPA is that, despite its formal simplicity, it correctly accounts for the high-energy scattering by the randomly distributed magnetic moments. The momentum-integrated Green’s function has the form Vollhardt :
| (1) |
where is an effective propagator which takes hopping processes into account. It can be eliminated by introducing a local self-energy through the following self-consistency condition:
| (2) |
(in the “atomic” limit, and the usual single site propagator is recovered Vollhardt ). For each frequency , we are left with a system of two equations for the two complex unknowns and .
In the presence of a local electron-boson interaction, equation (1) can be generalized by introducing an additional field , which accounts for the random distribution of electronic energies due to the fluctuations of the bosons at different sites
| (3) |
In a system where the on-site electron-electron repulsion directly competes with the attraction induced by the bosons, the formation of bipolarons (and the resulting strong anharmonicities in the boson field) Millis ; polaronCO is prevented provided that is much larger than the polaron binding energy StJ ; Hewson . In this case, we can assume that the boson field obeys the following gaussian distribution,
| (4) |
The variance
| (5) |
is determined either by the thermal fluctuations (at high temperature, ) or by the quantum fluctuations of the bosons (at low temperature, ).
Let us emphasize that we have neglected boson renormalization effects which, even in the presence of a strong electron-boson interaction, are suppressed by a sufficiently strong repulsion StJ ; Hewson . Such effects can in principle be included by taking in eq. (5) equal to the measured boson frequency rather than the bare parameter of eq. (II.1). However, the present scheme is expected to break down in situations where the bosonic and electronic energy scales become comparable (i.e. ), in which case the properties of the bosonic field depend crucially on the electron correlations.
Equations (2) and (3) form the backbone of our theory. The latter can be further explicited by evaluating the Hilbert-transform of the gaussian
| (6) |
where is the complex error function abramowitz . Note also that, since the self-energy does not depend on momentum, the details of the band dispersion enter in equation (2) only through the corresponding density of states. For the sake of simplicity, we shall consider a band dispersion with a semicircular density of states of half-width , for which the self-consistency equation (2) reduces to . However, since they rely on a momentum independent quantity (the local self-energy), the results are quite independent on the choice of the band dispersion.
The spectral function, which is the quantity of interest in the present work, is defined as
| (7) |
Its momentum integral — the spectral density — is .
II.2 Mott-Hubbard insulator
For large , and in the absence of electron-boson interactions, the set of equations (1) and (2) can be rewritten as
| (8) | |||||
| (9) |
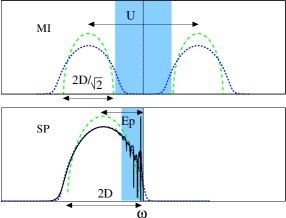
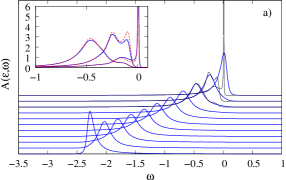
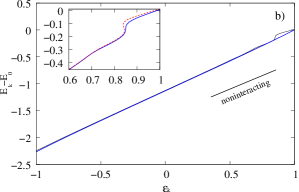
The spectral density is illustrated in figure 1.a, and consists of two bands of reduced width separated by a gap (the and sign are for the lower and upper Hubbard band respectively). Such bands represent incoherent states that are strongly scattered by the disordered magnetic moments. The corresponding spectral function exhibits broad peaks, whose width is comparable with the bandwidth itself: it is determined by the scattering rate , which is proportional to the spectral density, and is therefore strongly energy dependent. As a consequence, the peaks sharpen (and become asymmetric) when approaching the band edges, as can be seen in the energy scans at constant momentum, in figure 2.a (dashed green curve). Their dispersion, defined as the locus of the maxima of at constant (the so-called momentum distribution curves, MDC) can be obtained by solving the equation , and is roughly given by (see fig. 2.b).
It should be noted that the slope of the dispersion of such high energy features deviates significantly from the unrenormalized Fermi velocity . For this reason, in strongly correlated electron systems, some care should be taken when extracting the function from experimental data under the assumption that tends asymptotically to its unrenormalized value at sufficiently high energy, as is customary in the field Valla99 (see also ref. Fink ).
II.3 Electron-boson coupling
The coupling to a bosonic mode leads to several modifications of the picture described above. First of all, the fluctuations of the site energies lead, through the relation (3), to an overall broadening of the Hubbard bands. In particular, this generates additional exponential tails in the vicinity of the band edges, whose extension is governed by the variance . In the adiabatic regime, where the boson frequency is small compared to the bandwidth (), and for large , such tails are typically smaller than both the width of the Hubbard bands and the size of the gap (see figure 1.a)
The spectral function , for and , is illustrated in figure 2.a at different values of . This value of the variance corresponds, for example, to a moderate electron-boson coupling , in the adiabatic regime and at zero temperature. The purely electronic case () is also shown for comparison (dashed green lines). The electron-boson coupling strongly alters the lineshapes: well inside the Hubbard bands, there is a huge broadening of the peaks, which can be estimated in the large limit (see appendix) to , and is of the order of % in the present example. However, the effect is even more dramatic in in the vicinity of the band edges. There, the scattering rate, which is roughly proportional to the spectral density, has a sharp (square root) dependence on the energy in the pure electronic case, causing a marked asymmetry of the peaks. The boson fluctuations convert the sharp edge in a much smoother exponential tail, restoring a more symmetric lineshape for . Let us mention that the above-mentioned power law behavior at the edges of the Hubbard bands is not peculiar to the semi-circular DOS used in this example (see ref. Brinkman ). Indeed, analogous results are obtained starting with a flat noninteracting DOS with a step-like edge, appropriate for two-dimensional systems.
The position of the peaks is also affected by the electron-boson coupling, although to a weaker degree (this is partly in contrast with the results of refs. NagaosaPRL04 ; Gunnarssoncondmat05 , which only predict a broadening of the peaks, but no renormalization of the dispersion). In figure 2.b, we have reported the renormalized MDC dispersion . The main effect of the electron-boson coupling is an increase of the slope ; its relative variation is of the order , as can be estimated from the large expansion presented in the appendix, and is one order of magnitude smaller than the corresponding effect on the linewidths.
II.4 Isotope effect on the spectral properties
We shall now analyze the consequences of a change in the boson frequency on the spectral properties. Unless otherwise specified, we shall consider a relative shift %, that can be achieved through the substitution in the case of a lattice mode with predominantly oxygen character Kovaleva . The value inferred from the photoemission experiments in ref. Gweon-Nat04 on the mode at is comparable with this value, % , pointing to a strongly phononic character of the bosonic excitation.
By direct inspection of equation (5), we immediately see that any isotopic effect will be strongly temperature dependent, on the scale of the boson frequency itself: at low temperatures, where , a modification of directly affects the distribution (4) of the lattice displacements, and therefore modifies the spectral properties described above. However, this effect is rapidly suppressed when the thermal fluctuations become dominant, in which case is independent on the boson frequency. In the following, we shall present the results at , where the IE is maximum. The IE at any temperature can be obtained straightforwardly by multiplying the results by an appropriate coefficient
| (10) |
which is maximum at (), and rapidly drops at temperatures , where .
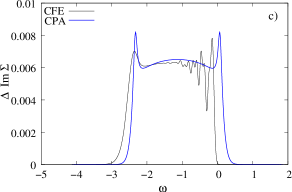
The inset of figure 2.a shows the IE on the peaks in at various close to the edge of the LHB. The reduction of the boson frequency leads to a weak shift of the peak position, corresponding to a slight reduction of the slope , which is too weak to be observed at such moderate values of (see also the inset of figure 2.b, where we have reported the renormalized dispersion close to the upper edge of the band). On the other hand, we know from the previous section that the effect of the electron-boson coupling is much stronger on the linewidths than on the dispersion, and indeed some reduction of the peak widths is already visible in the plots of . For a more quantitative analysis, we have reported in figure 2.c the IE on the scattering rate, defined as . It shows an interesting dependence on the energy: it is rather flat inside the Hubbard bands, but exhibits pronounced peaks of width around the band edges, because this is the region where the spectra are mostly affected by the bosonic fluctuations. The variation of the linewidth in the flat region well inside the Hubbard bands is approximately given by (see appendix)
| (11) |
and gives a direct measure of the strength of the electron-boson coupling. Note that although the precise numerical coefficient is specific to the semi-circular DOS considered here, analogous formulas can in principle be derived for any choice of the noninteracting band (in fact, a similar result also holds in the weak coupling regime Engelsb ).
Above the band edges, the IE decays exponentially, following the fluctuation induced tails in the spectral density. This gives rise to an extremely asymmetric peak of at the band edge, which becomes more and more symmetric as is increased (cf. the discussion on the spectral function in the previous section). For sufficiently large , tends to a skewed gaussian, whose maximum is located in , whose width is proportional to and height scales as
| (12) |
III Polaronic semiconductor
In this section, we use the approximate theory presented above to address the spectral properties in a system with electron-boson interactions, but in the absence of electron-electron correlations. For this problem, extensive results are available in the litterature for the weak coupling regime Engelsb , and for the polaronic anti-adiabatic regime, where the boson frequency is assumed to be much larger than the noninteracting bandwidth AlexRann . We shall focus instead on the polaronic adiabatic regime (i.e. moderate to strong electron-boson couplings and adiabatic bosons ), which is more often encountered in solids Dessau ; Perfetti ; Okazaki , and for which a simple formulation of the spectral properties is not clearly established.
For the problem of a single electron coupled to a dispersionless boson, a complete characterization of the excitation spectrum has been given in references depolarone ; BRopt , based on the Dynamical Mean Field Theory. In the adiabatic regime, the spectra are composed of one (or several, depending on the coupling strength) narrow features at low energy, equally spaced by , coexisting with a continuous high energy background centered around the polaron binding energy . As the coupling strength increases, the low-energy features are rapidly suppressed and the spectral weight becomes dominated by the high-energy incoherent background. It should be stressed that, contrary to what happens in the anti-adiabatic limit, the high-energy features here are dispersive due to the strong hybridization with the free-electron states (see e.g. fig. 14 in ref. depolarone ).
The high-energy incoherent excitations are well described by an equation analogous to (3),
| (13) |
where the boson field obeys the same gaussian distribution of eq. (4). In fact, the above equation can be shown to be rigorously valid in the framework of the DMFT in the adiabatic limit [see ref. depolarone , eq. (46)]. A similar relation also holds for a system of spinless polarons at finite density Millis ; polaronCO , leading to very similar results as in the single particle case presented here 111In this case, the expression (3) can be rigorously derived from the Holstein model in the classical limit . However, contrary to the single electron case, the distribution is modified by the interaction with a finite density of electrons. It becomes bimodal, with two peaks separated by , leading to an upper and a lower “Holstein band” in the spectral density (in analogy with the upper and lower Hubbard bands in correlated systems)..
Note that the chemical potential is undefined in the present single particle problem. To make direct contact with the results of the previous section, we shall interpret the results for the spectral function as corresponding to the lower “Holstein band” (i.e. to excitations at negative binding energies as in a direct photoemission experiment), setting the chemical potential at the extremum of the polaron band, with the replacements and in equation (13). Here is the polaron binding energy taken from the DMFT solution, which tends to in the strong coupling limit (see fig. 4 in ref. depolarone ).
We shall first solve the coupled equations (13) and (2) in a regime where the variance of the boson field is smaller than the noninteracting bandwidth, which is typically the case for moderate values of the electron-boson coupling. The opposite limit , where the spectral density takes the form of a gaussian, multi-boson shakeoff peak, will be treated at the end of this section.
III.1 Intermediate coupling regime
The spectral density for and () is illustrated in figure 1.b (blue dotted line). As in the correlated case, the boson fluctuations result in an overall broadening of the original band (green dashed line). The agreement with the DMFT result (black solid line) is excellent in the smooth region at high binding energies, while in the low energy region, the CPA clearly misses the detailed structure of the narrow peaks. However, even there it gives a fair description of the integrated spectral weight, which is what one would measure experimentally in the presence of a sufficient energy broadening.
III.1.1 High-energy features
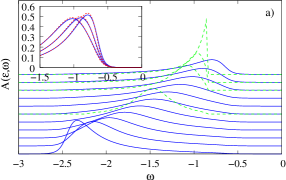
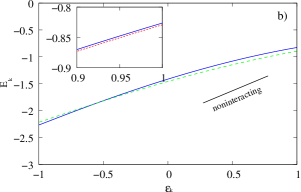
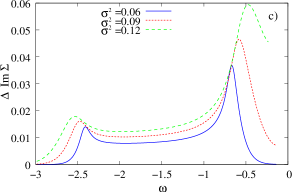
The results for the spectral function are illustrated in figure 3.a. As in the correlated case treated in the previous section, the high energy part of the spectra is characterized by broad features, whose dispersion (fig. 3.b) sensibly deviates from the noninteracting case. The variation of the scattering rate under a shift of the boson frequency (fig. 3.c) is also very similar to the correlated case, corroborating the fact that the magnetic fluctuations only play an indirect role in the isotope effect: is rather flat at the center of the band, and attains its maximum in a narrow region of width around the band edges.
For a more quantitative understanding, analytical expressions can be obtained by an expansion to lowest order in the variance, as was done previously for the Mott-Hubbard insulator. In the present case the coupled equations (13) and (2) become
| (14) | |||||
| (15) |
which is valid inside the band, far from the edges. The Green’s function has the noninteracting form, but with a renormalized bandwidth given by . The slope of the dispersion of the high-energy features is renormalized accordingly: , i.e. it does not coincide with the value in the absence of interactions, as can be seen in figure 3.b. The boson induced variation is of the same order as what was calculated in section II.C in the presence of electronic correlations.
From the first equation we see that the scattering rate within the band is proportional to the spectral density, . Note that it is weaker than in the correlated case, due to the absence of magnetic disorder. Nevertheless, the modification of the scattering rate under a shift of the boson frequency is of the same order as in the previous case [although with a smaller prefactor, cf. eq. (11)], namely
| (16) |
being directly proportional to the strength of the electron-boson coupling.
The existence of a maximum of near the band edge (figure 3.c) also compares well with the DMFT result, although its actual position is slightly shifted to higher binding energies. This can be understood by observing that the true edge of the incoherent dispersion is at (not at ), which marks the boundary between the high-energy and low-energy regions in the excitation spectra (see below). Note that rapidly drops in the region , where itself is extremely small due to our assumption of dispersionless (gapped) bosons.
III.1.2 Low-energy features
The low-energy part of the spectral function is shown in the inset of figure 3.a. The DMFT result shows that the broad incoherent peak progressively disappears when the band edge is approached (i.e. at low momentum transfers), while a narrow “quasi-particle” peak arises at binding energies . The evolution of such peak-hump structure, which is characteristic of the intermediate coupling regime (in the strong coupling regime, the narrow features are too weak to be observed) causes a discontinuous jump, or kink, in the dispersion, which clearly separates the high and low-energy regions with different slopes, as illustrated in figure 3.b (see also figure 3 in reference BRopt ). The isotope effect on the kink region is shown in the inset. Note that in this plot, the isotope shift vanishes at by definition, since the origin of energies has been shifted to coincide with the band edge (see the discussion at the beginning of this section).
III.2 Strong coupling limit
At extremely large values of the coupling strength (or at sufficiently high temperatures ), the variance of the boson field can become comparable with the noninteracting bandwidth (). The latter can therefore be neglected in eq. (3), replacing . Note that this does not correspond to the usual atomic, anti-adiabatic limit AlexRann , where it is assumed from the beginning that is the smallest energy scale in the problem, resulting in dispersionless high energy features. The present theory is valid in the opposite limit, , which is more often realized in solids Dessau ; Perfetti ; Okazaki . Due to the large transfer integrals between molecular units, the discrete shakeoff spectrum characteristic of isolated molecules is converted here into a continuous gaussian spectral density depolarone , and a sizeable high-energy dispersion is recovered.
We recognize from eq. (13) that the spectral density in this case coincides with the gaussian distribution itself,
| (17) |
whose width is governed by the variance (we have performed the shift using the fact that in the strong coupling limit). The full Green’s function can be read directly from eq. (6):
| (18) |
At the center of the polaron peak, the self-energy tends to
| (19) |
As a consequence, the dispersion of the broad peaks in tends to , which defines an apparent bandwidth for the incoherent features, sensibly larger than the noninteracting value [this should not be confused with the width of the polaron peak in the momentum-integrated spectral density of eq. (17), which is governed by the variance ]. Correspondingly, the slope of the high-energy dispersion saturates to a finite value in the strong electron-boson coupling limit, which is independent of the coupling strength, and is larger than the noninteracting value (cf. the situation in the Mott-Hubbard insulator at strong , section II.B).
In the energy interval spanned by the dispersion , the scattering rate is roughly constant and directly proportional to . Its variation under a change of the boson frequency is given by
| (20) |
which is similar to the behavior encountered near the edges of the Hubbard bands [cf. eq. (12)].
IV Concluding remarks
In this work, we have presented an approximate analytical theory which addresses the high energy spectral properties in systems characterized by a strong electron-boson coupling, both in the presence and in the absence of electronic correlations. Concerning the electron-boson interaction alone, the present approach gives accurate results in the adiabatic regime (i.e. opposite to the standard strong-coupling polaron theories), where its validity can be controlled by direct comparison with the results of the Dynamical Mean Field Theory. For the correlation part, on the other hand, it reduces to the CPA treatment of reference HubbardIII , which qualitatively accounts for the incoherent high-energy excitations located in the upper and lower Hubbard bands.
Although the microscopic mechanisms in the cuprates certainly go beyond the simple model and approximations presented here, our results reproduce at least qualitatively several characteristics of the observed photoemission spectra, such as the existence of broad peaks with a sizeable momentum dispersion, which sharpen and become more asymmetric (in the EDC scans) as the band edge is approached.
More specifically, we have calculated the isotope effect on the high-energy spectral features. In the present framework, where the bosonic and magnetic fluctuations are effectively decoupled, the overall behavior in the Mott insulator and in the polaronic semiconductor is qualitatively similar. The most notable result is the existence of a strongly energy dependent IE on the linewidths, which is maximum in a narrow energy interval of width near the band edges, because this is the region where the excitation spectrum is mostly affected by the electron-boson interaction (new spectral weight is created there, due to the presence of boson fluctuations).
The present approach also predicts a strong temperature dependence of the IE, which should be strongly suppressed when the temperature reaches some fraction of the boson frequency (typically ). This occurs because at high temperatures, the fluctuations of the boson field are dominated by thermal effects, which are independent on the boson frequency, and is in no way related to the existence of a temperature dependent electron-boson coupling. Note that, according to the above general arguments, an analogous energy and temperature dependence of the IE can also be expected in more accurate treatments of the electron correlations.
The results of section II can be tentatively compared with the experimental results of references Gweon-Nat04 ; Gweonsub . If we associate the variance with the observed width of the active IE region, and take the value for the boson energy, a “polaron” binding energy is obtained. Assuming a noninteracting bandwidth of the order of places this value in the intermediate electron-boson coupling regime. The same value of is also compatible with the magnitude of the observed IE on the scattering rate. From the frequency softening deduced from the shift of the kink energy, the theory predicts a decrease of the scattering rate around the band edges of the order (see the end of section II.D), in agreement with the experimental observations of ref. Gweonsub .
It should be stressed that the present theory, based on a momentum independent electronic self-energy, clearly fails in addressing the strongly anisotropic dispersion observed in the cuprate superconductors, which demands to go beyond a local (and classical) treatment of the bosonic and magnetic fluctuations. In particular, the edges of the Hubbard bands at low temperature are strongly affected by the “spin density wave” dispersion, especially at intermediate values of . Another point which is beyond the range of validity of the present approach is the enhancement of the low energy IE due to proximity to a Mott metal-insulator transition. In this case, even a weak electron-boson interaction may produce a huge effect when the boson frequency is varied StJ .
Acknowledgements.
We are grateful to G.H. Gweon and A. Lanzara for sharing with us their data prior to publication. We also thank E. Cappelluti for useful discussions.APPENDIX: IE in the large limit.
Inside the Hubbard bands.
Well inside the LHB, we can expand (6) for small , and neglect the effect of the UHB in equation (3) for sufficiently large . In the case of a semi-circular DOS, we obtain
| (21) | |||||
where we have used the fact that to lowest order in . The solution for reads
| (22) |
with . From the self-consistency relation we obtain
| (23) |
The scattering rate is therefore directly proportional to the spectral density at this energy. At the center of the band, it is given by
| (24) |
Its isotope effect at
| (25) |
gives a direct measure of the strength of the electron-boson interaction.
Fluctuation induced tails.
In the gap region between the Hubbard bands, additional spectral weight is created by the boson fluctuations. For small and sufficiently far from the band edges, both terms in (3) can be replaced by their atomic counterparts leading to the following exponential decay (for the LHB)
| (26) |
(note that this formula is not valid close to the band edge, i.e. where the IE is maximum).
A simpler result is obtained for sufficiently large , i.e. in the strong electron-boson coupling regime . In this case, the variation of the scattering rate under a shift of the boson frequency takes the form of a skewed gaussian, which is maximum at , where
| (27) |
References
- (1) A. Lanzara, et al., Nature 412, 510 (2001).
- (2) K. M. Shen, et al., Phys. Rev. Lett. 93, 267002 (2004).
- (3) X. J. Zhou et al., cond-mat/0405130
- (4) O. Rösch, et al., cond-mat/0504660
- (5) O. Rösch, and O. Gunnarsson, Phys. Rev. Lett. 93 237001 (2004); idem, Eur. Phys. Journal B 43, 11 (2005).
- (6) A. S. Mishchenko and N. Nagaosa, Phys. Rev. Lett. 93, 036402 (2004).
- (7) H. Fehske et al., Phys. Rev. B 69, 165115 (2004)
- (8) S. Verga, A. Knigavko, and F. Marsiglio, Phys. Rev. B 67, 054503 (2003).
- (9) J. P. Hague, J. Phys. Condens. Matter 15, 2535 (2003)
- (10) M. Hohenadler, M. Aichhorn, and W. von der Linden, Phys. Rev. B 68, 184304 (2003).
- (11) T. Cuk, et al., Phys. Rev. Lett. 93, 117003 (2004).
- (12) K. Ji, H. Zheng, and K. Nasu, Phys. Rev. B 70, 085110 (2004).
- (13) P. E. Kornilovitch and A. S. Alexandrov Phys. Rev. B 70, 224511 (2004)
- (14) P. Paci, M. Capone, E. Cappelluti, S. Ciuchi, C. Grimaldi and L. Pietronero Phys. Rev. Lett. 94, 036406 (2005).
- (15) G. Sangiovanni, M. Capone, C. Castellani, and M. Grilli Phys. Rev. Lett. 94, 026401 (2005).
- (16) S. Ciuchi, F. de Pasquale, S. Fratini and D. Feinberg, Phys. Rev. B 56, 4494 (1997).
- (17) G.-H. Gweon, et al., Nature 430, 187 (2004).
- (18) G.-H. Gweon, et al., submitted
- (19) J. Hubbard, Proc. R. Soc. Lond. A281, 401 (1964); R. J. Elliott, J. A. Krumhansl, and P. L. Leath Rev. Mod. Phys. 46, 465 (1974)
- (20) D.Vollhardt in Correlated Electron Systems ed. by V.J. Emery (World Scientific, Singapore, 1992)
- (21) A. Georges, et al. Rev. Mod. Phys. 68 13 (1996).
- (22) N. Bulut, D. J. Scalapino and S. R. White, Phys. Rev. Lett. 73, 748 (1994); R. Preuss, W. Hanke and W. von der Linden, Phys. Rev. Lett. 75, 1344 (1995)
- (23) M. Ulmke, R. T. Scalettar, A. Nazarenko and E. Dagotto, Phys. Rev. B 54, 16523 (1996)
- (24) N. Tomita and K. Nasu, Phys. Rev. B 60, 8602 (1999)
- (25) A.J.Millis, R. Mueller and B. I. Shraiman, Phys. Rev. B 54 ,5389, (1996).
- (26) S. Ciuchi and F. de Pasquale Phys. Rev. B 59, 5431 (1999).
- (27) W. Koller, D. Meyer, and A. C. Hewson Phys. Rev. B 70, 155103 (2004).
- (28) Handbook of Mathematical Functions ed. by M. Abramovitz and I. Stegun (Dover, New York, 1964).
- (29) T. Valla, et al. Science 285, 2110 (1999); P. D. Johnson, et al., Phys. Rev. Lett. 87, 177007 (2001).
- (30) A.A. Kordyuk, S.V. Borisenko, A. Koitzsch, J. Fink, M. Knupfer, H. Berger, Phys. Rev. B 71, 214513 (2005)
- (31) W. F. Brinkman and T. M. Rice, Phys. Rev. B 2, 1324 (1970); M. E. Fisher and W. J. Camp, Phys. Rev. B 5, 3730 (1972)
- (32) N.N. Kovaleva, et al., Phys. Rev. B 69, 054511 (2004)
- (33) S. Engelsberg and J.R. Schrieffer, Phys. Rev. 131, 993 (1963).
- (34) S. Fratini, F. de Pasquale, and S. Ciuchi, Phys. Rev. B 63, 153101 (2001)
- (35) A.S. Alexandrov and J. Ranninger, Phys. Rev. B 45, 13109 (1992); J. Ranninger Phys. Rev. B 48, 13166 (1993); G. J. Kaye, Phys. Rev. B 57, 8759 (1998)
- (36) D. S. Dessau et al., Phys. Rev. Lett. 81, 192 (1998); V. Perebeinos and P.B. Allen, Phys. Rev. Lett. 85, 5178 (2000)
- (37) L. Perfetti et al., Phys. Rev. Lett. 87, 216404 (2001); L. Perfetti et al., Phys. Rev. B 66, 075107 (2002)
- (38) A. Fujimori et al., J. Phys. Chem. Solids 57, 1379 (1996); K. Okazaki et al., Phys. Rev. B 69, 165104 (2004)
- (39) D. Schrupp et al., cond-mat/0405623, accepted for publication in Europhys. Lett