Non-equilibrium coherence dynamics of a soft boson lattice
Abstract
We study the non-equilibrium evolution of the phase coherence of a Bose-Einstein condensate (BEC) in a one dimensional optical lattice, as the lattice is suddenly quenched from an insulating to a superfluid state. We observe slowly damped phase coherence oscillations in the regime of large filling factor (100 bosons per site) at a frequency proportional to the generalized Josephson frequency. The truncated Wigner approximation (TWA) predicts the frequency of the observed oscillations.
pacs:
03.75.Kk,03.75.LmProposals for interferometry with BEC have demonstrated that number squeezed states can potentially provide robust sub-shot-noise sensitivity to perturbing interactions Burnett ; Mark ; Burnett2 . The appeal of one recent proposal by Dunningham and Burnett (DB) Burnett3 is the current availability of number squeezed states in an optical lattice Orzel ; Bloch and the simplicity of the required experimental sequence. In this proposal, an array of number squeezed states is initially prepared in a suitably deep optical lattice. The lattice depth is then rapidly lowered and the system is allowed to evolve in the presence of a perturbing potential energy gradient. The lattice intensity is subsequently restored to its initial value. A final interferometric measurement of array phase coherence is used to characterize the perturbation. This sequence is loosely analogous to sub-shot-noise optical interferometry using Fock states as inputs to a Mach-Zehnder interferometer Burnett .
In this work, we examine the first stage of the DB interferometer by studying the diabatic response of highly squeezed number states in an optical lattice to a sudden reduction in the lattice intensity. This sequence induces on-site phase variance oscillations as the quantum state evolves. We observe these oscillations through characterization of the dynamic evolution of interference contrast.
Unlike the optical case, analysis of the lattice interferometric sequence is complicated by the presence of a strong non-linearity and multiple interfering modes. For the parameters of our experiments (many atoms and many lattice sites), exact solutions of the many-body equations of motion are unavailable due to the exponentially large Hilbert space needed to describe the system. Furthermore, traditional approximations fail due to their inability to describe the initial state Tolya . Thus, analysis of this dynamic evolution is an interesting problem in its own right.
The Bose-Hubbard Hamiltonian accurately describes the atom–lattice system Fisher ; Sachdev ; Jaksch . Written in terms of single particle creation and annihilation operators and ,
where the subscripts index the lowest vibrational mode for each lattice site. Here is the tunneling rate between adjacent lattice sites, is the mean field energy due to repulsive interactions between two atoms (, is the s-wave scattering length, and is the atomic mass), the number of atoms per site, and is the external potential due to a harmonic magnetic trap. (which depends on the on-site boson occupancy) and are determined from integrals over single particle wavefunctions integrals . The importance of quantum fluctuations is determined by the ratio , where indicates the superfluid to Mott-Insulator (MI) crossover Fisher ; Jaksch ; Zwerger . We characterize global array phase coherence by the quantity , where is defined as the ratio of the total number of atoms to the number of atoms in the central lattice site Tolya .
Qualitative understanding of the system dynamics can be obtained by solving Eq. 1 for a two lattice site model. Fig. 1a illustrates the evolution of the lattice number distribution following a sudden reduction in lattice intensity under conditions similar to those used in the experiments described below. Fig. 1b shows the associated phase distribution (obtained through a Fourier transform of the number distribution coefficients). For the two site system, the characteristic frequency for these oscillations is determined by the generalized Josephson frequency smerzi2 ; Legget . At the point of the first phase revival ( 6 ms in Fig. 1b), the phase variance is sub-Poissonian while the number variance is super-Poissonian. In principle, this enables interferometric measurement of phase shifts below the atom shot-noise limit Mark .
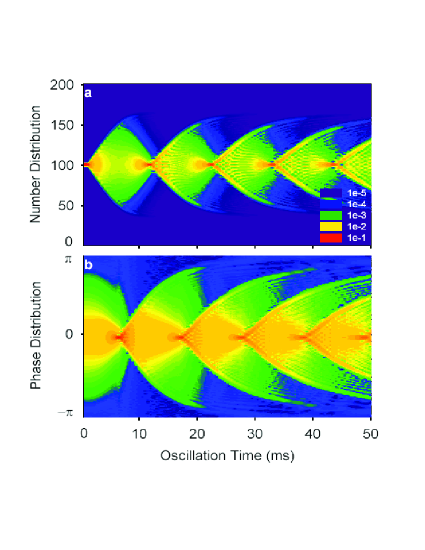
a) Evolution of the number distribution of a two site system following a 200 ms lattice intensity ramp to and a subsequent diabatic lowering of the tunnel barrier to , for N = 100 atoms per lattice site. False color exponential scaling denotes probability of number distribution in one site. b) Associated phase distribution.
In the case of the full lattice system, we employ the TWA Steel ; ap1 to obtain approximate array dynamics. Under this approximation, the quantum mechanical expectation value of an observable is replaced by a semiclassical ensemble average. Specializing to the lattice system, we consider a set of wavefunctions which evolve according to the semiclassical, discrete Gross-Pitaevskii equation of motion (GPE) GPeq ; Tolya :
The initial condition , where the phases are sampled from a uniformly distributed ensemble of values between and , and are determined from the GPE groundstate solution.
The TWA approach is accurate for suitably short times and can be applied to this problem since the time evolution occurs in the semiclassical superfluid regime ap1 . It has been used to analyze the breakdown of adiabaticity for the lattice squeezing experiments described in Ref. Orzel and also to study damping of dipolar motion in an optical lattice ruos ; pw . Density matrix renormalization group (DMRG) techniques have recently been used to study non-equilibrium dynamics of boson lattices with low filling factor Clark , but these methods are difficult to extend to large filling factors Vidal .
The apparatus used in this work is described in Refs. Anderson ; Orzel . 87Rb atoms confined in a TOP trap are evaporatively cooled to produce nearly pure condensates in the state which contain atoms at . After adiabatically relaxing the confining harmonic potential, the BEC is loaded into a vertically oriented one dimensional optical lattice. The lattice is produced by a retro-reflected nm laser beam focused to a m intensity radius at the point of overlap with the BEC. This light field provides strong transverse confinement in addition to periodic confinement along the propagation axis. For example, at a well depth of ( 3.23 kHz, with ), the transverse oscillation frequency is Hz, significantly larger than the Hz radial frequency of the magnetic trap lattice .
We load the atoms into the optical lattice by linearly increasing the lattice intensity to in ms (see Fig. 2a). At , we infer 0.019 Hz, and for the central lattice site (). We then rapidly lower the lattice intensity (in a ms ramp) to a final level with a corresponding groundstate in the superfluid regime. In our experiments, ranges from 12 to 32 , covering the parameter intervals 1 Hz 2 Hz and 42 Hz 1 Hz. The time scale for lowering the potential is chosen to be fast compared to the characteristic time scale for adiabatic evolution of the many-body ground state but slow with respect to the oscillation frequency of the individual wells.
We stroboscopically follow the evolution of the array phase coherence after lowering the lattice intensity to by holding the atoms in the lattice at before releasing them and observing the interference of their de Broglie waves. Fig. 2b displays a series of absorption images of the atomic density profile as the quantum state evolves. We define a contrast parameter as the ratio of the width of a single peak to the separation between the peaks; large indicates loss of interference contrast. Fig. 2c shows the oscillatory response of as a function of hold time. Remarkably, the system evolves from an initial state with poor coherence to one with sharp coherence and then returns back, possibly indicating a transition from an insulator to a superfluid, then back to an insulator.
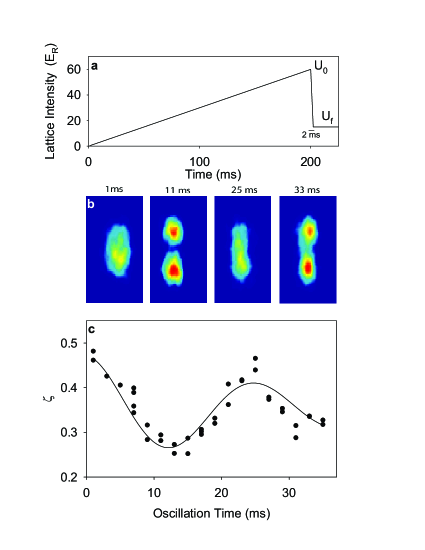
a)Experimental sequence for the lattice intensity ramp. The lattice is ramped to a peak value near the insulating regime and then rapidly decreased to . b) Absorption images of the atom density profile for indicated hold times. c)Phase variance oscillation with , and Hz.
To make contact with theory, we study the dependence of the phase variance oscillation period on the final lattice depth (see Fig. 3a). is determined through a non-linear least squares fits of the functional form to the oscillation data ( is the characteristic damping time and is the hold time). For we observe a monotonic increase in as is increased. The observed period shows a much weaker dependence on than, for example, the characteristic period associated with the GPE predicted quadrupole breathing mode stringari (solid line in Fig. 3a).
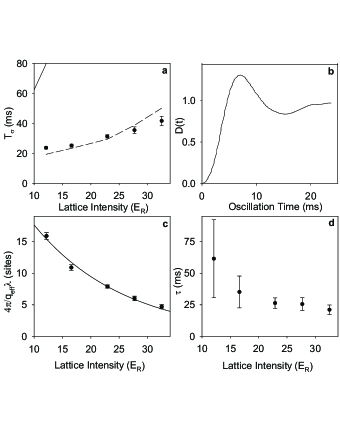
a) Phase contrast oscillation period vs. lattice intensity. Dashed line depicts results of TWA scaled by a factor of 2.1. For comparison, solid line in the upper left hand corner denotes the quadrupole mode excitation spectrum calculated using GPE. b) TWA simulation for D(t) with = 23 . c) lattice sites vs. lattice intensity. Solid line is exponential fit to data. d) Damping coefficient vs. lattice intensity.
On the other hand, TWA predicts a weak dependence of on , in agreement with observations. TWA periods are inferred from the time required for to reach its maximum value (see Fig. 3b) but are scaled by an overall factor of 2.1 in Fig. 3a (dashed line). This scaling factor may have its origin in the breakdown of TWA at longer times. In Fig. 3c we represent the observed frequencies in terms of effective phonon wave-vectors through the (translationally invariant lattice) phonon dispersion relation bogo ,
| (1) |
Here is the lattice period. We find the value such that is equal to the observed frequency . For sufficiently large the observed frequencies correspond to short wavelength excitations, whose frequency is proportional to the generalized Josephson frequency. For our parameters, this frequency is much faster than the tunnelling frequency which has been observed to determine the time scale for the onset of coherence in lattice systems with low filling factor Bloch . It is interesting to note that an exponential fit to the data extrapolates to site at 55 , a lattice depth close to the MI cross-over. Fig. 3d shows the measured damping coefficient . As qualitatively expected, faster damping rates are observed with increased Tolya ; Ehud . Future studies of the damping rate as is tuned near the superfluid-MI phase transition may provide interesting insight into the quantum critical regime Zurek ; Ehud .
Due to non-adiabaticity in the state preparation sequence, we also investigate the possible effect of remnant phase coherence in the initial state on the observed dynamics. We do this by studying the dependence of the oscillations on , keeping fixed. If the dynamics are driven largely by quantum fluctuations, we expect dynamics to be independent of for large (where the associated phase variance approaches 2). We find , and Hz, for , and respectively with (Fig. 4a). These observations are consistent with the TWA analysis, where is shown in Fig. 4b for and . For comparison, we show numerical solutions to GPE, which we obtain by integrating Eqs. 2 over the entire experimental sequence including the state preparation, taking as the initial condition. In contrast to our observations and the TWA, these solutions show a strong dependence on the value of (Fig. 4c). Finally, we independently assess the role of non-adiabaticity through investigation of exact solutions to the two well model for conditions of our experiments. In all cases, we find the number fluctuations of the initial state to be at the 1 atom per lattice site level and observe no dependence of the observed frequency on residual number fluctuations.
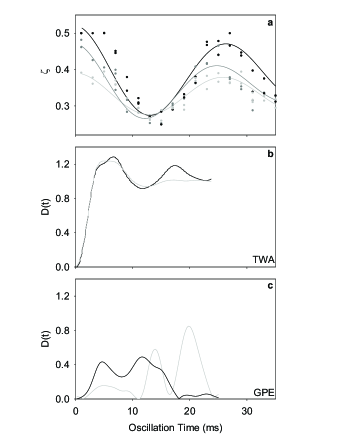
a) Phase variance oscillations for = 80 (black), 63 (dark grey) and (light grey) with = 17 . b) Numerical model of the lattice sequence using the TWA for = 80 (black) 50 (grey) c) Numerical model simulation of for lattice sequence in Fig. 2a using GPE for = 80 (black) and 50 (grey).
In summary, we have shown that the TWA can accurately model the non-equilibrium dynamics for the soft boson lattice system. In future work we will seek to study these dynamics in the quantum critical regime as well as to exploit them to demonstrate sub-shot-noise interferometry.
References
- (1) M. J. Holland and K. Burnett, Phys. Rev. Lett. 71, 1355 (1993).
- (2) P. Bouyer and M. A. Kasevich, Phys. Rev. A 56, R1083 (1997).
- (3) J. A. Dunningham, K. Burnett, S. Barnett, Phys. Rev. Lett. 89, 150401 (2002).
- (4) J. A. Dunningham and K. Burnett, Phys. Rev. A 70, 033601 (2004).
- (5) C. Orzel, A. Tuchman, M. Fenselau, M. Yasuda, M. Kasevich, Science 291, 2386 (2001).
- (6) M. Greiner, O. Mandel, T. Esslinger, T. Hänsch, I. Bloch, Nature 415, 39 (2002).
- (7) A. Polkovnikov, S. Sachdev, S.M. Girvin, Phys. Rev. A 66, 053607 (2002).
- (8) M.P.A. Fisher, P.B. Weichman, G. Grinstein, D.S. Fisher, Phys. Rev. B 40, 546 (1989).
- (9) S. Sachdev, Quantum Phase Transitions (Cambridge Univ. Press, New York 2000).
- (10) D. Jaksch, C. Bruder, J.I. Cirac, C.W. Gardiner, P. Zoller, Phys. Rev. Lett. 81, 3108 (1998).
- (11) and , where are nearest neighbor single-particle states, and is the lattice potential. In the Thomas-Fermi regime in the radial direction, we find with and the radial and longitudinal oscillation frequencies characteristic of an individual lattice site.
- (12) C. Kollath, U. Schollwock, J. von Delft, W. Zwerger, Phys. Rev. A 69, 031601(R) (2004).
- (13) A. Smerzi, S. Fantoni, S. Giovanazzi, S.R. Shenoy, Phys. Rev. Lett. 79, 4950 (1997).
- (14) G. Paraoanu, S. Kohler, F. Sols, A.J. Leggett, J. Phys. B 34, 4689 (2001).
- (15) M.J. Steel, M.K. Olsen, L.I. Plimak, P.D. Drummond, S.M. Tan, M.J. Collett, D.F. Walls, R. Graham, Phys. Rev. A 58, 4824 (1998).
- (16) A. Polkovnikov, Phys. Rev. A 68, 033609 (2003); Phys. Rev. A 68, 053604 (2003).
- (17) A. Trombettoni and A. Smerzi, Phys. Rev. Lett. 86, 2353 (2001).
- (18) A. Polkovnikov and D.-W. Wang, Phys. Rev. Lett. 93, 070401 (2004).
- (19) L. Isella, J. Ruostekoski, cond-mat/0409475 (2004); J. Ruostekoski, L. Isella, cond-mat/0504026 (2005).
- (20) S. Clark and D. Jaksch, Phys. Rev. A 70, 043612 (2004). See also, G. Vidal, Phys. Rev. Lett. 93, 040502 (2004).
- (21) G. Vidal, private communication.
- (22) B. Anderson, M.A. Kasevich, Phys. Rev. A 59, R938 (1999).
- (23) Lattice depth is calibrated by resonantly heating atoms from the confining lattice potential. The peak lattice depth is inferred from measurements of atom loss as a function of modulation frequency and has a calibration error of .
- (24) M. Kramer, L. Pitaevskii, S. Stringari, Phys. Rev. Lett. 88, 180404 (2002).
- (25) K. Burnett, M. Edwards, C. Clark, M. Shotter, J. Phys. B 35, 1671 (2002).
- (26) J. Dziarmaga, A. Smerzi, W. H. Zurek, A. R. Bishop, Phys. Rev. Lett. 88, 167001 (2002).
- (27) E. Altman and A. Auerbach, Phys. Rev. Lett. 89, 250404 (2002).
- (28) This work was funded by grants from DARPA, NSF and ARO/MURI. We gratefully acknowledge A. Smerzi, S. Sachdev and S. Girvin for helpful discussions and M. Fenselau and S. Dettmer for technical assistance. A.P. acknowledges NSF grants DMR-0231631 and DMR-0213805.