Far-infrared soft mode behavior in thin films
Abstract
Temperature dependences of the optic phonons in sol-gel films deposited on sapphire substrates were studied by means of Fourier transform far-infrared transmission spectroscopy in the temperature range 20-900 K. Four films displaying different B-site order with both ferroelectric and relaxor behavior were studied. In all cases the TO mode near 80 at 10 K softens on heating to 45 following the Cochran law with extrapolated critical temperature near 700 K (400 K above the temperature of dielectric maximum, ), but above 600 K its frequency remains stabilized. It can be assigned to the A1 component of the ferroelectric soft mode inside polar clusters which form below the Burns temperature near 700 K. In the ordered PST film another mode activates below Tm in infrared spectra near 60 exhibiting also anomalous temperature dependence due to its coupling with the former mode. It is assigned to the A1 component of the F2g Raman active mode. Central mode, which appears below the Burns temperature in the THz range, is assigned to the dynamics of polar clusters. It slows down on cooling and vanishes from our spectral range below . Another overdamped excitation assigned to the E component of the soft mode appears near 30 at low temperatures.
pacs:
78.30.-j; 63.20.-e;77.22.-d; 77.84DyI Introduction
Ferroelectric relaxors, in particular complex perovskites with the general formula and , are of high interest due to their excellent dielectric, electrostrictive, and pyroelectric propertiesSamara01 . A discovery of giant piezoelectric response in relaxor based crystals by Park and ShroutPark97 turned attention of scientific community to better understanding the relaxor ferroelectricity.
Lead magnesium niobate (PMN) and lead scandium tantalate (PST) are model representatives of the relaxor ferroelectrics which exhibit high and broad maxima in the real and imaginary part of the dielectric permittivity which shift with the increasing frequency to higher temperatures. No ferroelectric (FE) phase transition occurs in PMN without bias electric field, while PST exhibits a spontaneous FE transition. Its temperature depends on the ordering of B-site ions (Sc and Ta). Disordered PST undergoes FE transition at K, while of the ordered sample appears near 300 K without typical relaxor behavior above Setter80 ; Chu93 .
It is well known that the peculiar dielectric properties of relaxors are connected with a broad dielectric relaxation (we call it central mode (CM) in analogy with inelastic scattering experiments) below the polar phonon frequencies. It stems from the dynamics of nanoscopic inhomogeneities - polar clusters. Many low-frequency experimental dielectric data exist on the behavior of CM in FE relaxors, but much less data were published about dielectric response in the MHz and GHz rangeKamba04a ; Buixaderas04 and THz data are practically missing in the literature. Neutron diffuse scattering in PMN revealedHirota02 the CM below the Burns temperature, K, where the polar nanoclusters appear. However, its frequency was not determined.
Very recently, infrared (IR) transmission and microwave dielectric dataKamba05 of PMN have shown that the CM has characteristic frequency near 20 (0.6 THz) at and its frequency dramatically slows down to sub-Hertz region on cooling to freezing temperature near 200 KBovtun04 . Simultaneously the relaxation broadens on cooling, giving rise to frequency independent losses between 100 Hz and 100 GHz at temperatures below Bovtun04 . Dielectric studies of PST up to 33 GHz revealed a two-component CM,Chu96 ; Bovtun00 however its behavior at high temperatures near was not studied. One of the aims of this study is to investigate the CM at high temperatures to confirm its vanishing (merging with the soft mode response) above .
Lattice dynamics of PMN was studied by means of Raman, IR and inelastic neutron scattering spectroscopyKamba05 ; Bovtun04 ; Siny00 ; Wakimoto02b ; Shirane03 . It was shownWakimoto02b ; Kamba05 that the lowest frequency transverse optic phonon (TO1) follows the Cochran law
| (1) |
with the extrapolated critical temperature near the Burns temperature K. It indicates that the TO1 frequency can be assigned to the FE soft mode (SM) in polar clusters. The questions arise: Is it the general behavior typical for all FE relaxors? What is the behavior of relaxors with the spontaneous FE phase transition (PT)? Does the soft mode feel the FE PT temperature (like in other displacive FEs) or rather the Burns temperature which is typically 300-400 K above ?
The phonons in bulk PST were already studied by RamanSetter87 ; Bismayer89 ; Siny89 ; Mihailova02 ; Guttler03 and IR spectroscopyReaney94 ; Petzelt98 and no optic mode softening was observed. Only small anomalies in phonon frequencies were seen in the Raman and IR spectra near . From that it was concluded that the transition is of the order-disorder type, which is, however, rather unusual for perovskite FEs.
Also the question of phonon activity in the Raman spectra is of interest. Factor-group analysis for the Pm3m space group in the paraelectric phase, corresponding to disordered PST, predicts three F1u only IR active phonons and one silent F2u mode so that no phonons should be Raman active. Nevertheless, a number of modes were observed in the Raman spectra of paraelectric phase. Siny et al.Siny89 and independently Bismayer et al.Bismayer89 explained the activity of the phonons in Raman spectra by doubling of the unit cell in the paraelectric phase due to the 1:1 B-site ordering. In this case the space group is Fmm and the factor group analysis yields the following optic vibration modes:
| (2) |
It means that 4 Raman and distinct 4 IR active modes should be expected in the spectra. However, first-order Raman lines are seen not only in B-sites ordered samples, but also in the disordered PST and in other relaxors like PMN. Siny et al.Siny89 explained this Raman activity by local short-range B-site ordering in chemical clusters. Namely, Raman scattering is sensitive to short-range (nm) order, as the mode activity is given by the phonon eigenvectors which are determined by the interatomic force constants.
Another assignment was suggested recently by Hlinka et al.Hlinka05 . They argued that Raman scattering in relaxors is primarily due to anisotropic polar clusters rather than to 1:1 B-site ordering. It would mean that the Raman-activated modes belong prevailingly to the Brillouin-zone center of the parent Pm3m cubic structure rather than to modes activated by the zone folding as it was assumed by Siny et al.
Also results of the pulsed neutron atomic pair-density function analysis by Egami et al.Egami03 speak in favor of such a picture. They have shown that the Burns temperature is the local Curie temperature below which the polar clusters are formed, but the local polarization of Pb persists up to K several hundreds of Kelvins above . Probably both mechanisms of mode activation in Raman spectra have to be considered and to distinguish between them requires more detailed studies, particularly at very high temperatures near the B-site ordering temperature. Comparison of the Raman spectra with properly evaluated IR spectra is also necessary.
Factor-group analysis in the R3m rhombohedral ferroelectric phase with the doubled unit cell due to B-site ordering yields the following optic modes:
| (3) |
and acoustic modes. It means that up to 16 TO modes simultaneously Raman and IR active plus corresponding 16 LO Raman active modes can be expected in the spectra of the ferroelectric phase. IR active modes in bulk PST ceramics were studied by means of IR reflectivityReaney94 ; Petzelt98 . The spectra revealed correlation between the degree of 1:1 B-site ordering and appearance of an extra mode at 315. The high-frequency wing of the CM was observed above room temperature in the reflectivity spectra below 30. However, the accuracy of IR reflectivity technique is limited at low frequencies and high temperatures. In this case transmission measurements are more accurate and more sensitive to absorption mechanisms, but for this purpose, due to high absorption, thin films are needed. The aim of this study is to investigate temperature dependence of the low-frequency polar phonons and CM in PST films with various B-site order in a broad temperature interval 20 - 900 K. It should allow us to shed more light on the lattice and polar-cluster dynamics between and the Burns temperature .
II Experiment
PST thin films were prepared by chemical solution deposition on sapphire substrates, which are transparent in the far IR Brinkman04 . Four films of various degree of order were investigated: disordered (annealed at 700∘C for 1 min), slightly ordered (annealed at 850∘C for 1 min), 50% ordered (annealed at 850∘C for 1 hour) and 78% highly ordered (annealed at 800∘C for 48 hours). The degree of ordering was determined by the X-ray diffraction from superlattice peak intensity and the size of the ordered regions was investigated using TEM dark-field imaging.Brinkman04 The thickness of the films was about 500 nm, plane-parallel (0001) oriented sapphire substrates were 0.5 mm thick. The unpolarized IR transmission spectra were taken using FTIR spectrometer Bruker IFS 113v at temperatures between 20 and 900 K with resolution of 0.5. A helium-cooled Si bolometer operating at 1.5 K was used as detector, an Optistat CF cryostat with polyethylene windows was used for cooling, and a high-temperature cell SPECAC P/N 5850 was used for the heating. The investigated spectral range was determined by the transparency window of the sapphire substrate; at 20 K up to 450 (15 THz), at 900 K the sample was opaque already above 190.
III Spectra evaluation
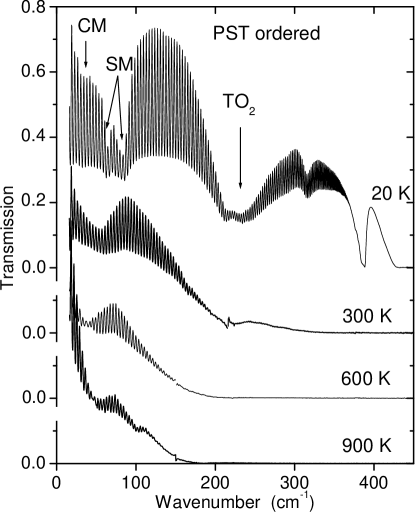
IR transmission spectra of 78% ordered PST film at selected temperatures are shown in Fig. 1. Dense oscillations in the spectra are due to interferences in the substrate, while broad minima correspond to frequencies of polar phonons in the film. Splitting of TO1 SM and TO2 phonons at 20 K is clearly seen. The spectra were taken at more than 20 temperatures. At each temperature the spectra of a bare sapphire substrate and the PST film on the substrate were measured. The overall transmission decreases on heating, mainly due to the increase in multi-phonon absorption of the sapphire substrate. The transmission spectrum of the bare substrate was first fitted with a sum of harmonic oscillators using Fresnel formulae for coherent transmission of a plane-parallel sample (i.e. taking into account the interference effects)Born . The resulting fit parameters of sapphire were then used for the fit of the PST/sapphire two-layer system.
The complex transmittance of the two-layer system was computed by the transfer matrix formalism method including interference effectsHeavens . Model of the sum of damped quasi-harmonic oscillators in the form
| (4) |
was used for the expression of the complex permittivity of the films. , and denote the frequency, damping and contribution to the static permittivity of the -th polar mode, respectively. The parameter describes the high-frequency permittivity originating from the electronic polarization and from the polar phonons contribution above the spectral range studied.

IV Results and discussion
Real () and imaginary () parts of permittivity of the 78% ordered PST thin film calculated from the fit of transmission spectra in Fig. 1 are shown in Fig. 2. The frequencies of maxima of correspond to the mode frequencies. Parameters of the modes above 200 were fixed during our fits at temperatures above 300 K because the substrate was opaque and this range is omitted in the figure. We note that the mode parameters correspond very well to parameters obtained from the bulk IR reflectivity spectra published in Ref. Petzelt98 . It shows that the phonon parameters are not influenced by possible strain or size effect in our thin films. We believe that the IR transmission spectra are more sensitive than the IR reflectivity spectra. It could be the reason why we could see also the splitting of the TO2 mode although it was not resolved in the IR reflectivity spectra.

The most important mode anomalies were observed in the range below 100. Temperature dependences of the polar mode frequencies are plotted in Fig. 3. A new heavily damped (i. e. ) excitation appears on cooling below 700 K at frequencies near 30. This mode is not manifested by a minimum in the IR transmission spectra, but rather by enhanced broad absorption at below 40. This excitation does not seem to be of usual one-phonon origin, and we assign it to dynamics of polar clusters (i.e. CM).
Disappearance of the CM above 700 K is manifested by an enhancement of the low-frequency transmission, although the high-frequency transmission continues to decrease on heating, as expected due to increase in damping of polar phonons and multi-phonon absorption (see Fig. 1). On cooling to 300 K, CM slows down to microwave range and vanishes below from our spectral range.
Another heavily damped excitation arises in our IR spectra below near 30 and remains in the spectra down to the lowest temperatures. The origin of this excitation was not fully understood until recently (in analogy to PMN, where it also appears, Kamba05 it could be explained by activation of the acoustic phonon branches due to the local unit cell doubling or translation symmetry breaking). However, now it seems to us more probable that it is just the E component of the split F1u SM (for this explanation see below).
Let us stress that our static permittivity in Fig. 2 does not correspond to experimental low-frequency permittivity, because strong dielectric dispersion exists below the phonon frequencies.Bovtun00 Bovtun et al. combined high-frequency and microwave dielectric spectra of PST ceramics between 1 MHz and 36 GHzBovtun00 with the IR reflectivity spectra Petzelt98 and revealed two dispersion regions below phonons. One, nearly temperature independent, was estimated to near 1 THz and corresponds well to our heavily damped mode near 30 below Tc. Second relaxation was seen at temperatures below 350 K in the high-frequency range and it slows down and broadens on cooling. At higher temperatures it merges with the far IR spectra so that it corresponds to the relaxation below Td near 30 assigned to the dynamics of polar nanoclusters. This relaxation is responsible for the pronounced dielectric anomaly near and above Tc. The relaxation does not completely vanish at low temperatures, because our dielectric data at 1 MHz and 8 GHz obtained on PST thin films of various B-site order show permittivity between 300 and 400 at 20 K,Brinkman04 whereas the phonon contribution to permittivity is only about 100 (see Fig. 2). This is not surprising because a small dielectric dispersion (constant dielectric losses) was observed in many relaxors at low temperatures.Kamba04a ; Buixaderas04
The lowest-frequency phonon (marked TO1) with the symmetry F1u has the frequency near 45 at high temperatures. It starts to harden below 550 K and it seems to split below . For illustration, in Fig. 3 we fitted the temperature dependences of both components by the Cochran law, but rather different extrapolated critical temperatures (700 and 1000 K, respectively) were obtained. The realistic value could be somewhere in between, but anyway, the softening ceased near 600 K and above the Burns temperature of about 700 K the expected hardening is not appreciable.
Both components of the TO1 SM have their counterparts also in Raman spectra,Bismayer89 , but the assignment of the modes in Raman spectra is more speculative. One mode near 56 dominates the Raman spectrum below 100 in the paraelectric phase.Bismayer89 If we assume that it is Raman active due to the B-site ordering, it should be of F2g symmetry, stemming from the Brillouin zone boundary of simple cubic perovskite structure. Its frequency is by about 10 higher than that of the F1u mode in our IR spectra (Fig. 3). At low temperatures a triplet appears in Raman spectra with frequencies about 50, 60 (strong peak) and 80 (at 100 K).Bismayer89 The mode near 80 corresponds to the A1 component of our TO1 SM, which may activate in Raman spectra below Tc. The mode near 50 could be assigned to the E component of the cubic F2g mode and is seen only in Raman spectra, although it could be also (weakly) IR active. The mode near 60 frequency could correspond to the E component of the TO1 SM (see Fig. 3) or to A1 mode from the split F2g mode. The latter explanation is more realistic because this mode is the strongest one in the Raman spectra, and its strength decreases in IR spectra with increasing disorder at the B-sites (see Fig. 4). This would mean that the mode near 30 should be assigned to the E component of the polar SM (F1u). This mode should remain IR active up to 700 K due to the dielectric anisotropy in polar clustersHlinka05b , but it is probably screened by the CM at high temperatures. This assignment sheds a new light on softening of both modes near 80 and 60. The higher-frequency mode softens and because both modes are of the same A1 symmetry so that they can bilinearly couple which results also in partial softening of the lower-frequency mode due to the mode repulsion.
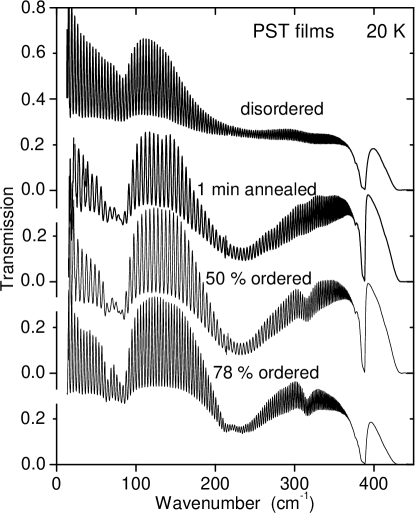
Let us discuss the question how the polar-phonon parameters in PST are influenced by the different B-site ordering. The difference is best remarkable at 20 K, where the phonon damping is minimized and the phonons up to 400 can be resolved in our IR spectra. Transmission spectra of four PST films with various order are compared at 20 K in Fig. 4. One can see that the TO2 splitting (two minima near 230) is appreciable only in the highest ordered film. TO1 splitting below 100 is less and less pronounced with the decrease in ordering, but mostly due to the increase in the linewidths.
Let us note that the film annealed at 850∘C for 1 min does not show any ordering in XRD,Brinkman04 however remarkable difference between the disordered and 1 min ordered film is seen in our IR spectra. It shows that some short range ordering occurs already in the 1 min annealed film, but XRD is not sensitive enough to see it.
Reaney et al.Reaney94 correlated the intensity of Sc-Ta stretching mode in PST seen at 315 with the degree of B-site order. One can see this mode clearly in 50% and 78% ordered films, in the other two samples only a weak shoulder appears (Fig. 4). Unfortunately, we cannot establish any quantitative correlation between the intensity of this mode and the degree of order. Namely, the spectra of 78% ordered and disordered films were measured on substrates which were not polished on the bottom surface, while the other two substrates were well polished on both surfaces. Matted bottom surface causes parasitic diffuse scattering of the IR beam at higher frequencies which is responsible for the lower value of the transmission peak at 400 in the corresponding film spectra. Fortunately, the quality of the rear substrate surface has no influence on our spectra below 200 because the IR beam with wavelength larger than 50m does not feel its roughness.

Temperature dependences of the mode frequencies in disordered PST film are plotted in Fig. 5. The mode near 60 appears only below 100 K due to the line broadening compared to ordered film. Its lower strength than in ordered sample gives evidence that it is the A1 component of the F2g Raman mode. The A1 component of the TO1 SM exhibits behavior similar to that in the 78% ordered film: it softens on heating towards the Burns temperature which ceases above 700 K. CM appears below 650 K and slows down below our spectral range on cooling. The new heavily damped mode (probably the E component of the F1u SM) appears below at 30. This mode was observed in all studied PST films as well as in the PMN filmKamba05 . In Ref.Kamba05 we suggested that the overdamping of the SM in the inelastic neutron scattering spectra of PMN (so called ”waterfall” effect) is only an apparent effect. We suggested that the SM were underdamped (as in IR spectra) but disappeared from the neutron spectra due to its overlapping with the CM which approached the THz range near . The SM and CM behavior in PMN and PST is therefore very similar, but to our knowledge, PST was not studied by inelastic neutron scattering so that no similar comparison is possible.
In conclusion, our IR transmission spectra of variously ordered PST thin films show qualitatively the same behavior: soft TO1 phonon of F1u symmetry splits on cooling below the Burns temperature. A1 component hardens and follows the Cochran law with extrapolated critical temperature slightly above the Burns temperature. The low-frequency E component is clearly seen at low temperatures, but it is probably active up to Td, where it is screened by the overdamped CM with similar frequency. CM stemming from dynamics of polar clusters appears below the Burns temperature and slows down to . Similar behavior was observed also in the PMN relaxor,Kamba05 so it seems that such a phonon and CM behavior is general for most perovskite relaxor ferroelectrics.
Acknowledgements.
We are grateful to J. Hlinka for useful discussions. This work was supported by the Grant Agency of Academy of Sciences (projects Nos. A1010213 and AVOZ10100520), Grant Agency of the Czech Republic (projects No. 202/04/0993) and Ministry of Education of the Czech Republic (project COST OC 525.20/00).References
- (1) G. A. Samara, Solid State Physics, Advances in Research and Applications, Vol. 56. San Diego: Academic Press, 240-458 (2001).
- (2) S.-E. Park, T. S. Shrout, J. Appl. Phys. 82, 1804 (1997).
- (3) N. Setter, L. E. Cross, J. Mater. Sci. 51, 2478 (1980).
- (4) F. Chu, N. Setter, A. K. Tagantsev, J. Appl. Phys. 74, 5129 (1993).
- (5) S. Kamba and J. Petzelt, Piezoelectric Single Crystals and Their Application, Ed. by S. Trolier-McKinstry, L. E. Cross and Y. Yamashita, Penn State University, 257, 2004.
- (6) E. Buixaderas, S. Kamba, and J. Petzelt, Ferroelectrics 308, 131 (2004).
- (7) K. Hirota, Z.-G. Ye, S. Wakimoto, P. M. Gehring, and G. Shirane, Phys. Rev. B 65, 104105 (2002).
- (8) S. Kamba, M. Kempa, V. Bovtun, J. Petzelt, K. Brinkman, and N. Setter, cond-mat/0412017.
- (9) V. Bovtun, S. Kamba, A. Pashkin, M. Savinov, P. Samoukhina, J. Petzelt, Ferroelectrics 298, 23 (2004).
- (10) F. Chu, N. Setter, C. Elissalde, and J. Ravez, Mat. Sci. Eng. B38, 171 (1996).
- (11) V. Bovtun, V. Porokhonskyy, J. Petzelt, M. Savinov, J. Endal, C. Elissalde, and C. Malibert, Ferroelectrics 238, 17 (2000).
- (12) I. G. Siny, R. S. Katiyar, and A. S. Bhalla, Ferroelectrics Review, 2, 51 (2000).
- (13) S. Wakimoto, C. Stock, Z.-G. Ye, W. Chen, P. M. Gehring, and G. Shirane, Phys. Rev. B 66, 224102 (2002).
- (14) for review of neutron scattering in relaxors see for example G. Shirane and P. M. Gehring, in Morphotropic Phase Boundary Perovskites, High Strain Piezoelectrics, and Dielectric Ceramics, ed. K. M. Nair, W. K. Wong-Ng, A. Bhalla, D. Viehland, D. Suvorov, in Ceramics Transactions, 136, 17 (2003).
- (15) N. Setter and I. Laulicht, Appl. Spectrosc. 41, 526 (1987).
- (16) I. G. Siny and T. A. Smirnova, Fiz. Tverd. Tela 30, 823 (1989), Ferroelectrics 90, 191 (1989).
- (17) U. Bismayer, V. Devarajan, and P. Groves, J. Phys.: Condens. Matter 1, 6977 (1989).
- (18) B. Mihailova, U. Bismayer, B. Güttler, M. Gospodinov, and L. Konstantinov, J. Phys.: Condens. Matter, 14, 1091 (2002).
- (19) B. Güttler, B. Mihailova, R. Stosch, U. Bismayer, M. Gospodinov, J. Mol. Structure, 661-662, 469 (2003).
- (20) I. M. Reaney, J. Petzelt, V. V. Voitsekhovskii, F. Chu and N. Setter, J. Appl. Phys. 76, 2086 (1994).
- (21) J. Petzelt, E. Buixaderas, and A. V. Pronin, Mater. Sci. Eng. B 55, 86 (1998).
- (22) J. Hlinka, I. Gregora and J. Pokorný, and M. Iwata, submitted to Phys. Rev. B
- (23) T. Egami, E. Mamontov, W. Dmowski, S. B. Vakrushev, Fundamental Physics of Ferroelectrics, AIP Conference Proceedings 677, 48 (2003).
- (24) K. Brinkman, PhD. Thesis, EPF Laussanne 2004.
- (25) M. Born and E. Wolf, Principles of Optics, Oxford, Pergamon, 1960.
- (26) O. S. Heavens, Rep. Prog. Phys. 22, 1 (1960).
- (27) J. Hlinka, T. Ostapchuk, J. Petzelt, D. Noujni, and S. Kamba, submitted to Phys. Rev. Lett.