Normal Emission Study on Body-Centered-Cubic Ni222As a supplemental material for C. S. Tian, D. Qian, D. Wu, R. H. He, Y. Z. Wu et al., Phys. Rev. Lett. 94, 137210 (2005).
Abstract
The first normal emission experiment result on bcc Ni ultrathin film is presented in comparison with the one on fcc Ni. Its agreement with band structure calculation, by supplementing our former results on the magnetic properties of bcc Ni, verifies from the electronic viewpoint the successful epitaxy of this metastable phase of Ni which doesn’t exist in nature.
pacs:
PACS numbers: 75.30. Cm, 79.60.-i, 81.20. CnThe different crystalline structure of bcc Ni from that of its fcc counterpart implies a distinct electronic structure should be readily observable. In order to verify this, the angle-resolved photoemission study with variable photon energies (h’s) was performed on 1.6-nm thick bcc Ni and fcc Ni films, respectively, along the direction (normal emission), with fcc Ni film grown on Cu(001) substrate for comparison. The two films at the chosen thickness are both expected to have well-defined crystalline structures with pretty good quality thus making possible the probe of their intrinsic line shapes basically free of the contribution from the substrates at the chosen film thickness. Data were obtained at 170K that is below the ’s of the Ni films with an incident angle of radiation .
As shown in Fig. 1, two main features can be identified by the eye showing a great difference between the valence band structures of the two crystalline phases. First, a contrast in line shape is found for each pair of energy distribution curves (EDC’s) obtained at the same on the two crystals, i.e., a multi-component nature is more readily observed in the fcc Ni spectra while a seemingly single broad peak persists in the whole range in the bcc case. Second, in contrast to the apparent band dispersion in the fcc case, the valence bands of bcc Ni conjure to exhibit a virtually non-dispersive character other than a discernible Fermi crossing of one or two of the low-lying states.
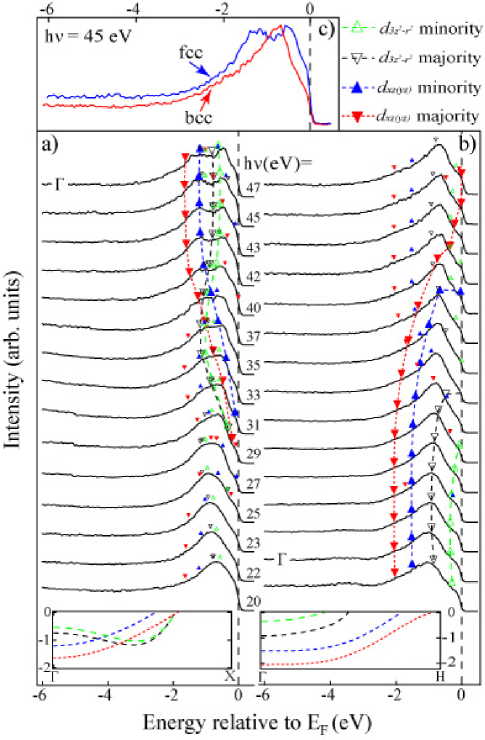
In order to obtain further insights into the dispersion along , identifications of the experimental peak features based on the first principle calculation results are made. Instead of following a widely-used scheme where points with each representing an experimental peak feature are sprinkled over the predicted dispersion, we prefer a straightforward expression by superimposing the theoretical guidelines to the experimental EDC’s overlay. This bypasses the difficulty in achieving an objective determination on the positions of the overlapping peaks from a single broad feature in the experimental curves and thus increases the robustness of comparison.
In Fig. 1, under the normal emission selection rule, the theoretical band maximums given by a routine conversionConversionNote of the G-DFTGDFT as well as the LAPWLAPW dispersion results are indicated respectively for the fcc and bcc case. Note that the mini symbols on the EDC’s represent features by transitions beyond the first in-plane BZLuThesis and account for the features in the EDC’s (27 eV) where no direct transition in the first in-plane BZ within the interested energy window exists. A nice agreement between the theory and the experiment is obtained on the main EDC features and their dispersions as well as the persistent Fermi cutoffs observed due to the sequential Fermi crossings of several bands obscured by the finite momentum resolutionZXTiTe2 .
In the fcc Ni spectra, two main peaks are observed around the BZ center ( point), corresponding to the EDC taken with h=45 eVfccNi_uv ; fccNisurfacestate . In contrast, for the bcc case, a persisting broad line shape composed of flat bands in parallel dispersions as well as the gradual dying out of the minority band starting from 0.3 eV toward suggest that =22 eV probes the transitions around point. The quite opposite correspondence between the ’s and the momentum fraction along is caused by the difference in lattice constant between bcc and fcc Ni.
I Appendix
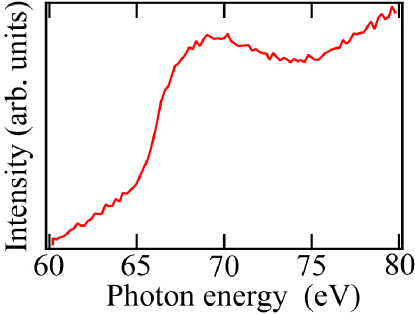
We also find the resonance of the 6-eV satellite peak with the 68-eV photon in bcc Ni/GaAs(001) (Fig. 2) by the Constant Initial State measurement on the 6-eV feature). This observation points to its structural independence confirming that this many-body phenomenon originates from the atomic nature of Ni (consistent with Ref. 6eVresonance ). The interest of this conclusion is related to the correlation effect issue in bcc Ni. But since it occurs both in fcc and bcc Ni, our manuscript which focuses on the fcc-bcc spectral difference doesn’t include a detailed discussion of this result.
References
- (1) A free-electron-like (FEL) final state is assumed. The inner potential chosen for fcc final state is -5 eV, which is consistent with Ref. fccNi_uv . The 3 eV for bcc later is determined by achieving a qualitatively best fit to the main EDC features and consistent with the result of a direct parabolic fit on the conduction band.
- (2) J. Buenemann, F. Gebhard, T. Ohm, R. Umstaetter, S. Weiser, W. Weber, R. Claessen, D. Ehm, A. Harasawa, A. Kakizaki, A. Kimura, G. Nicolay, S. Shin, and V.N. Strocov, Europhys. Lett. 61, 667 (2003).
- (3) Y. S. Shi, D. Qian, G. S. Dong, X. F. Jin, and D. S. Wang, Phys. Rev. B 65, 172410 (2002).
- (4) D. H. Lu, Ph.D. thesis, Inst. of Phys., Chin. Acad. of Sci., 1997.
- (5) R. Claessen, R. O. Anderson, G. CH. Gweon, J. W. Allen, W. P. Ellis, C. Janowitz, C. G. Olson, Z. X. Shen, V. Eyert, M. Skibowski, K. Friemelt, E. Bucher, and S. Hüfner, Phys. Rev. B 54, 2453 (1996).
- (6) H. Mårtensson and P. O. Nilsson, Phys. Rev. B 30, 3047 (1984).
- (7) E. W. Plummer and W. Eberhardt, Phys. Rev. B 20, 1444 (1979).
- (8) N. B. Brookes, A. Clarke and P. D. Johnson, Phys. Rev. B 46, 237 (1992).