Non-equilibrium dynamics in amorphous Si3B3N7
Abstract
We present extensive numerical investigations of the structural relaxation dynamics of a realistic model of the amorphous high-temperature ceramic a-Si3B3N7, probing the mean square displacement (MSD) of the atoms, the bond survival probability (BSP), the average energy, the specific heat, and the two-point energy average. Combining the information from these different sources, we identify a transition temperature K below which the system is no longer ergodic and physical quantities observed over a time show a systematic parametric dependence on the waiting time , or age, elapsed after the quench. The aging dynamics ’stiffens’ as the system becomes older, which is similar to the behavior of highly idealized models such as Ising spin-glasses and Lennard-Jones glasses.
Pacs.No 02.50.-r,61.43.Fs,64.70.Pf,65.60.+a
1 Introduction
Physical aging of polymers and other ’soft’ materials was studied experimentally almost three decades ago by Struik and co-workers [1, 2]. The interest of a wider community for this area was then greatly stimulated by work of Lundgren et al. [3] on the magnetic properties of spin glasses, and aging has since remained a source of important questions and insights in non-equilibrium statistical physics [4].
The basic features of aging were mainly established during the eighties in studies of magnetic linear susceptibility and autocorrelation function of spin glasses [5, 6, 7, 8], but are shared by many other systems, including, to cite only a few examples, type II superconductors [9], glasses [10, 11, 12, 13, 14], granular materials [15], and soft condensed matter [16]. Following a rapid quench of a relevant parameter, e.g. when the temperature of a glass is rapidly lowered below a threshold value, aging materials are unable to re-equilibrate within the available observation time. What is observed is a slow change of physical properties which occurs at a decelerating pace, and in a fashion largely independent of most details of the microscopic interactions. More precisely, physical observables systematically depend on the system age , i.e. the time elapsed from the initial quench, and the observation time . Based on the relative values of and , two dynamical regimes can be identified: For , macroscopic physical averages are approximately constant, and two-time correlations are related to the linear response through the fluctuation-dissipation theorem. Such a ’quasi-equilibrium’ regime strongly resembles the time translational invariant dynamics of thermal equilibrium, except for the fact that many quantities, e.g. relaxation times, can carry a parametric age dependence. For , physical averages visibly drift and two-time averages no longer obey the fluctuation dissipation theorem.
Recent improvements in time resolved spectroscopic techniques [17, 18, 19, 20], have highlighted that, far from being a smooth flow, the drift of aging systems results from a highly irregular, so-called intermittent, process, whereby sudden and large configurational re-arrangements [21] punctuate the prevailing equilibrium-like fluctuations. These intermittent events may correspond to irreversible jumps from one metastable state to the next [22, 23].
Aging has raised a wealth of theoretical questions, for example, whether the non-equilibrium aging regime can be described through the concept of effective temperature [24, 25]. Of direct relevance for the present investigations is the origin of the so-called pure aging behavior, i.e. the scaling of various observables in the aging regime [21, 26] and of modifyied scalings [27] which are called sub-aging and super- or even hyper-aging.
This work discusses numerical investigations of the dynamical and thermodynamical properties of a realistic model of a-Si3B3N7 for a large temperature range. The material is a representative of a class of nitridic ceramics with chemical composition a-SixByN1Cz[28, 29, 30, 31, 32, 33, 34, 35, 36, 37] which can be synthesized via the sol-gel process[33]. These ceramics are of great technological interest and are presently considered for high-temperature engine applications.
Nitridic ceramics appear to form amorphous covalent networks with a homogeneous distribution of the cations at least down to a scale of 1 nm[38]. Experimental studies have mainly focused on the quaternary compound a-SiBN3C. Under standard conditions, both a-SiBN3C and a-Si3B3N7 are thermally stable and amorphous up to very high temperatures, e.g. about K for a-SiBN3C. They possess excellent mechanical and elastic properties: e.g. a-SiBN3C has a high bulk modulus of ca. GPa, and is stable against oxidation up to K.
The amorphous structure suggests a similarity with glassy materials, and hence the presence of aging properties of potential technological relevance. Probing the glass transition of e.g. a-Si3B3N7, the basic representative of this class of nitridic ceramics, is impossible at standard conditions, since decomposition takes place at K, i.e. well before the ceramic melts. However, the melting transition might be accessible, as we have argued, at very high pressures [39].
The MC simulations presented below aim at the determination of the temperature range below which the non-ergodic behavior of a-Si3B3N7 sets in, and at the characterization of the aging dynamics in that low temperature regime. Admittedly, determining ”for all practical purposes” whether a system is ergodic or not is not straightforward and is possibly an ill-posed question[40]. As will become clear from the discussion, we refer to non-ergodic behavior as a collection of dynamical properties usually associated with glassiness, which, taken together, describe a strong deviation from thermal equilibrium.
To detect the onset of ergodicity breaking and characterize the behavior in both the ergodic and non-ergodic regions, we consider a number of relevant dynamical and thermodynamical measures: 1) The physical movement of the particles, as statistically characterized by the Mean Square Displacement (MSD), is diffusive in the ergodic region, and sub-diffusive elsewhere. 2) The related Bond Survival Probability (BSP)[41] drops to a finite average close to zero on a characteristic time scale at sufficiently high temperatures but becomes scale-free and age dependent in the non-ergodic region. There, it decreases as a logarithmic function of , where is close to one and depends on the type of particles forming the bond. 3) The specific heat is calculated in three different ways, which agree in equilibrium but markedly differ in the non-ergodic region. 4) The two-time energy-energy average defined in equation 6. By construction, equals one in equilibrium or in a quasi-equilibrium regime, and is larger than one when the system is out of equilibrium. 5) The age dependence of the energies of the local minima or so-called inherent structures (IS)[42] characterizing the trajectories in the non-ergodic regime. These energies decrease logarithmically with the age.
The rest of the paper is structured as follows: in Section 2 we introduce the model and simulation technique. In Section 3 we define the statistical measures used to probe the ergodicity breaking and present the corresponding results. Finally, Section 4 contains a broader discussion of the results, where we show that our findings are in general agreement with previous studies of the aging dynamics of much simpler atomistic models [12, 43, 44] and also with experimental results in e.g. spin-glasses [45], polymer systems[2] and charge-density waves [46].
2 Model and Techniques
The model of a-Si3B3N7 consisted of Si-atoms, B-atoms and N-atoms, respectively, in a Å3 cubic box. As an interaction potential, we employed a two-body potential from the literature[47] based on fits to ab-initio energy calculations of crystalline and molecular compounds containing Si-, B- and N-atoms. This potential successfully reproduces experimental data regarding structural properties such as bond lengths, and bulk properties, e.g. vibrational frequencies, of the binary compounds Si3N4 and BN and of molecules containing SiNB units.
The starting configurations for our simulations were generated by relaxation from high-temperature melts. The simulations were performed at fixed temperature and volume, with a Monte-Carlo algorithm using the Metropolis acceptance criterion. In each update, an atom is randomly selected for an attempted move with a random direction, and with an average size chosen to achieve an acceptance rate of %. One Monte-Carlo cycle (MCC) corresponds to such individual moves. Note that the kinetic energy ( per atom) does not appear in MC-simulations, and that all quantities studied relate to the configurational energy. For comparison, we also performed MD simulations in the melt. Comparing mean square displacements determined from MD and MC simulations, respectively, we estimate that (at least in the high-temperature regime) one MCC corresponds to about 0.5 fs. At low temperature, the value of the microscopic time scale is not known precisely. However, this value is not crucial for the study of aging quantities which, as in our case, have a logarithmic time dependence or depend on the ratio of two times[48].
The temperatures investigated ranged from 25 to 10000 K; however, for K no discernible dynamical evolution took place on the time scale of the simulations. For each temperature up to K and above K, and runs, respectively, of length MCC were performed.
The energy as function of time was registered every MCC. Along the individual trajectories for K, halting points were chosen, from which conjugate gradient minimizations were performed. In the following, MCC is the initialization time of the MC-simulations needed for the system to reach equilibrium in the ergodic regime (i.e. at high temperatures), while is the waiting time before the observations begin. Furthermore, an ensemble of runs of length MCC was studied, in order to investigate aging in greater detail, and with better statistics. Each starting configuration of the ensemble was generated by quenching the system from K to K. 111Due to the rather expensive energy evaluation, performing the runs in this ensemble required approximately a computing time of one year on a AMD/1800 PC.
The diffusivity of the atoms in the high temperature regime was calculated straightforwardly from the mean square displacement as a function of time via the Einstein-Smochulowski relation (). Finally, in the bond survival probability data, a B-N or Si-N bond was considered broken if the interatomic distance was above Å.
In computing time averages and correlations we considered the observation interval . Time averages over are denoted by an over-bar, while an angular bracket stands for an average over an ensemble of independent trajectories.
3 Ergodicity-breaking and aging behavior
3.1 Ergodicity breaking
Evidence for ergodicity breaking can be extracted from a change of behavior in dynamical quantities i.e. the MSD and BSP, as well as from thermodynamical quantities, i.e. the heat capacity, the energy average and the two-point energy average. All these data concur that ergodicity breaking occurs but differ to some degree with respect to the precise value of the transition temperature . The latter can be approximately located within the range K.
We consider the high temperature behavior first. For K, the MSD between pairs of time-displaced atom positions
| (1) |
only depends on the length of the observation interval . The diffusion coefficients for the different atoms all have an Arrhenius temperature dependence, with activation barriers eV, eV for silicon and boron atoms, respectively.
In the same regime, the BSP is age independent and has a finite relaxation time . The values of were obtained by fitting the time dependence of the bond survival probability after the initialization time to a Kohlrausch-Williams-Watts law:[49]
| (2) |
yielding exponents . The time scale has an Arrhenius-like temperature dependence, with activation barriers eV and eV for Si-N and B-N bonds, respectively. Arrhenius plots for the diffusion coefficients of silicon and boron atoms and for the relaxation times are plotted in Fig. 1. A deviation from the Arrhenius scaling is apparent in both quantities as approaches 2000 K from above.

The activation barriers found for both diffusion and bond breaking are in a similar range, suggesting that a single Arrhenius time scale might characterize the high temperature dynamics. However, although diffusive processes need to be accompanied by bond-breaking, it is not clear whether this effect or steric blocking by neighbor atoms dominates the diffusion at various temperature scales.
Deviations from activated behavior appear in the relaxation time as the temperature decreases. Approaching K from above, the diffusion coefficients for B-, Si- and N-atoms all vanish for as with . A similar deviation of from an Arrhenius law is observed when K for B-N and K for Si-N, respectively, are approached from above. Close to these temperatures, grows roughly like a power law: with , and . At even lower temperatures, the particle motion becomes sub-diffusive and the BSPs fall off logarithmically. Both quantities become scale free but gain a characteristic age dependence, discussed in more detail in section 3.2.
Thermodynamical variables such as the specific heat , the energy average, and a suitably normalized two-time energy-energy average require averaging over an ensemble. For a fixed amount of numerical effort, they are hence less precisely determined than ’local’ dynamical properties, but offer nevertheless concurring insights into ergodicity breaking and aging behavior.
The heat capacity was evaluated with three different prescriptions, all agreeing in thermal equilibrium. Note, that all specific heat data are reported on a per-atom basis. The disagreement observed at lower temperature shows that the system is non-ergodic for the observational time scale used. We note that agreement at higher temperatures does not neccessarily imply that the equilibrium state is reached [50], since such an agreement is only a neccessary but not a sufficient criterion for the system to be in equilibrium.
Our first prescription is naively carried over from equilibrium thermodynamics. Leaving the dependence of the mean energy understood on the r.h.s. of the equation, we define
| (3) |
where the temperature derivative is performed numerically after the ensemble and time averaging denoted by angular brackets () and an overbar, respectively.
Secondly, we consider simulations where the temperature is increased or decreased by a small amount at age . The trajectories are then time-averaged over the time spent at .
This procedure yields
| (4) |
Finally, we gauge the variance of the energy fluctuations within the observation interval and estimate the heat capacity as
| (5) |
for a range of observation times which straddles . Figure 2, where all values are on a per-atom basis, shows that all three expressions agree for temperatures above K, but clearly disagree below K, which leads to a provisional value for the ergodicity breaking temperature K.
Within the non-ergodic region , we have studied for , the quasi-equilibrium regime, and for the non-equilibrium regime. The dependence of on , and can also be obtained from the fitted time and age dependence of the mean energy given in Eq. 7 below, by performing the time average and then differentiating with respect to . For and , we find that has a small dependence on the length of the time interval over which the time average is performed. This is connected to the logarithmic drift of the energy, which moreover is more pronounced just below than near (c.f. fig. 4).
mimics an experiment performed after some relatively long equilibration time and thus yields the most ”realistic” value for the specific heat for all temperatures. provides a way to check the validity of the fluctuation-dissipation theorem: it should coincide with the two other expressions above , and additionally, below in the restricted quasi-equilibrium region . Indeed, when increasing past the observed dynamics in changes from quasi-equilibrium to off-equilibrium in the temperature range between K and K (c.f. inset in fig. 2). Recall that the (trivial) contribution to due to the change in kinetic energy is never included, i.e., in equilibrium for K. Furthermore, the interaction potential vanishes for , and thus this contribution to goes to zero as .

As shown in fig. 2, the above prescriptions for the specific heat yield, as expected, almost identical results in the high- ergodic dynamical regime, but differ at low . This indicates that ergodicity is broken below K. Even in the low temperature region, and nevertheless roughly coincide in a restricted time interval which corresponds to the quasi-equilibrium regime . However, the inset clearly shows the large difference between in the quasi-equilibrium and the non-equilibrium regime, for temperatures below .
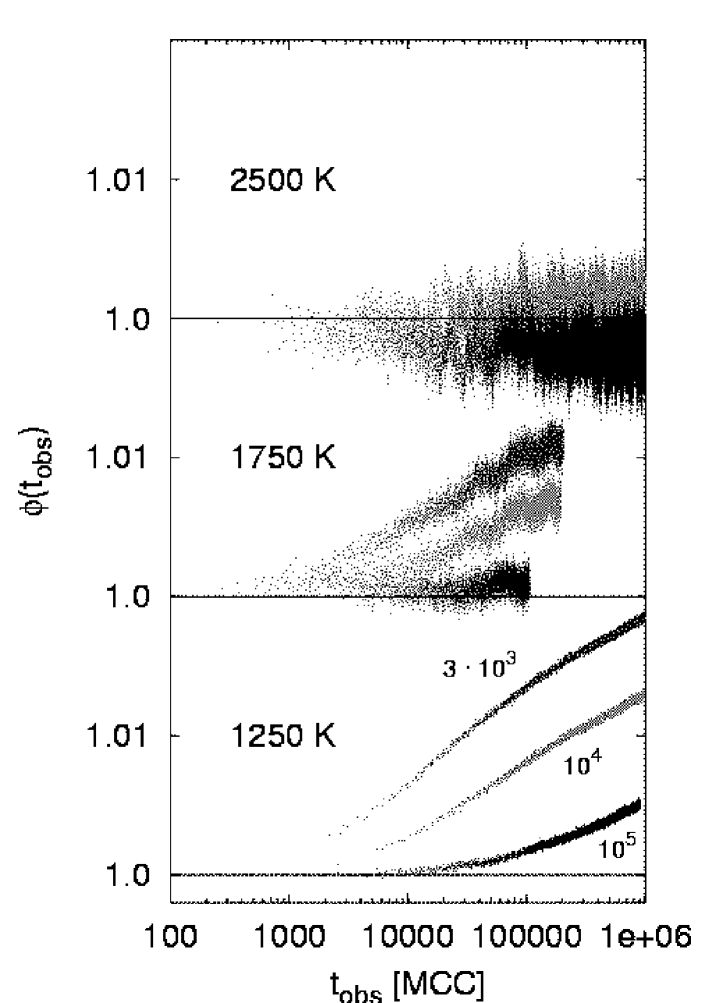
Yet another probe of ergodicity-breaking is the two-time energy average defined by
| (6) |
Above , and for below , we expect the dynamics to be time translational invariant, and hence . Considering that the energy is negative and decreases monotonically with age, we expect an increase of with observation time, once the dynamics gains access to states of considerably lower energy.
Figure 3 depicts for three temperatures, K, K and K, and for three values of the system age, and MCC. The comparison clearly shows that ergodicity is broken as described at the lowest temperature (T = 1250 K): due to the decrease of the configurational energy during aging, the two-time energy average increases as the observation time increases. At the intermediate temperature (T = 1750 K) the aging effect is still visible but difficult to quantify, and at the highest temperature (T = 2500 K) it has vanished completely.
Taking all theses indicators, MSD, BSP, and into account, we conclude that a-Si3B3N7 exhibits ergodicity breaking at K.
3.2 Aging properties
In order to describe the non-ergodic regime in more detail we have studied the age dependence of: (i) the energy of the inherent structures and of the mean potential energy, (ii) the bond survival probability (BSP), (iii) the mean square displacement (MSD) of the particles, and (iv) the two point correlation function and the closely related energy-energy autocorrelation function.
The ensemble-averaged energy of the inherent structures lying ’below’ the trajectories observed in the interval decreases logarithmically with , as does the mean potential energy . In both cases the logarithmic slope has a clear temperature dependence, but no significant dependence for MCC. The energy simply decreases logarithmically with the simulation time elapsed after the quench, i.e. to a good approximation we find the functional form
| (7) |
Here, and for potential energies and minimum energies , respectively, and
| (8) |
where the coefficients are measured in eV/(Katom). Note that energies are reported on a
per-atom basis.
The logarithmic decay of the energies is shown in Fig. 4,
and has previously been observed in other aging systems, see e.g. [10, 51, 52, 53, 54].

Bond survival probabilities at K for Si-N and B-N bonds are plotted in Fig. 5 as a function of the scaled variable for three different ages MCC. Even though the data collapse is not perfect, the scaling plots demonstrate that the bonds become, on average more resilient as the age increases. For the Si-N bond, the best collapse is obtained for . Thus, the survival probability for the Si-N bond is a function of , a so-called pure aging behavior. The survival probability for the B-N bond, however, shows a sub-aging behavior with . For both types of bonds the survival probability decays in a logarithmic fashion after a nearly flat initial part, and no cut-off is reached at low temperatures, within the time scale of the simulations.222For temperatures different from 1250 K, the scaling exponents can only be approximately determined due to the small ensemble of simulation runs at these temperatures. The values for lie in the range between 0.3 to 0.8

Another quantity that exhibits an age dependence for is the average mean square displacement of the atoms, given in Eq. 1. We observe a sub-diffusive behavior, with ( corresponds to standard diffusion), in the quasi-equilibrium region ().
The remains sub-diffusive for but with an increase in the exponent . In figure 6(a), we show the mean square displacement for three different waiting times , at temperature K. For , we find , and the curves can be approximately collapsed (c.f. figure 6(b)) if is scaled with . The exponent indicates a strong sub-aging behavior of the mean square displacement. This analysis was performed separately for all three types of atoms, Si, B and N. In all three cases, essentially the same results were found.


The two-point correlation function (c.f. fig. 3) remains very close to the equilibrium value in the ergodic temperature region ( K), and does not depend on waiting time. But in the glassy phase (T = 1750 K and T = 1250 K), strongly deviates from its equilibrium value () for . Quasi-equilibrium behavior is only observed for observation times , that grow monotonically with .333The closely related autocorrelation function also exhibits the expected aging behavior, i.e. decreases to zero from an almost constant value () once exceeds . Unfortunately, the data is too noisy for us to draw any quantitative conclusions, beyond the observation that the quasi-equilibrium regime grows monotonically with .
This monotonic dependence on of the time range during which quasi-equilibrium behavior is still observed, correlates with the stiffening of the response of the system characteristic for aging processes: The longer the system is allowed to equilibrate, the longer is the subsequent time range during which equilibrium-like behavior is observed. This effect concurs with the logarithmic decay of and (c.f. figure 4) and fully agrees with the general aging behavior previously discussed.
4 Discussion
Numerical investigations of atomistic models with realistic interactions are computationally very demanding, and for the same numerical effort, the accuracy of the results obtained is lower than what can be achieved for more simplified models. In spite of this limitation, we have shown how ergodicity is broken in a-Si3B3N7 and have characterized the dynamics in the low temperature phase, where the model behaves as a bona-fide aging system. In the aging regime the microscopic time scale of the dynamics is largely irrelevant, and so is the precise value of the conversion factor between the time scales of Monte Carlo and molecular dynamics simulations. This assumption is supported by the fact that we have observed a similar slow drift in energy at low temperature MD simulations, i.e. in the non-ergodic regime, during studies of heat transport in a-Si3B3N7.[55] Therefore, we trust that the qualitative and most of the quantitative aspects of our findings can be carried over to the real materials.
The computational analysis of a-Si3B3N7 using MSD, BSP, and shows that this amorphous material can be expected to exhibit a glass transition with a concurrent break in the ergodicity at about K if pressures high enough to prevent decomposition are applied.444Repeating these investigations for a large number of densities, we always find a similar freezing-in of the structure for . In other work, we have determined a critical point in the liquid-gas region of the ternary system ( GPa and, K) [39]. Since the tendency to decompose is greatly reduced for a supercritical fluid, we predict that a-Si3B3N7 should exhibit a glass transition at a temperature K and at a pressure of GPa. Up to now, high-pressure experiments have only been performed for K and GPa.
For , a-Si3B3N7 exhibits a general behavior in many respects similar to standard test systems for computer simulations [43, 12, 44] (Lennard-Jones, a-SiO2), insofar as we observe a freezing-in of the structure, a logarithmic decay of the energy, and a systematic waiting-time dependence of the bond survival probability, the mean square displacement of the particles and the two-time energy correlation function.
The aging behavior of the heat capacity has been studied experimentally, for charge-density-wave systems[46], and for a spin-glass model [22] and discussed theoretically for two-level systems at very low temperatures[56].
The logarithmic drift towards lower energies occurring for is also observed in a number of model systems such as Lennard-Jones [51] and soft-sphere glasses[52]. This applies both to the actual trajectories and the time-sequence of observed local minima. For fixed simulation time, the deepest local minima are reached for K, which lies right below . Analogous observations are well-known from e.g. global optimization studies of complex systems, where it has been found that reaching the deepest local minima using Monte-Carlo-type search algorithms is achieved by spending most of the search time in the temperature interval slightly below the glass transition temperature[57, 58]. Thus this result provides another confirmation that ergodicity breaking takes place at .
In summary, all the numerical evidence obtained from our simulations shows that the thermal quench of a Si3B3N7 melt produces a material in a state of strong thermodynamic disequilibrium, which then relaxes through the aging process. As we have noted in the introduction, a-Si3B3N7 is currently only synthesized via the sol-gel route. In earlier work[59], we have shown that different synthesis routes (quench from melt, sol-gel, sintering of nano-crystallites, etc.) result in amorphous compounds that exhibit a monotonic decrease in energy during simulations at T 2000 K. This applies in particular to the relaxation of the structures that result from modelling the sol-gel synthesis route[60, 61], as we observed in both constant volume and constant pressure simulations [62]. Thus, we surmise that aging phenomena analogous to those investigated here for a quenched melt also occur in the amorphous ceramic generated via the sol-gel route.
The metastable states reached during aging become gradually lower in energy, which could lead to a strengthening of the material. On the other hand, the structural transformations which would accompany aging could lead to the formation of nano-crystallites and internal ’grain boundaries’, whence the overall structure might develop e. g. cracks, and thus lead to a weakening of the mechanical properties of the material. This could especially be the case, if crystallites of binary or ternary phases are formed. However, for most envisaged applications, the time scales on which such processes might occur are beyond the accessible simulation time by many orders of magnitude.
5 Acknowledgments
Funding was kindly provided by the DFG via SFB408.
References
- [1] Turnhout, J. V.; Klaase, P. T. A.; Ong, P.; Struik, L. J. Electrostat. 1977, 3, 171-179.
- [2] Struik, L. Physical aging in amorphous polymers and other materials; Elsevier Science Ltd: New York, 1978.
- [3] Lundgren, L.; Svedlindh, P.; Nordblad, P.; Beckman, O. Phys. Rev. Lett. 1983, 51, 911-914.
- [4] Young, A. P., Ed.; Spin glasses and random fields; World Scientific: Singapore, 1998.
- [5] Alba, M.; Ocio, M.; Hammann, J. Europhys. Lett. 1986, 2, 45-52.
- [6] Nordblad, P.; Svedlindh, P.; Lundgren, L.; Sandlund, L. Phys. Rev. B 1986, 33, 645-648.
- [7] Alba, M.; Hammann, J.; Ocio, M.; Refregier, P. J. Appl. Phys. 1987, 61, 3683-3688.
- [8] Svedlindh, P.; Granberg, P.; Nordblad, P.; Lundgren, L.; Chen, H. Phys. Rev. B 1987, 35, 268-273.
- [9] Nicodemi, M.; Jensen, H. J. J. Phys A 2001, 34, 8425.
- [10] Kob, W.; Barrat, J.; Sciortino, F.; Tartaglia, P. J. Phys.: Cond. Matt. 2000, 12, 6385-6394.
- [11] Utz, M.; Debenedetti, P. G.; Stillinger, F. H. Phys. Rev. Lett. 2000, 84, 1471-1474.
- [12] J.L. Barrat,; Kob, W. J. Phys.: Cond. Matt. 1999, 11, A247-A252.
- [13] J.L. Barrat,; Berthier, L. Phys. Rev. E 2001, 63, 012503.
- [14] Berthier, L.; Bouchaud, J.-P. Phys. Rev. B 2002, 66, 054404.
- [15] Josserand, C.; Tkachenko, A. V.; Mueth, D. M.; Jaeger, H. M. Phys. Rev. Lett. 2000, 85, 3632-3635.
- [16] Cipelletti, L.; Manley, S.; Ball, R. C.; Weitz, D. A. Phys. Rev. Lett. 2000, 84, 2275–2278.
- [17] Bissig, H.; Romer, S.; Cipelletti, L.; Trappe, V.; Schurtenberger, P. Phys. Chem. Comm. 2003, 6, 21-23.
- [18] Cipelletti, L.; Bissig, H.; Trappe, V.; Ballesta, P.; Mazoyer, S. J. Phys.: Cond. Matter 2003, 15, S257-S262.
- [19] Buisson, L.; Bellon, L.; Ciliberto, S. J. Phys. Cond. Mat. 2003, 15, S1163.
- [20] Buisson, L.; Ciliberto, S.; Garciamartin, A. Europhys. Lett. 2003, 63, 603.
- [21] Sibani, P.; Dall, J. Europhys. Lett. 2003, 64, 8–14. Europhys.Lett., 69 (4), pp. 563-569 (2005)
- [22] Sibani, P.; Jensen, H. J. Europhys. Lett. 2004, 69, 563–569, see cond-mat/0403212.
- [23] Crisanti, A.; Ritort, F. Europhys. Lett. 2004, 66, 253-259.
- [24] Cugliandolo, L. F.; Kurchan, J.; Peliti, L. Phys. Rev. E 1997, 55, 3898–3914.
- [25] Calabrese, P.; Gambassi, A. cond-mat/0410357 .
- [26] Bouchaud, J. J. Phys. I France 1992, 2, 1705-1713.
- [27] Rinn, B.; Maass, P.; J.P. Bouchaud, Phys. Rev. B 2001, 64, 104414-1-104414-15.
- [28] Jansen, M.; Jäschke, B.; Jäschke, T. In Structure & Bonding; , Vol. 101; Jansen, M., Ed.; Springer-Verlag: Berlin, 2002. Chapter 1, pages 138–191
- [29] Seyferth, D.; Plenio, H. J. Am. Ceram. Soc. 1990, 73, 2131.
- [30] Baldus, H. P.; Wagner, O.; Jansen, M. . In Mater. Res. Soc. Symp. Proc., Vol. 271; Hampden-Smith, M. J.; Klemperer, W. G.; Brinker, C. J., Eds.; Mat. Res. Soc.: Warrendale, 1992.
- [31] Su, K.; Remsen, E.; Zank, G.; Sneddon, L. Chem. Mater. 1993, 5, 547.
- [32] Funayama, O.; Kato, T.; Tashiro, Y.; Isoda, T. J. Am. Ceram. Soc. 1993, 76, 717.
- [33] Jansen, M.; Baldus, P. Angew. Chem. Int. Ed. Engl. 1997, 36, 328-344.
- [34] Baldus, P.; Jansen, M.; Sporn, D. Science 1999, 285, 699-703.
- [35] Aldinger, F.; Weinmann, M.; Bill, J. Pure Appl. Chem. 1998, 70, 439.
- [36] Srivastava, D.; Duesler, E.; Paine, R. Eur. J. Inorg. Chem. 1998, 6, 855.
- [37] Riedel, R.; Kienzle, A.; Dressler, W.; Ruwisch, L.; Bill, J.; Aldinger, F. Nature 1996, 382, 796.
- [38] van Wüllen, L.; Müller, U.; Jansen, M. Angew. Chem. Int. Ed. Eng. 2000, 39, 2519-2521.
- [39] Hannemann, A.; Schön, J.; Jansen, M. subm. to Phys. Rev. E, 2004.
- [40] J. Casas-Vazquez,; Jou, D. Rep. Prog. Phys. 2003, 66, 1937-2023.
- [41] Horbach, J.; Kob, W. Phys. Rev. B 1999, 60, 3169-3181.
- [42] Stillinger, F.; Weber, T. A. Phys. Rev. A 1982, 25, 978-989.
- [43] Sastry, S.; Debenedetti, P. G.; Stillinger, F. H.; Schroder, T. B.; Dyre, J. C.; Glotzer, S. C. Physica A 1999, 270, 301-308.
- [44] Crisanti, A.; Ritort, F. Europhys. Lett. 2000, 52, 640-646.
- [45] Nordblad, P.; Svendlidh, P. In Spin Glasses and Random Fields ; Young, A., Ed.; World Scientific: Singapore, 1997; Chapter 1, pages 1–28.
- [46] Biljakovic, K.; Lasjaunias, J.; Monceau, P.; Levy, F. Phys. Rev. Lett. 1991, 67, 1902-1905.
- [47] Gastreich, M.; Marian, C.; Gale, J. Phys. Rev. B 2000, 62, 3117-3123.
- [48] Huitema, H.; J.P. v.d. Eerden, J. Chem. Phys. 1999, 110, 3267-3274.
- [49] Elliott, S. R. Physics of Amorphous Materials; Longman Scientific & Technical: Essex, 1990.
- [50] Yu, C. C.; Carruzzo, H. M. Phys. Rev. E 2004, 69, 051201.
- [51] Kob, W.; Sciortino, F.; Tartaglia, P. Europhys. Lett. 2000, 49, 590-596.
- [52] Angelani, L.; Di Leonardo, R.; Parisi, G.; Ruocco, G. Phys. Rev. Lett. 2001, 87, 5502-5506.
- [53] Kob, W.; J.L. Barrat, Eur. Phys. J. B 2000, 13, 319-333.
- [54] Dall, J.; Sibani, P. Eur. Phys. J. B 2003, 36, 233–243.
- [55] Schön, J. C.; Hannemann, A.; Sethi, G.; Jansen, M.; Salamon, P.; Frost, R.; Kjeldgaard, L. Proc. XXIII Workshop on structure and kinetics of nucleation and crystallization in non-crystalline materials, Jena September 2002; also as: cond-mat/0212279, 2002.
- [56] Parshin, D.; Sahling, S. Phys. Rev. B 1993, 47, 5677-5688.
- [57] Kirkpatrick, S.; Gelatt Jr., C. D.; Vecchi, M. P. Science 1983, 220, 671-680.
- [58] Salamon, P.; Sibani, P.; Frost, R. Facts, Conjectures, and Improvements for Simulated Annealing; SIAM Monographs: Philadelphia, 2002.
- [59] Hannemann, A.; Schön, J. C.; Putz, H.; Lengauer, T.; Jansen, M. Phys. Rev. B 2004, 70, 144201.
- [60] Schön, J. C.; Hannemann, A.; Jansen, M. J. Phys. Chem. B 2004, 108, 2210-2217.
- [61] Hannemann, A.; Schön, J. C.; Jansen, M. J. Mat. Chem. 2005, 15, 1167-1178.
- [62] Hannemann, A.; Schön, J. C.; Jansen, M. Phil. Mag. 2005, in press.