Unconventional magnetic properties of the weakly ferromagnetic metal BaIrO3
Abstract
We present experimental evidence for small-moment magnetism below the ferromagnetic transition temperature ( K) in the quasi-one-dimensional metal BaIrO3. Further, we identify rearrangement of the local magnetic moment distribution, which leaves the bulk magnetization unchanged, at the Mott-like transition ( K). These results are only possible via muon-spin relaxation (SR) techniques, since neutron scattering studies are hindered by the large absorption of neutrons by Ir. The low temperature characteristics of this compound, as revealed by SR, are unconventional, and suggest that its magnetic properties are driven by changes occuring at the Fermi surface due to the formation of a charge-density wave state.
The extended nature of the orbitals that are present in the second and third transition series oxides means that crystalline field splittings are enhanced and there is significant – hybridization between the transition metal ion and the surrounding oxygen octahedron. This leads to strong coupling between the electronic, lattice, and orbital degrees of freedom, which results in a wide variety of ground states. Complex phase diagrams result, and the electronic properties of these materials may be dramatically altered by small structural changes Ohmichi et al. (2004); Nakamura et al. (2002). BaIrO3 is a particularly interesting example: it shows weak ferromagnetism with an unexpectedly high Curie temperature, charge-density wave (CDW) formation, and a temperature-driven transition from a bad-metal state to an insulating ground state Cao et al. (2000).
The crystal structure of BaIrO3 features three face-sharing IrO6 octahedra forming Ir3O12 clusters that are vertex linked to construct one-dimensional (1D) chains along the axis Powell and Battle (1993); Gulino et al. (1995); Siegrist and Chamberland (1991). BaIrO3 is isostructural to metallic BaRuO3 Gulino et al. (1995), but the monoclinic distortion in BaIrO3 generates twisting and buckling of the cluster trimers that give rise to two 1D zigzag chains along the axis and a layer of corner sharing IrO6 octahedra in the plane bringing about both 1D and 2D structural characteristics Powell and Battle (1993); Gulino et al. (1995); Siegrist and Chamberland (1991). It is the distortions in the structure that lead to insulating behaviour; the resistivity is further drastically increased by substituting Ca for Ba, at the few percent level, which introduces additional structural distortions Cao et al. (2004).
Magnetization measurements have demonstrated a magnetic-field insensitive ferromagnetic transition at , and the -axis resistivity reveals several features: at high temperatures the behaviour is non-metallic (), with a discontinuity visible at ; at the resistivity peaks and the behaviour is metallic on cooling () until a Mott-like transition is encountered at Cao et al. (2000). Non-linear conductivity and opening of an optical gap are consistent with CDW formation accompanying the ferromagnetic ordering. This interpretation is supported by results of tight-binding band structure calculations Whangbo and Koo (2001) which show partially nested pieces of Fermi surface that could signify the formation of a CDW state. The saturation moment associated with the Ir ions, , is very small compared to the expected moment for a , ion. It has been proposedCao et al. (2000); Whangbo and Koo (2001) that the small moment is an intrinsic property caused by – hybridization and small exchange splitting rather than spin canting from a localized antiferromagnetic configuration. The addition of small amounts of Sr dopant into the material has been shown to strongly suppress the ferromagnetic transition while increasing the Ir saturation moment and inducing a nonmetal-metal transition at high temperatures Cao et al. (2004).
Muon-spin relaxation (SR) is an extremely sensitive probe of magnetism, well suited to studying the spin-order and dynamics arising from the small Ir moment; neutron scattering studies of iridates are hindered by the large neutron absorption cross section of Ir. In order to provide a unique insight into the magnetic properties at a local level, we performed SR measurements on a powdered sample of BaIrO3, studying the ferromagnetic transition at and the additional transitions Cao et al. (2000) observed on cooling. The experiments were carried out using the GPS instrument at the Swiss Muon Source, Paul Scherrer Institute, Villigen, Switzerland. In these SR experiments, spin polarised positive muons (, mean lifetime , momentum 28 MeV) were implanted into a powder sample of BaIrO3 prepared as described in Ref. Powell and Battle, 1993. The muons stop quickly (in s), without significant loss of spin-polarisation. The time evolution of the muon spin polarisation can be detected by counting emitted decay positrons forward (f) and backward (b) of the initial muon spin direction, due to the asymmetric nature of the muon decay Blundell (1999). In our experiments we record the number of positrons detected by forward () and backward () scintillation counters as a function of time and calculate the asymmetry function, , using
| (1) |
where is an experimental calibration constant and differs from unity due to non-uniform detector efficiency. The quantity is then proportional to the average spin polarisation, , of muons stopping within the sample. The muon spin precesses around a local magnetic field, (with a frequency , where ).
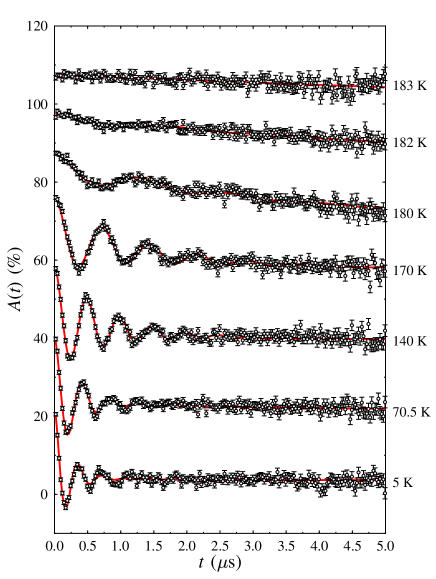
Typical muon asymmetry spectra for BaIrO3 are shown in Fig. 1. Clear oscillations are visible for , and it was possible to fit the data to the function
| (2) | |||||
over the entire temperature range studied, where represents a time-independent background due to muons stopping in the silver foil that surrounds the sample, and , are the exponential relaxation rate and amplitude of a relaxing fraction, and and are the damping rate and amplitude of an oscillating fraction. The parameters extracted from these fits are shown in Fig. 2.
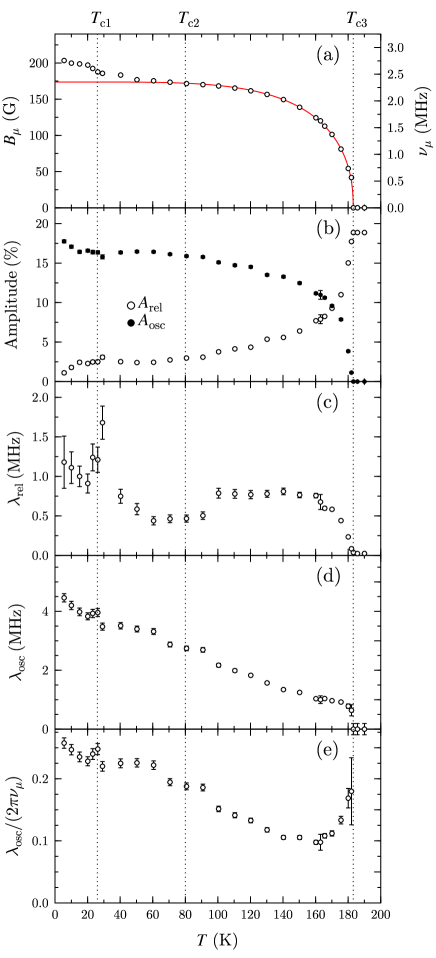
The magnitude of the magnetic field at the muon site is shown in Fig. 2(a). It begins to grow smoothly on cooling below , but undergoes an anomalous change near . The muon is able to detect changes to the local magnetisation that are not detectable by bulk probe measurements (such as magnetization). The data were fitted, for (in order to avoid the anomaly), to the phenomenological equation
| (3) |
and while the fit is good at high temperatures, there are clear departures at low temperature (Fig. 2(a)). The extracted parameters are shown in Table 1 and the fitted curve is shown in Fig. 2(a) as a solid line. Our sample shows (from both SR and magnetization, see below), which is a little higher than that reported previouslyCao et al. (2000), perhaps reflecting the high purity of our sample.
| Parameter | Value |
|---|---|
| 173.7(7) | |
| 183.12(4) | |
| 4.5(1) | |
| 0.435(8) |
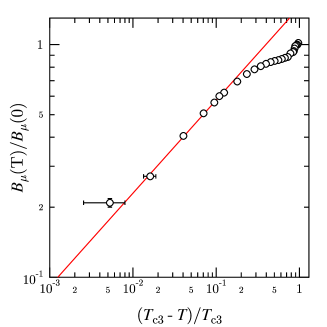
A better understanding of the critical behaviour near can be gained from the scaling analysis, shown in Fig. 3, which reveals that data for temperatures near to fit well to a power law, whose gradient on the log-log plot gives , close to 0.367 expected for three-dimensional Heisenberg behaviour. The point nearest to is poorly fitted; this is likely due to uncertainty in our value for .
The internal field at the muon site is very much smaller (by a factor of ) than that measured in other magnetic oxides (see e.g. Refs. Coldea et al., 2002; Heffner et al., 2001) in which the metal ion possesses its full moment. This is strong experimental evidence for a very small Ir magnetic moment in BaIrO3, and rules out the possibilityLindsay et al. (1993) that the weak ferromagnetism arises from canting of antiferromagnetically arranged spins. Below a temperature close to , departs sharply from the magnetization data, showing that the Fermi surface rearrangement that occurs at leads to a slight redistribution of the internal moment distribution inside the unit cell, possibly between different Ir ions.
The amplitude of the oscillating signal is expected to be proportional to the volume fraction of the magnetically ordered phase, and for a conventional magnetic transition would be zero above the transition and non-zero and constant below it (see e.g. Ref. Chow et al., 1996). In Fig. 2(b), it is seen to grow slowly as the temperature is reduced below . Thus it is not only the size of the Ir moment, proportional to , which grows as the sample is cooled, but also the fraction of the sample which is magnetically ordered.
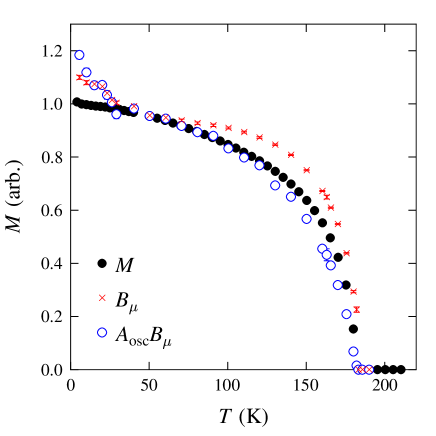
A comparison of the various measures of the magnetization is shown in Fig. 4. The bulk magnetization was measured after field cooling in in a Quantum Design MPMS SQUID magnetometer, and the resulting (normalized) curve is seen to be significantly below the corresponding curve over a large range of temperature. Also shown is the result of multiplying each value by its corresponding amplitude fraction which is expected to be proportional to the average magnetization; this curve is a better (though not perfect) match to the bulk measurement data. The bulk magnetization results from an ordered fraction whose order parameter increases at the same time as its volume grows. Since the bulk magnetization was measured in a field, it might be expected to lie slightly above the curve, which was measured in zero applied field. We note that because the ordered fraction grows as the sample is cooled below , extracting a critical exponent such as from either magnetization data or from the height of a neutron Bragg peak would not be a reliable procedure for determining intrinsic properties, whereas muons probe directly the properties of the ordered fraction. It may be possible that the increase of the magnetic fraction with decreasing temperature, as parameterized by , reflects the nucleation of weak ferromagnetically ordered regions between isolated non-magnetic Ir(III) centres, since the synthesis is believed to lead to BaIrO3-δ with .
The exponential relaxation rate reflects the dynamics of the field at the muon site(s) and is shown in Fig. 2(c). A large peak is expected near a magnetic phase transition due to the critical slowing down of spin dynamics, but is not visible near . It is strongly suppressed because only a tiny fractional volume of the sample is locally ordered at the transition temperature. A large peak is, however, seen at . Temperature is barely evident in the measured data: it seems to have no effect on , but possibly appears in as a small step near .
The oscillation damping rate (shown in Fig. 2(d)) is proportional to the width of the ordered field distribution that gives rise to the oscillating signal, and is seen to rise as the temperature is lowered below . It has an almost linear dependence on temperature, and seems insensitive to the transitions at and . In more conventional magnets this rate peaks near the transition and becomes smaller on cooling as the order becomes more uniform and static. The temperature dependence of the local magnetic inhomogeneity, quantified by the ratio is shown in Fig. 2(e) and shows that, at least in the environment of the muon site, the system becomes progressively more magnetically inhomogeneous on cooling, in direct contrast to the behaviour observed in most ferromagnetic systems.
In summary, we have used SR to follow the development of magnetic order in BaIrO3 from a local viewpoint. Our experiments show that the weakly ferromagnetic state, formed alongside the CDW state on cooling below , demonstrates unusual behaviour in the development of the magnetically ordered volume fraction and the longitudinal and transverse relaxation rates. This, together with the very low frequency of the muon oscillation, leads us to conclude that the weak magnetism arises because of small exchange splitting, and is primarily driven by the changes at the Fermi surface that lead to the formation of the CDW state. In addition, a small anomalous change is seen in the local magnetic field (but not the bulk magnetization) at the Mott-like transition at , and is likely due to a local rearrangement of the magnetic moments caused by further changes at the Fermi surface. Evidence for the metal-insulator transition at is missing from both specific heat dataCao et al. (2002) and our own SR data, supporting the suggestionCao et al. (2000) that is a crossover point between partial Fermi surface gapping at and full gapping at , rather than a true phase transition.
Parts of this work were performed at the Swiss Muon Source, Paul Scherrer Institute, Villigen, Switzerland. We are grateful to H. Luetkens and A. Amato (PSI) for experimental assistance, to M.-H. Whangbo (N. Carolina State Univ.) for useful discussions concerning his tight-binding calculations and to the EPSRC (UK) for financial support.
References
- Ohmichi et al. (2004) E. Ohmichi, Y. Yoshida, S. I. Ikeda, N. Shirakawa, and T. Osada, Phys. Rev. B 70, 104414 (2004).
- Nakamura et al. (2002) F. Nakamura, T. Goko, M. Ito, T. Fujita, S. Nakatsuji, H. Fukazawa, Y. Maeno, P. Alireza, D. Forsythe, and S. R. Julian, Phys. Rev. B 65, 220402(R) (2002).
- Cao et al. (2000) G. Cao, J. E. Crow, R. P. Guertin, P. F. Henning, C. C. Homes, M. Strongin, D. N. Basov, and E. Lochner, Solid State Commun. 113, 657 (2000).
- Powell and Battle (1993) A. V. Powell and P. D. Battle, J. Alloy Compounds 191, 313 (1993).
- Gulino et al. (1995) A. Gulino, R. G. Egdell, P. D. Battle, and S. H. Kim, Phys. Rev. B 51, 6827 (1995).
- Siegrist and Chamberland (1991) T. Siegrist and B. L. Chamberland, J. Less-Common Metals 170, 93 (1991).
- Cao et al. (2004) G. Cao, X. N. Lin, S. Chikara, V. Durairaj, and E. Elhami, Phys. Rev. B 69, 174418 (2004).
- Whangbo and Koo (2001) M.-H. Whangbo and H.-J. Koo, Solid State Commun. 118, 491 (2001).
- Blundell (1999) S. J. Blundell, Contemp. Phys. 40, 175 (1999).
- Coldea et al. (2002) A. I. Coldea, S. J. Blundell, C. A. Steer, J. F. Mitchell, and F. L. Pratt, Phys. Rev. Lett 89, 277601 (2002).
- Heffner et al. (2001) R. H. Heffner, J. E. Sonier, D. E. MacLaughlin, G. J. Nieuwenhuys, G. M. Luke, Y. J. Uemura, W. I. Ratcliff, S.-W. Cheong, and G. Balakrishnan, Phys. Rev. B 63, 94408 (2001).
- Lindsay et al. (1993) R. Lindsay, W. Strange, B. L. Chamberland, and R. O. Moyer, Solid State Commun. 86, 759 (1993).
- Chow et al. (1996) K. H. Chow, et al., Phys. Rev. B 53, 14725(R) (1996).
- Cao et al. (2002) G. Cao, G. Shaw, and J. W. Brill, J. Phys. IV 12, Pr9 (2002).