Theory of collective opinion shifts: from smooth trends to abrupt swings
Abstract
We unveil collective effects induced by imitation and social pressure by analyzing data from three different sources: birth rates, sales of cell phones and the drop of applause in concert halls. We interpret our results within the framework of the Random Field Ising Model, which is a threshold model for collective decisions accounting both for agent heterogeneity and social imitation. Changes of opinion can occur either abruptly or continuously, depending on the importance of herding effects. The main prediction of the model is a scaling relation between the height of the speed of variation peak and its width of the form , with for well connected populations. Our three sets of data are compatible with such a prediction, with for birth rates, for cell phones and for clapping. In this last case, we in fact observe that some clapping samples end discontinuously (), as predicted by the model for strong enough imitation.
pacs:
Valid PACS appear hereI Introduction
Traditional economics treat the aggregate behaviour of a whole population through a “representative agent” approach, where the heterogeneous preferences of individual agents are replaced by an average preference curve, which determines, for example, the dependence of the demand on the price of a certain product. This approach considers that agents determine their action in isolation, with no reference whatsoever to the decision of their fellow agents; interactions between agents are totally neglected. The representative agent idea has been fiercely criticized by some authors (see e.g. Kirman ). Models where the interaction between agents is explicitly taken into account, traditional in physics, only begin to be systematically explored in economics and sociology. The need to account for interactions stems from the fact that imitation and social pressure effects are obviously responsible for the appearance of trends, fashions and bubbles that would be difficult to understand if agents were really insensitive to the behaviour of others. From a theoretical point of view, as will be clear below, interactions lead to an aggregate behaviour that may be completely different from that implied by a representative agent approach. Catastrophic events (such as crashes, or sudden opinion shifts) can occur at the macro level, induced by imitation, whereas the behaviour of independent agents would be perfectly smooth Granovetter .
Imitation is deeply rooted in living species as a strategy for survival: young children learn (for example languages) by imitation. Herds and flocks flee away from danger or keep the correct destination direction by following the motion of their neighbours. Humans are influenced by their congeners both at a primitive level (fear of being excluded from the group) and at a rational level (others may possess some useful information, revealed by their very actions). Collective effects induced by imitation can be beneficial for a society as a whole, but can also be detrimental and lead to major catastrophes when imitation cascades are based on unreliable information or dangerous ideas, and when social pressure supersedes rational thinking. Understanding these collective effects is therefore of primary importance; they may undermine the stability of democracies (and have done so in the past), lead to crowd panic, financial crashes, economic crisis, etc. At a smaller scale, these effects determine how new products or new technologies penetrate a market; strong social imitation can be the key to the success of a brand, a book or a movie. In any case, social imitation often leads to distortion and exaggeration, i.e. a decoupling between the cause and the effect, which in turn generates inequalities and condensation phenomena.
Despite their importance, stressed long ago by Keynes, quantitative models of imitation effects have only been explored in a recent past. One branch of models, concerned with information cascades, was initiated by the paper of Bikhshandani, Hirshleifer and Welsh in 1993 BHW (see Chamley for a recent review and more elaborate developments). Another direction of research, where the interaction between agents is taken into account explicitly in binary choice situations, was pioneered by Föllmer in 1974 Follmer , followed by Orléan Orlean and others, and, in a sociological context, by Granovetter in 1978 Granovetter , and pursued further in Granovetter2 ; Granovetter3 . The idea, clearly expressed in Brock and Durlauf Brock , is that the utility or payoff an individual receives depends directly on the choices of others in that individual’s reference group, as opposed to the sort of dependence which occurs (only) through the intermediation of markets (see f1 ). This category of models have in fact a long history in physics, where interaction is at the root of spectacular collective effects in condensed matter, such as ferromagnetism, superconductivity, etc. It is therefore not surprising that the understanding of fashion, booms and crashes, opinion shifts and the behaviour of crowds or flocks, has attracted considerable interest in the physics community in the recent years (see Galam for early insights, and Vicsek ; Stauffer ; MG ; CB ; Donangelo ; Bettancourt ; Chate ; HH ; Weisbuch ; Sornette for a short selection). One particular model, that appears to be particularly interesting and generic, is the so-called ‘Random Field Ising Model’ (rfim), which has been successfully proposed to model hysteresis loops in random magnets Sethna and a variety of other physical situations. The hysteresis loop problem is an example of a collective dynamics of flips (the individual magnetic spins) under the influence of a slowly evolving external solicitation, but the model can easily be transposed to represent a binary decision situation under social pressure Galam , influenced by some global information (such as the price of a product) or by zeitgeist. This transposition was recently discussed in several socio-economics context in QF ; Book ; Nadal , see also Rava . The model has a rich phenomenology, which we will recall below; in particular, discontinuities appear in aggregate quantities when imitation effects exceed a certain threshold, even if the external solicitation varies smoothly with time. Below this threshold, the behaviour of “demand”, or of the average opinion, is smooth, but the natural trend can be substantially amplified and accelerated by peer pressure. The aim of this paper is to explore some situations where the model should apply, and test qualitative and quantitative predictions against empirical data. We have gathered data concerning (a) the drop of birth rates in European countries in the second half of the XXth century, (b) the increase of cell phones in Europe in the 90’s, (c) the way clapping dwindles out at the end of music concerts (see f2 ) and (d) crime statistics in different US states in the period 1960-2000, but this last data set did not show exploitable idiosyncratic variations. In the three first cases, we find that our data fits well the picture suggested by the model, and that noticeable collective effects can indeed be detected. By analyzing quantitatively the shape of the signals, we find that social pressure effects are distinctly stronger in some countries, or for some audiences, leading to more abrupt variations. We find a power-law relation between the maximum slope of the signal and the temporal window over which the evolution takes place, in surprisingly good agreement with the ‘mean-field’ version of the model. The case of applause is interesting because it is very close to being a controlled experiment. In that case, we observe both continuous and abrupt endings, as predicted by the model.
II A model for opinion shifts: the RFIM
We will assume that each agent is confronted to a binary choice, the outcome of which being noted . This binary choice can be to vote yes or no in a referendum, it can be to buy or not to buy a certain good, to have or not to have children, to clap or to stop clapping, etc. (the three last examples are indeed studied in the following sections). We assume that the decision of agent depends on three distinct factors QF ; Book ; Nadal :
-
•
(i) his personal opinion, propensity or utility, measured by a real variable which we take to be time independent. Large positive ’s means a strong a priori tendency to decide , and large negative ’s a strong bias towards .
-
•
(ii) public information, affecting all agents equally, such as objective informations on the scope of the vote, the price of the product agents want to buy, the possibility of birth control, the advance of technology, etc. The influence of this time dependent common factor, or polarization field, will be called , again a real variable in .
-
•
(iii) social pressure or imitation effects; each agent is influenced by the decision made by a certain number of other agents in his “neighbourhood”, . The influence of on is taken to be , that adds to and . If , the decision of agent to buy (say) reinforces the attractiveness of the product for agent , who is now more likely to buy. This reinforcing effect can obviously lead to an unstable feedback loop, as discussed below. If on the contrary , the action of agent deters agent from making the same choice. This “anti-conformist” tendency, although rarer in human nature, can sometimes exist and be relevant, but this will not be pursued further here (but see Granovetter2 for a discussion of this point).
In summary, the overall incentive of agent is , and the rule we choose for the decision of agent at time is simply:
| (1) |
meaning that the decision to “buy” is reached when the incentive reaches a certain threshold value Granovetter ; Granovetter2 , chosen here to be zero (any other dependent value could have been chosen, since this simply amounts to shifting the idiosyncratic field ). If all , the above model is known in physics as the Random Field Ising model at zero temperature, and has been intensely studied in the last decades (see Sethna for a review). In physics, natural networks of connections are -dimensional regular lattices, but other topologies, such as the fully connected case or random (Erdos-Renyi) graphs have been studied as well. The qualitative phenomenology does not depend much on the chosen topology, nor on the distribution of idiosyncratic fields, although quantitative details might be sensitive to these.
Let us study first the case where social pressure is absent, i.e. . Call the cumulative distribution of , i.e. the probability that . The aggregate demand, or average opinion , is defined as: , where is the total number of agents that we will assume to be very large. For a given polarization field , one easily finds:
| (2) |
(The subscript means that here). As increases slowly from to , the average opinion evolves from to in a way that mirrors exactly the distribution of a priori opinions in the population. For a generic distribution of ’s (for example, Gaussian), the opinion evolves smoothly as the polarization field is increased, as shown in Fig. 1. If one interprets as (minus) the price of a product, the total demand curve as a function of the price is:
| (3) |
that only reflects individual preferences.
The situation can change drastically when imitation is introduced. The simplest case is when the coupling between agents is “mean-field”, i.e. (see Sethna ; Nadal and, in a slightly different setting, Granovetter ; Granovetter2 ). This does not mean that each agent consults all the other ones before making his mind, but rather than the average opinion, or total demand, becomes public information, and influences the behaviour of each individual agent. This is in fact a very realistic assumption: for example, the total sales of a book, or number of viewers of a movie, is certainly an important piece of information for consumers. It is also known that the evolution of the public opinion on a certain topic is affected by polls, i.e. by a proxy of the average opinion. Finally, in the case of financial markets, the price change itself can be seen, on a coarse-grained time scale, as an indicator of the aggregate demand (although the detailed relationship between the two might be quite subtle, see marketimpact ). This global feedback effect simply shifts to , leading to a self-consistent equation:
| (4) |
If imitation is weak enough, one can expand the right hand side in powers of , leading to first order to:
| (5) |
where is the probability density of idiosyncratic fields. This equation shows that around the point where the slope of vs. is maximum, i.e. around the maximum of , the speed of variation of opinion changes is also maximally amplified – imitation leads to exaggeration. As imitation becomes stronger, the maximum slope of vs. increases and finally diverges for a critical value given by , where is the width of the distribution , and a numerical constant that depends on the topology of the graph and on the detailed shape of . This result shows, as expected, a diverse population (large ) is less prone to collective frenzy than a more homogeneous one. Above , the self-consistent equation has, for a range of , three solutions for , one of which being unstable (see Fig. 1). This means that as is increased from , the average opinion will first follow the lower branch until it jumps discontinuously to the upper branch, for a certain threshold field (and symmetrically on the way back, at , as the field is decreased). This discontinuity is very interesting from a general point of view: it means that even when the external solicitation is slowly and smoothly varied (i.e. without any information shocks), populations as a whole can exhibit sudden, apparently irrational, opinion swings (on this point, see Granovetter for an early discussion – in particular his Fig. 2). In an economic context, it means that the demand for a product can vary discontinuously from low to high as the price is decreased Granovetter2 ; Nadal .
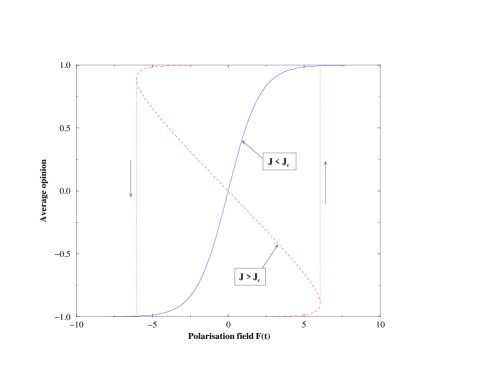
The vicinity of the critical point reveals interesting critical properties, to a large extent independent of the detailed form of or . Noting the distance from criticality, one finds that the opinion slope takes a scaling form:
| (6) |
where the function can be computed explicitly Sethna , and is universal. Its shape is plotted in Fig. 2; one finds that is a finite constant and . Eq. (6) means that the slope, as a function of , peaks at a maximum of order and remains large on a small window of field of order . In other words, the height of the peak behaves as with , instead of for a regular evolution, without any collective effects (). These results are expected to be rather robust: not only the distribution of idiosyncratic fields is (within a broad class) irrelevant, but also the detailed topology of the graph. Only if the graph is a regular lattice of dimensions less than will the shape of the scaling function and the value of the exponent be affected Sethna . Beyond , the curve becomes discontinuous; the amplitude of the jump is found to increase as for small, with in mean-field situations such as the one described above Sethna .
If now one ‘zooms’ on fine details (on scale ) of the curve in the vicinity of , one finds that the evolution of is actually resolved in a succession of ‘avalanches’ of different sizes , where agents simultaneously change their opinion. Interestingly, the distribution of avalanche sizes also takes a scaling form which has attracted enormous interest in the context of random magnets Sethna , and offers an enticing microscopic picture of how large opinion swings actually develop in a population: as a succession of events, most of which small, but some involving an extremely large number of individuals. More precisely, at the critical point , the distribution of avalanche sizes as is swept through decays for large as with Sethna .
In summary, the transposition of the rfim to opinion shifts predicts that the average opinion evolves, as a function of the global solicitation, very differently if imitation effects are weak (in which case the evolution is smooth) or if imitation exceeds a certain threshold, in which case aggregate quantities are discontinuous and catastrophic avalanches may be triggered. More quantitatively, the model predicts that in generic situations, the evolution slope should peak more and more as the critical point is approached: its height increases while its width decreases, the two being related by . We will now show that these predictions seem indeed to be relevant in the three situations that we have investigated: evolution of birth rate, of cell (mobile) phones and of clapping activity. The idea is that different countries, or different crowds, are characterized by different values of the heterogeneity parameter and/or of the imitation parameter . Therefore, the distance from the critical point will vary across the set of available countries or audiences, leading to peaks of different height and width. [A fourth set of data, concerning crime statistics in the US, was inconclusive, since the height and width were not found to vary significantly from state to state.]

III Birth rate in Europe 1950-2000
The decision to have children has been profoundly affected by an easier access to birth control, higher education, the loss of influence of religions, etc, which play the role of a slowly evolving global solicitation field . There might also be a significant social pressure effect: the image of women in society, the social prestige of having a career rather than a family life, may have a strong deterring influence of the choice of having, or not having children. Therefore, we believe that the three sources of influence appearing in Eq. (1) above should be important to understand the detailed evolution of birth rate in the second half of last century.
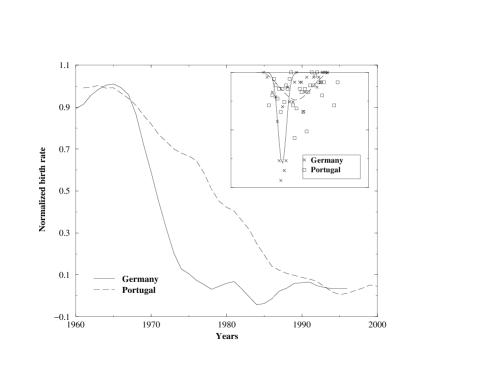
We have downloaded from Eurostat (europa.eu.int/comm/eurostat/) the birth rate in several representative European countries (Belgium, France, Germany, Grece, Italy, Netherlands, Poland, Portugal, Spain, Sweden, Switzerland, UK). The reported birth rate is the average fecundity index in a given year, from 1950 to 2000, except for Germany where we only keep data before re-unification. In all countries, except Sweden, this index has steadily decreased over the years. In Sweden, the birth rate has, after having decayed like in other countries, increased back in the late eighties, probably due to governmental incentives. In most countries except Grece and Portugal, the slope of the decay reached a maximum around 1970. We have treated the data as follows (an identical treatment will also be applied in the following sections). We first re-scale the data such that the total range of variation is constant, independent of the country, such as to remove any idiosyncratic, cultural effects on the average number of children per family. We then define the slope by taking the discrete derivative of the curve, defining the yearly change of (rescaled) birth rate. This leads to a rather noisy curve, but that has a distinctive peak as a function of time, see Fig. 3. We then fit using a Gaussian shape for the peak, plus a constant background (found to be small compared to the maximum height of the peak). Since the data is noisy, the Gaussian shape is only a convenient way to extract the height of the peak , its width and the location of the peak . Interestingly, we find a rather large variability of and across countries, much beyond the uncertainty of the fitting parameters and . Some countries, like West Germany, display a high and narrow peak while others, like Portugal, have a much broader peak, with a more modest height (see Fig. 3). Now, plotting vs. across different countries, we find (see Fig. 4) that the data clusters reasonably well around a straight line of slope , as predicted by the fully connected rfim detailed in the previous paragraph, and in any case significantly smaller than the trivial value . Remember that the usefulness of that prediction is that it does not require to specify the distribution of idiosyncratic fields . The best regression through the data in fact gives a slope of . This suggests that the accelerated birth drop in some countries is indeed induced by a social pressure effect, rather than being a mere dependence of diversity (measured by variance of ) on the country, since in that case one would trivially observe . Note also that the significant change of height and width across different countries makes rather unplausible that the drop in the birth rate is solely due to a sudden external cause, like the availability of birth control pills. Although this availability certainly triggered the phenomenon, its amplification, according to our analysis, appears to be compatible with imitation effects, exactly as described by the rfim with a slowly evolving external drive .

IV Number of cell phones in Europe, 1994-2003
The evolution of the number of cell phones in the last decade is an interesting case study. The soaring number of cell phones obviously followed better technology, lower prices, etc., encapsulated in our global solicitation field , which we again assume to be smoothly evolving with time (no technology shocks). But it is also clear that social effects must have been important, not only as in usual fashion phenomena where not possessing the trendy object gives rise to a feeling of inferiority, but also because the usefulness of cell phones is objectively increased if more people can use one.
We have studied the monthly evolution of the total number of cell phones in use (all providers included) in five different European countries (Germany, UK, France, Italy, Spain) in the period 1994-2003. We obtained the data from the art (“Autorité de Régulation des Télécommunications” in Paris). During that period, the number of cell phones increased by a factor or more. We apply to the data the same treatment as in the previous section: normalization, discrete difference and a Gaussian fit. The normalized data is plotted in Fig. 5. From the Gaussian fit of the peak, we again extract a height , width and location . In this case, we find that all curves peak at . As for birth rates, we find a rather large spread in the values of and , with again Germany standing out as the most “collective” country. What we find quite remarkable is that the five points fall quite nicely on the same curve as for birth rates, although the time scale is obviously shorter for the spreading of cell phones than for the decay of birth rates (see Fig. 4). Notice however that the birth rate collapse in Germany is almost as fast as the rise of cell phones in Italy! The slope of the best regression over the five points is , clearly compatible with a slope (see Fig. 4). This result rather strongly suggests some social amplification of the trend, compatible with the self-referential mechanism proposed here.
Note that although quite sharp, the above curves all seem to lie in the smooth regime of the rfim. On the other hand, a true runaway behaviour, predicted for , cannot occur in the case of cell phones because the rate at which these can be commercialized is finite; this effect would regularize the discontinuity and give it a finite width related to the maximum sale capacity of phone providers. This regularisation effect will indeed be observed in our last example, to which we now turn.

V Persistent and interrupted clapping
After a concert, or a theater performance, the public usually claps for a period of time that reflects its satisfaction or enthusiasm. A collective effect which is well documented but that we will not be concerned with here is the possible synchronization of claps Clapping (except insofar as these synchronization effects already suggest the importance of interactions between individuals). We rather want to focus on the way the clapping dies out. The point here is that if people have a different degree of enthusiasm for the performance, the time after which they will stop clapping varies from one person to the next. More precisely, the idiosyncratic field defined above is, in the present case, the a priori amount of time a given individual would carry on clapping if isolated from others. But of course, we all hear what others are doing, and are clearly influenced by the level of clapping of the public as a whole. Many people would hate being the last individual to clap in a large concert hall. Therefore, the propensity to clap adapts to the overall clapping intensity, exactly as in the rfim. In the present case, the external field is simply (minus) the time elapsed since the start of applause: as time passes, the necessity to clap declines. Therefore, in the absence of interaction between individuals, the state of agent is given by:
| (7) |
where is the Heaviside function, , . The overall sound level is proportional to the number of clapping people (we neglect here the individual fluctuations in clapping intensity); the model we propose is simply that the a priori clapping time is shifted by a quantity proportional to : ; therefore the total clapping intensity at time is given by:
| (8) |
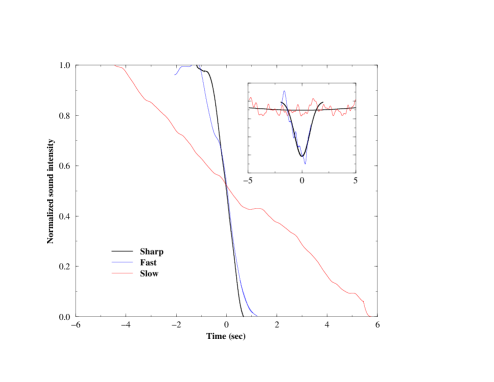
where we have just repeated, for the sake of clarity, the general argument given in section 2, adapted to the present case. Therefore, we expect two distinct types of applause: “persistent” clapping that slowly die out with time, as more and more people progressively decide to stop clapping (), and “interrupted” clapping, which end abruptly, because people pay acute attention to the global clapping level and stop clapping as soon as they hear that the noise level starts decreasing ().

We have analyzed data coming from music concerts recorded in the very same concert studio, “Studio 104” of Maison de la Radio (Paris, France). The concerts took place during two special events called “Couleurs Francophones”, that featured a total of 11 performances of french speaking artists both in March 2003 and March 2004. The data therefore concerns two audiences of ca. 1000 people, each reacting to 11 different performances of various quality, leading to different degree and variability of enthusiasm of the crowd. Each recording is stereo with two channels; we were able to obtain the raw data, not post-processed by sound engineering. Most of the available data is actually post-processed, for example, the clapping phase is artificially cut-off.
A typical recording of the clapping is shown in Fig. 6. After an initial fast rise, one sees a relatively constant level of clapping, followed in this case by a rather smooth decay of the sound intensity. Note however the presence of a few peaks, corresponding to occasional shouts or other perturbations. At the qualitative level, we indeed find two different categories of clappings, as illustrated in Fig. 7, where we show a slow persistent clapping, that takes over 10 seconds to smoothly die out, and a two fast ones. For the fastest case, the width of the stopping period is in fact given by the width of the filter that we used, which is comparable to the acoustic decay time of the room ( sec). This shows that within the measurement accuracy, the stopping period was instantaneous, corresponding in our model to strong imitation effects, . The possibility of observing such discontinuous events makes the clapping data extremely interesting: as mentioned above, both birth rate data or cell phone data seem to be in the continuous regime ().
More quantitatively, we have again extracted from this data set heights and widths of the peaks in the sound intensity change, following exactly the same procedure as above. In this case, we have removed a few recordings that are extremely noisy (many spurious peaks, very different left and right channels) or atypical (one recording shows a two stage decay, which can happen in the case of a very strongly heterogeneous audience: half of the audience may have stopped clapping, while the other half carries on). This leaves us with 17 different samples out of the 22 at our disposal. The result is plotted in Fig. 8, in a log-log scale, where we do not report the 2 points corresponding to ‘abrupt’ endings ( sec). Rather remarkably, we find the very same quantitative pattern as in Fig. 4: the heights of the peaks are related to their width as , again very close to the mean-field prediction of the rfim. We find this result quite striking, since this example is very close to being a controlled experiment, that clearly gives some credibility to the idea of social amplification trends, in a way fully compatible with the rfim framework. We regard the existence of abrupt endings in a crowd of 1000 people, predicted by the model but unobserved in the previous two examples, as a strong support of our contention. However, our analysis should be redone on a different, larger set of applause endings in well controlled situations, to consolidate our findings.

VI Conclusion
In this work, we have tried to document quantitatively collective effects induced by imitation and social pressure. We have analyzed data from three different sources (birth rates, sales of cell phones, decay of applause) within the framework of the Random Field Ising Model, which is a threshold model for collective decisions accounting both for agent heterogeneity and social imitation. Changes of opinion, demand or behaviour in this model can occur either abruptly or continuously, depending on the importance of herding effects. The speed of change generically peaks at a certain time; the main prediction of the model is a scaling relation between the height of the peak and its width of the form , with for densely connected populations (mean-field situation). Our three sets of data are compatible with such a prediction, with for birth rates, for cell phones and for clapping. In the last case, we in fact observe that some clapping samples end discontinuously (), as predicted by the model for strong enough imitation. Since the data is rather noisy, the agreement of each individual example with the model is perhaps not particularly impressive. However, we believe that the convergence of these three rather different situations and the robustness of the theoretical picture gives some credit to our conclusions.
Many other situations could be analyzed according to similar lines: the invasion of other products and technologies (cars, television, Internet access, etc.), or other social phenomena such as divorces, car accidents (for example, the death toll on the French roads has sharply decreased in the past few years after staying among Europe’s highest for decades), the evolution of opinion polls, social riots, strikes or upheavals Granovetter , residential segregation Granovetter3 , discontinuities in History, etc., provided of course reliable data is available. The case of crime statistics is interesting and has been the subject of some studies (see JS ). We have actually downloaded the statistics of crime in different US states in the period 1960-2000. These show a rather sharp rise during the sixties; unfortunately, all states behave more or less identically, and the study performed above could not be carried through. The conclusion is, perhaps not unexpectedly, that the US population tends to behave much more uniformly than in Europe, where cultural differences are very perceptible (as our results on birth rates and cell phones confirm).
The present work could be extended in various directions: getting better data, on a wider set of examples and samples, would confirm or disprove the validity of our analysis. For example, the direct observation of avalanches of opinion changes, and the distribution of their size, would be highly interesting. Also, situations where the coupling is not global but more local, such as, e.g. large open air concerts, would be worth investigating since the value of is expected to change, and gets closer to for two-dimensional geometries Sethna . From a theoretical point of view, one could include in the rfim truly dynamical effects, in the sense that crowds are not only sensitive to the aggregate opinion, but also to the speed of change of this opinion Bettancourt , which might lead to even stronger instabilities. A way to include these in the rfim framework is to rewrite Eq. (4) in a differential form, and to add an extra ‘speed of change’ feedback, in the spirit of BC :
| (9) |
where is the rate of change of and is a certain memory kernel.
An interesting outcome of a deeper understanding of collective effects would be to be able to disentangle, in the evolution of public opinion, a genuine opinion shift from self-referential effects. If this separation could itself become public information, the resulting ‘holoptical’ feedback loop (following the term proposed by Noubel Noubel ) could be stabilizing and prevent, or at least temper, opinion swings, financial crashes or economic crises.
Acknowledgements.
J.P. B thanks A. Kirman, M. Marsili, M. A. Miceli, J.P. Nadal, J.F. Noubel, A. Orléan, J. Sethna and R. da Silveira for very useful conversations on these subjects over the years. We also thank Edwige Roncière and Laurent Givernaud, from Radio France, for providing the clapping recordings, and M. Granovetter for pointing us to refs. Granovetter2 ; Granovetter3 .References
- (1) A. Kirman, What or whom does the representative individual represent?, Journal of Economic Perspectives, 6, 117 (1992); A. Kirman, Ants, rationality and recruitment, Quarterly Journal of Economics, 108 137 (1993)
- (2) M. Granovetter, Threshold models of collective behaviour, Am. J. Sociol. 83, 1420 (1978); M. Granovetter, R. Soong, Threshold models of diffusion and collective behaviour, J. Math. Socio. 9, 165 (1983).
- (3) S. Bikhchandani, D. Hirshleifer, I. Welch, A theory of fads, fashions, custom and cultural changes as informational cascades, Journal of Political Economy, 100 992 (1992).
- (4) Ch. Chamley, Rational Herds, Cambridge University Press, 2004.
- (5) H. Föllmer, Random Economies with many interacting agents, J. Math. Econ. 1, 51 (1974).
- (6) A. Orléan, Bayesian interactions and collective dynamics of opinions, J. Econ. Behav. Organ. 28, 257 (1995)
- (7) M. Granovetter, R. Soong, Threshold models of interpersonal effects in consumer demand, J. Econ. Behavior & Organization,7 83 (1986).
- (8) M. Granovetter, R. Soong, Threshold models of diversity: Chinese Restaurants, Residential Segregation and the spiral of silence, in Sociological Methodology, C. Clogg Edt. (1988), p. 69-104.
- (9) W. Brock, S. Durlauf, Discrete Choice with social interactions, Review of Economic Studies, 68, 235 (2001).
- (10) The word “only” was added by us. The fully connected limit of the rfim analyzed below however corresponds to the case where the interaction is in fact mediated by global information, such as the price.
- (11) S. Galam, Majority rule, hierarchical structure and democratic totalitarism, J. Math. Psychol. 30, 426 (1986); S. Galam, S. Moscovici, Towards a theory of collective phenomena: Consensus and attitude changes in groups, Euro. J. Social Psy. 21, 49 (1991).
- (12) T. Vicsek, A. Czirok, I. J. Farkas and D. Helbing, Application of Statistical Mechanics to Collective Motion in Biology, Physica A274, 182 (1999); D. Helbing, I. Farkas, and T. Vicsek, Simulating dynamical features of escape panic, Nature, 407, 487 (2000); I. Farkas, D. Helbing and T. Vicsek, Human waves in stadiums, Physica A330 18 (2003).
- (13) see e.g. M. Hohnisch, S. Pittnauer, S. Solomon, D. Stauffer, Socioeconomic Interaction and Swings in Business Confidence Indicators, e-print cond-mat/0312511.
- (14) D. Challet, M. Marsili, Y.C. Zhang, Minority Games, Oxford University Press, 2005.
- (15) R. Cont, J.P. Bouchaud, Herd behaviour and aggregate fluctuations in financial markets, Macroeconomic Dynamics 4, 139 (2000).
- (16) R. Donangelo, A. Hansen, K. Sneppen, S. R. Souza, Physics of Fashion fluctuations, Physica A 287, 539 (2000).
- (17) L. Bettancourt, The complex dynamics of trends and fashion, e-print cond-mat/0212267.
- (18) G. Grégoire, H. Chaté, Y. Tu, Moving and staying together without a leader, Physica D181, 157 (2003).
- (19) A. Soulier, T. Halpin-Healey, The Dynamics of Multidimensional Secession: Fixed Points & Ideological Condensation, Phys. Rev. Lett. 90, 258103 (2003).
- (20) G. Deffuant, F. Amblard, G. Weisbuch, Mixing beliefs among interacting agents, Advances in Complex Systems, 3, 87 (2001); G. Deffuant, F. Amblard, G. Weisbuch, Modelling group opinion shift to extreme: the smooth bounded confidence model, working paper.
- (21) D. Sornette, F. Deschâtres, T. Gilbert, Y. Ageon, Endogeneous vs exogeneous shocks in complex systems: an empirical test using book sales ranking, Phys. Rev. Lett. 93, 228701 (2004).
- (22) J. Sethna, K. Dahmen, C. Myers, Crackling Noise, Nature, 410, 242 (2001); J. Sethna, K. Dahmen, O. Perkovic, Random Field Ising Models of Hysteresis, cond-mat/0406320
- (23) J.P. Bouchaud, Power-laws in economics and finance: some ideas from physics, Quantitative Finance, 1, 105 (2001).
- (24) J.-P. Bouchaud and M. Potters, Theory of Financial Risks and Derivative Pricing, Cambridge University Press, 2003.
- (25) J.-P. Nadal, D. Phan, M. B. Gordon and J. Vannimenus, Multiple equilibria in a monopoly market with heterogeneous agents and externalities, e-print cond-mat/0311096, submitted to Quantitative Finance; M. B. Gordon, J.-P. Nadal, D. Phan and J. Vannimenus, Seller’s dilemma due to social interactions between customers, to appear in Physica A.
- (26) R. da Silveira, An introduction to breakdown phenomena in disordered systems, American Journal of Physics, 67 1177 (1999).
- (27) These examples were actually proposed in QF ; Book .
- (28) on this point, see e.g. V. Plerou, P. Gopikrishnan, X. Gabaix, H. E. Stanley, Quantifying Stock Price Response to Demand Fluctuations, Phys. Rev. E 66, 027104 (2002); F. Lillo, J. D. Farmer, R. Mantegna, Master curve for price-impact function, Nature, 421, 129 (2003).
- (29) Z. Neda, E. Ravasz, Y. Brechet, T. Vicsek and A. Barabasi, The sound of many hands clapping, Nature, 403, 849 (2000); Z. Neda, E. Ravasz, Y. Brechet, T. Vicsek and A. Barabasi, Physics of the rhythmic applause, Phys. Rev, E 61, 6987 (2000).
- (30) E. L. Glaeser, B. Sacerdote, J. A. Scheinkman, Crime and Social Interactions, Quarterly Journal of Economics, 111, 507 (1996).
- (31) J.-P. Bouchaud, R. Cont, A Langevin approach to stock market fluctuations and crashes, European Journal of Physics B 6, 543 (1998).
- (32) J.F. Noubel, Collective Intelligence, The invisible revolution, available at http://www.TheTransitioner.org/ci