Avalanches in complex spin networks
Abstract
We investigate the magnetization reversal processes on classes of complex spin networks with antiferromagnetic interaction along the network links. With slow field ramping the hysteresis loop and avalanches of spin flips occur due to topological inhomogeneity of the network, even without any disorder of the magnetic interaction [B. Tadić et al., Phys. Rev. Lett. 94 (2005) 137204]. Here we study in detail properties of the magnetization avalanches, hysteresis curves and density of domain walls and show how they can be related to the structural inhomogeneity of the network. The probability distribution of the avalanche size, , displays the power-law behavior for small , i.e. . For the scale-free networks, grown with preferential attachment, increases with the connectivity parameter from for (trees) to 1.52 for . For the exponential networks, is close to 1.0 in the whole range of .
keywords:
antiferromagnets , Barkhausen noise , evolving networks , Ising model , Monte Carlo simulations , simple graphs and trees , spin dynamicsPACS:
75.60.Ej , 02.10.Ox, , , and
1 Introduction
Growing networks is a vivid area of interdisciplinary sciences, with long list of applications [1, 2, 3, 4, 5, 6]. The mainstream of literature is concentrated on the structure of the networks. However, from the point of view of some applications it is of interest to decorate nodes with additional degrees of freedom. In the simplest case, these variables are discrete, with two possible values: . Such an extension can be useful when discussing numerous examples, from neural and logical networks through sexual networks to quantum gravitation [7]. Our topic here is a network of interacting magnetic moments (spins), with two possible magnetic orientations, up or down. The models of spin networks with ferromagnetic interaction have been considered in several recent studies [8, 9]. The case of spin networks with antiferromagnetic interactions is essentially different because of the frustration effect along closed cycles on the graph [10, 11]. This difference is well known also for regular lattices [12].
Recently we introduced and investigated field-driven dynamics of spins on complex networks with the antiferromagnetic interaction [11]. We found that the structural complexity of the networks leads to avalanches of spin flips and a criticality of the hysteresis loop. The desired shape of hysteresis curves can be obtained by tuning the clustering parameter . This parameter counts the number of links, which attach each new node to the growing network.
In this work we expand the study of the reversal processes in the antiferromagnetic spin networks. We demonstrate the genesis of avalanches due to inhomogeneity in network’s connectivity when the clustering is low. In this limit the avalanche structure and duration can be clearly interpreted in terms of the theoretical distribution of connectivity and depth of the network. For large clustering, the character of the avalanche spectra for large change from mulitipeaky to a soft decreasing. For small avalanches, the avalanche spectra display the power-law character in the whole range of the clustering parameter . We define the size of avalanche as a number of spins which were flipped at a given value of external field .
In Section 2 we introduce details of the model and discuss spin reversal on small graphs. Section 3 contains details of the emergent structures for two classes of growing networks exponential and scale-free. Our results on the magnetization reversal in these networks are given in Section 4 and discussed in Section 5.
2 Spin reversal on small graphs
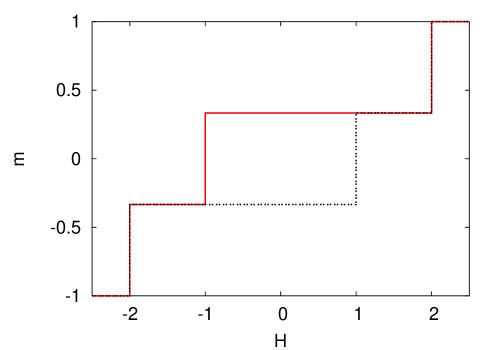
To describe our procedure in details, we begin with small simple graphs (Fig. 1). A spin is placed at each node. If two nodes are linked together, antiferromagnetic interaction tends to keep them in one of two antiparallel configurations. Energy of the whole system is written as
| (1) |
where coupling constant for the antiferromagnetic interaction and the first summation goes over all nearest neighbor pairs . We assume symmetric neighbors, i.e. if spin is neighbor to spin then also is neighbor to . (We note, that results may be drastically different when the neighbor relations are directed [9, 13].) To draw the hysteresis loops, graphs are placed in saturating magnetic field , which forces all spins to be positive, i.e. to point upwards. We ramp the field by integer steps [14] from to in order to avoid ambiguous spin orientation at integer field values (). As the field decreases gradually at zero temperature some spins are flipped () because of the antiferromagnetic interaction with their neighbors.
a)
|
|
b)
|

|
c)
|

|
d)
|

|
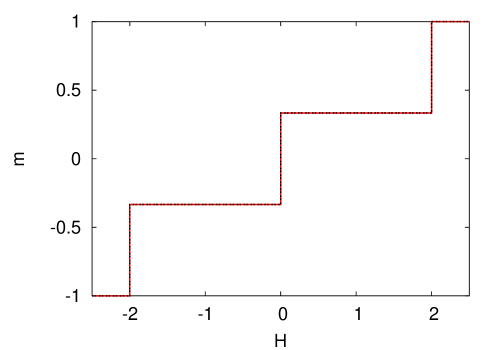
In Fig. 1 we present some graphs and their hysteresis loops. We note that for some of them, the obtained hysteresis loop depends on the order of updating. As an example, consider a chain of five spins presented in Fig. 1(c). In saturation, effective fields at node 2, 3 and 4 are the same. If the central spin 3 is updated at first, only this spin flips at field . If we update spins starting from the end of chain (as it is done here), the flipped ones are 2 and 4. Then, not only the flipped spin labels but also the number of flipped spins is influenced by the order of updating. However, any procedure suffers this ambiguity until we do not add a small variation of the magnetic moments or the interactions; in this case, the Pardavi-Horvath algorithm [15] is appropriate, where the field is changed continuously and a spin where the effective field is zero is flipped as first. On the other hand, the synchronous scheme of spin updates may lead to persistent oscillations as when , and the avalanche will never stop. Here we apply causal way of spin updating, i.e. from the spin decorating “the oldest” node of the graph towards the one assigned to the node added at very end. Below we present results averaged over a large number of graphs with different shapes, and the influence of the order of updating is expected to be averaged out.
3 Structure of networks
It is well known that the structure of the growing network emerges in the process of node adding and linking. Here we are interested in the growing exponential (EXN) and the scale-free (SFN) graphs [4]. In both cases, a network grows by successive adding of new nodes. Each new node is linked to different pre-existing nodes, which are selected randomly (EXN) or with preference (SFN). Here we limit our interest to the case when the preferential probability of selecting a given node is proportional to the degree of this node, i.e. to the number of currently present bonds at that node. This procedure leads to the scale-free character of the degree distribution for SFN, i.e. , where theoretically for large network size independently on the parameter [3, 4, 5, 16]. For EXN trees (), [4], and for EXN with we get [17]. The parameter can be tuned to modify the sparseness of the networks, from (trees) to higher values, where cyclic paths appear. If the number of nodes in such a cycle is odd, as in a triangle, a frustration of spins occurs: some antiferromagnetic bonds join spins of the same orientation, and the minima of energy become shallow. The clustering coefficient [3] depends on the node age. The clustering profiles, as shown in [11] for the case , exhibits a power-law tail both for EXN and SFN. The networks with low clustering () reveal effects of linking inhomogeneity.
We stress that all bonds are antiferromagnetic and there is no bond disorder in the traditional sense. However, the structure of the network cannot be treated as ordered in the sense of periodic lattices. In most of graphs each node has its unique position in the network [18]. Therefore, a question arises, if the spin glass phase is possible in the antiferromagnetic spin-networks with clustering at least at . In terms of the accepted spin-glass terminology, the presence of nodes with large connectivity may be regarded either as a long-range interaction effect, or as an equivalence of a large system dimensionality. However, such structure is not translationally invariant [19]. The network shows a nontrivial connectivity profile, which implies new features of the spin-glass order and requires refined theoretical approaches [20].
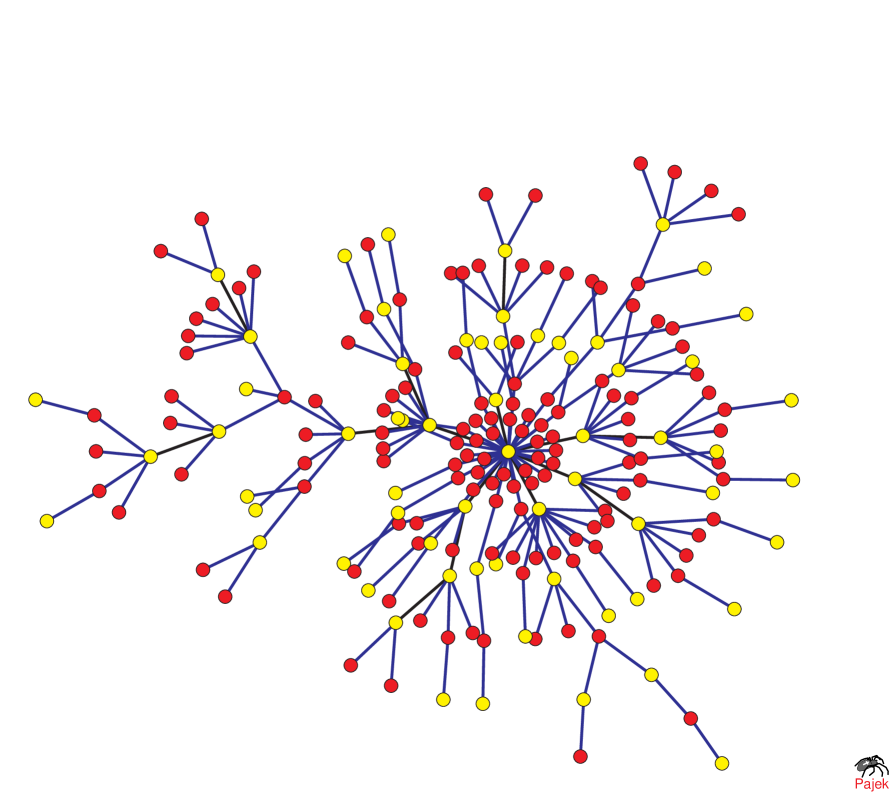
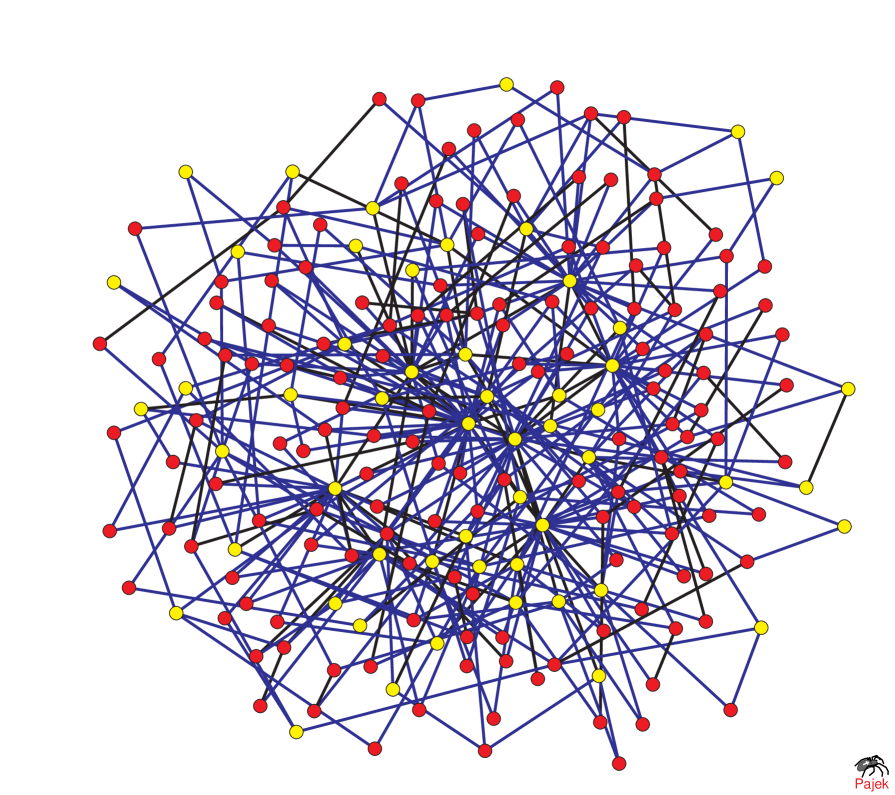
In Fig. 2 examples of the networks considered in this work are presented. For clarity of the plots the network size is kept moderate. In the simulations we use networks with nodes.
4 Hysteresis loops and avalanche distributions
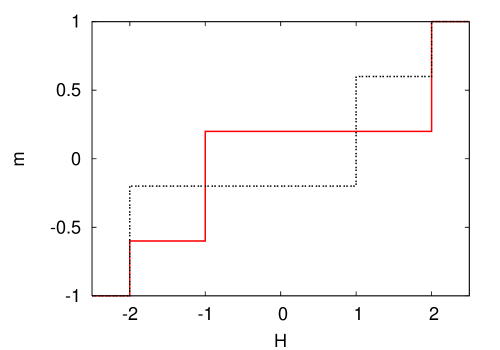
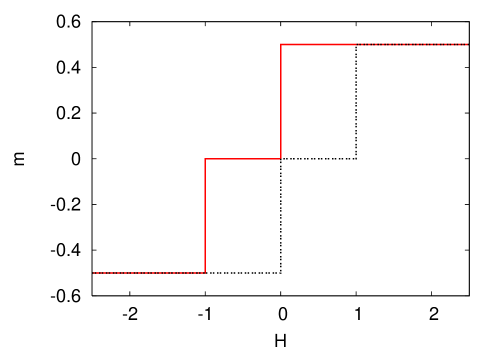
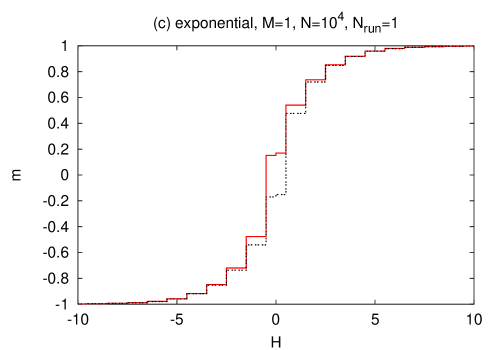
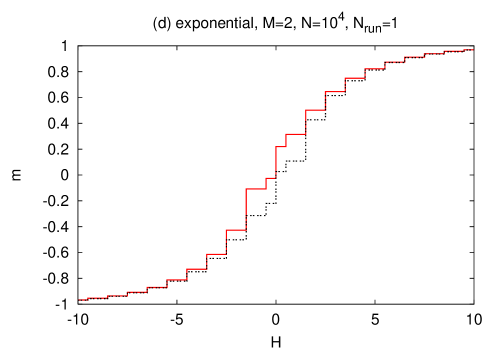
Results of the dynamics of the remagnetization process are shown in Figs. 3 and 4 for EXN and SFN, . In Fig. 3, examples of the hysteresis loop are presented for EXN and SFN, . The loops are driven in the applied field range from to , where is the saturation field equal to the maximal connectivity of the lattice. All loops show jumps of magnetization at integer field values, as those in Fig. 1.
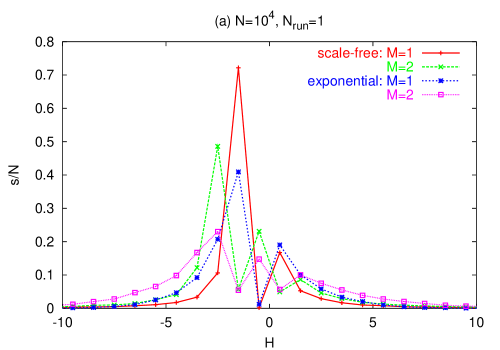
In Fig. 4(a) we show the data on the number of flipping spins against the magnetic field, calculated within the same numerical experiment, as in Fig. 3. In descending field, all the plots in this figure show an asymmetry with respect to the zero field. Most of spins flip at for trees, for the case . This is a consequence of the connectivity, which is two times smaller for trees in the average.
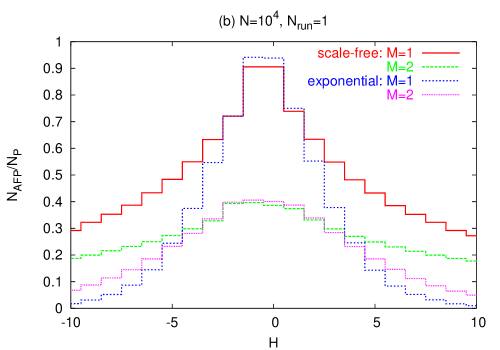
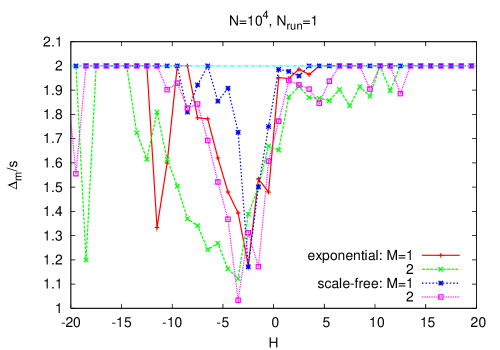
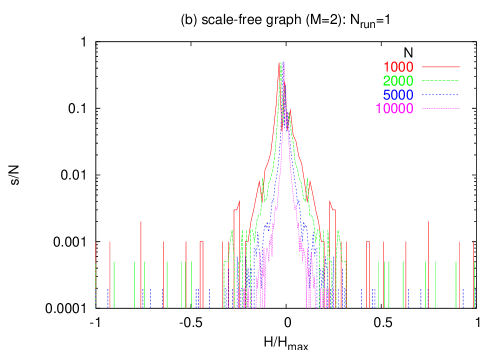
The results shown in Fig. 4(b) are equivalent to a plot of the interaction energy against field. Each antiferromagnetic pair (AFP) gives the contribution to the energy. Then the energy of interaction can be written approximately as . Again we see that higher connectivity enhances the amount of frustration. We note that the width of the presented curve is much larger for SFN than for EXN. This is a consequence of the fact that a node with maximal connectivity has much more links for the scale-free graphs.
After each field update an avalanche of spin flips propagates until the energy is minimized for the applied field value. The distribution of avalanches is integrated along the hysteresis loop, and averaged over networks of given kind and size. This method has been applied both in simulations [22] and experiment in disordered magnetic systems [23]. The underlying physical mechanism in these systems is the pinning of domain walls by quenched disorder of the network structure. It leads to the Barkhausen noise of flipping of magnetic domains [24]. The role of disorder in the fractal nature of the observed Barkhausen noise has not been fully understood [25]. The idea that the underlying processes of self-organized criticality [26] are responsible for the occurrence of the scale-free distributions of avalanches could not be proved in the general case. Often the observed finite avalanche cut-offs can be related to the finite sizes of the domains. Here we would like to stress that the controversy about the domain sizes does not appear in our networks. The only relevant scale is the network size. Likewise, the concept of domain walls has a different meaning, as discussed below. In our numerical experiment we can make distinction between the actual change of the magnetization and the number of flipped spins within an avalanche , which can be larger than (see Fig 5).
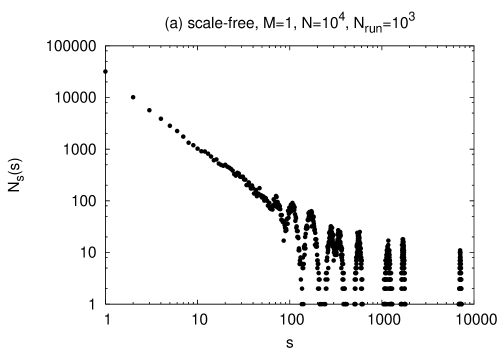


The results for the distribution of avalanches for different kinds of networks are shown in Fig. 6. The plots are composed of two parts: For small values of the avalanche size , the log-log plot is an approximately straight line; For larger sizes we observe some oscillations with increasing amplitude. In the case of trees (, absence of frustration) the plots end with a well-defined maximum, corresponding to the largest avalanche along the hysteresis loop. The size of this avalanche is larger in the scale-free tree, compared with the exponential tree of the same number of links. For larger values of , the multipeaky character of the plots vanishes. However, for small we observe the power-law behavior of the spectra in the whole investigated range of , i.e. from 1 to 25. The values of the effective exponent — defined by the relation — is constant for the exponential networks and it slightly increases with for the scale-free networks [32].
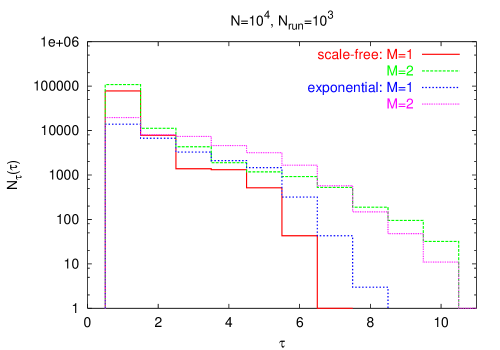
The distribution of the time of duration of avalanches is shown in Fig. 7. Here, one time step is defined as the time necessary to scan all spins in the system — spin by spin — to check if they flip or not. The time of the avalanche duration is defined as the number of time steps which is necessary to get a stable state, i.e., when all flips die out at a given field . As we see, the range of avalanche durations covers only one order of magnitude. The reason is the small-world effect [3], i.e., short distance between the nodes in random graphs. As a consequence, the obtained range of increases with the network size only as . For the networks investigated here the avalanches never take more than nine or ten time steps. The diameters [33] of the networks considered in this work, shown in Tab. 1, are comparable to the average avalanche duration.
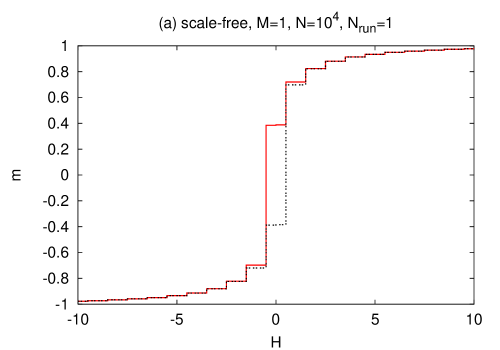
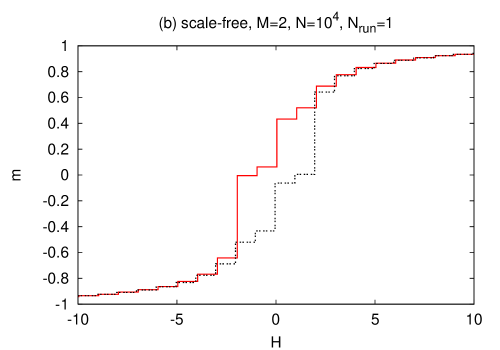
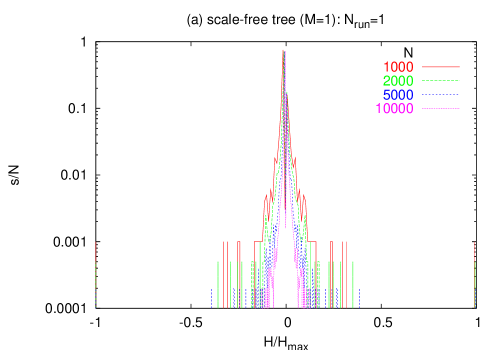
The data in Fig. 4(a) for SFN are compared with those in smaller graphs for [Fig. 8(a)] and [Fig. 8(b)]. In these figures the field is normalized to , which is different for different graph size, i.e., and for and , respectively. The logarithmic plots in Fig. 8 reveal that the maximal avalanches normalized by number of nodes do not decay with the system size . This means that the largest jump in the magnetization on the hysteresis curve persists when the network size increases, suggesting that true criticality of the hysteresis loop [27] occurs in the scale-free networks. Note that for trees, there is a gap of the avalanche spectrum between and . This gap vanishes for . This is visible also in Fig. 6, where the largest avalanches form sharp and separate maxima of the curve .
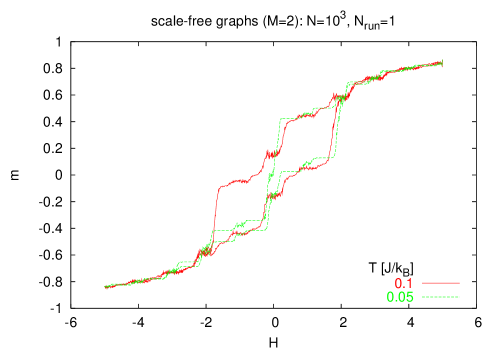
When temperature increases, the hysteresis loops observed in the numerical experiments become more noisy, their area decreases and finally vanishes for . Two examples of such loops obtained with Metropolis algorithms [28] are shown in Fig. 9 for and [] [29]. The avalanche size distribution preserves its power-law character for the above values of temperature. However, the thermal noise does not allow to separate sharp peaks for large , which are visible in the case of (Fig. 6). We note, that the calculations for are time-consuming. Still, we can deduce from the results of the simulation that the magnetization curves of the spin-networks at finite temperature are similar to those at , as long as the thermal energy is much smaller that the energy of the node-node magnetic interaction between nearest neighbors.
A typical running for and takes about half of minute of CPU time on Intel Itanium 2 (1.5 GHz) processor. For statistics given here () it gives over eight hours of CPU time per one network and one branch of hysteresis .
5 Discussion and conclusions
The results show that the connectivity distribution in complex networks with antiferromagnetic bonds leads to broad distributions of avalanches. In the scale-free networks, the maximal degree is larger than in the exponential networks of the same size. This difference produces broader loops for SFN than for EXN. On the other hand, for networks with larger connectivity () the right parts of histograms of avalanches are irregular, whereas for trees () we observe fine structure of sharp maxima with zero signal between them.
It is possible to interpret the size of maximal avalanches in terms of the structure of the investigated networks. It appears that is comparable with the number of nodes with minimal degree. On the other hand, happens to be equal to the number of spins which flip at field between and for decreasing field . Let us trace these rules in detail.
In Fig. 6 we see that maximal avalanches for SFN trees contain approximately 7100 flipping spins, i.e. 71 percent of the system size. This value corresponds to the height 0.72 of the maximum in Fig. 4(a), which happens to appear at again for the decreasing field branch. On the other hand, the degree distribution for SFN is known to be [30]
| (2) |
For trees, the minimal degree is , then, for SFN we get . These three numbers, in first column of numbers in Table 1 (scale-free, M=1) are close to each other; our interpretation is that they give approximate information on the same process.
The same expression (2) applies to SFN with , i.e. , as the degree cannot be smaller than . Calculating from Eq. (2) gives . This is to be compared with the size of the maximal avalanche for SFN, in Fig. 6, and to the fraction of spins which flip at field close to , as shown in Fig. 4(a). The numerical values are given in the second column (scale-free, ) of Tab. 1. As we see, they all of them are close to 0.5. Again, this means that the largest avalanche contains spins at all nodes with , and this avalanche happens also at .
| scale-free | exponential | |||
| 1 | 2 | 1 | 2 | |
| for | 0.72 | 0.49 | 0.41 | 0.23 |
| 0.73 | 0.54 | 0.44 | 0.25 | |
| 2/3 | 1/2 | 1/2 | 1/3 | |
| 1.38 | 1.39 | 0.97 | 1.00 | |
| 1.56 | 1.48 | 0.92 | 0.93 | |
| 9.1 | 5.1 | 15.6 | 5.1 | |
The same evaluation for EXN, i.e., for , and for from Fig. 4(a), when compared with gives a qualitative accordance. As a rule, the size of maximal avalanches is comparable with the system size. This results suggests that the self-organized criticality (SOC) might be a possible mechanism of the spin-reversal dynamics in the antiferromagnetic disorder-free networks. We note that for EXN trees, the number of leaves of minimal degree can be evaluated from [4] as for . For , the distribution [17] gives . Comparison of the results for EXN is included in third and fourth column of Tab. 1. These numbers prove, that in the hysteresis experiment, maximal avalanches for the descending field appear when . The spins flipping in these avalanches occupy the nodes with minimal degree . The observed quantitative differences might be attributed to the finite network sizes in the numerical calculations; this produces deviations of simulation results from theoretical formula, which are exact in the thermodynamic limit.
Left parts of the histograms, i.e. the spectra for small avalanche sizes, are straight lines in the log-log scale. This means that , with close to for the exponential networks and slightly increasing with for the scale-free networks. It is not clear if this variation of for the scale-free networks is a consequence of a -dependent finite size effect, or it means just a lack of universality. We cannot verify it, because for large networks, the numerical algorithm becomes very time-consuming. However, this scaling behavior is valid only in the range of the avalanche size not much larger than one order of magnitude [11]. The latter apply also to the distribution (see Fig. 10). The effective exponents and are also shown in Tab. 1. Spins which flip in this way are neither leaves (for ), nor “leaves with two stems” (for ), but they form “central” (here the oldest) parts of the networks. The results suggest that the spin flips in the better connected parts of the network form small avalanches with power-law distributions.


Basing on these results we expect that avalanches and critical behavior may occur in various systems with broad connectivity distributions where some negative feedback exists between local degrees of freedom. In our spin-networks it is the antiferromagnetic character of interaction which causes this kind of feedback. More direct interpretation depends on particular systems. In particular, avalanches seem possible in complex magnetic systems as quantum magnetic cellular automata with magnetostatic interaction between particular monodomain elements [31]. The size of avalanches is limited only by the size of the network. Then, this kind of collective flipping is related to an instability of the system. Design of an appropriate spatial structure, in particular by increasing clustering of the networks [11] allows to tune and control the magnetization curve.
Concluding, our numerical results indicate that the positions of the largest peaks in the spectra of avalanches, which measure the size of the largest avalanches, agree well with the numbers of spins flipped at the field equal to the connectivity parameter . The latter can be interpreted as the numbers of nodes with minimal degree for networks with different topologies and connectivities. These results agree qualitatively with known theoretical formula for the degree distributions.
References
- [1] S. Dorogovtsev, J. F. F. Mendes, Evolution of Networks: From Biological Nets to the Internet and WWW, (Oxford UP, 2003).
- [2] A.-L. Barabási, Linked: The New Science of Networks, (Perseus Publ., Cambridge, 2002).
- [3] R. Albert, A.-L. Barabási, Rev. Mod. Phys. 286 (2002) 47.
- [4] S. N. Dorogovtsev, J. F. F. Mendes, Adv. Phys. 51 (2002) 1079.
- [5] M. E. J. Newman, SIAM Rev. 45 (2003) 167.
- [6] R. Pastor-Satorras, A. Vespigniani, Evolution and Structure of the Internet: A Statistical Approach, (Cambridge UP, 2004).
- [7] V. J. Hodge, K. J. Lees, J. L. Austin, Neural Networks 17 (2004) 441; F. Liljeros, C. R. Edling, L. A. Nunes Amaral, H. E. Stanley, Y. Aberg, Nature 411 (2001) 907; L. Smolin, Atoms in Space and Time, Scientific American, January 2004.
- [8] K. Malarz, M. Zborek, B. Wróbel, TASK Quarterly 9 (2005) 475; A. Krawiecki, Physica A 333 (2004) 505; C. P. Herrero, Phys. Rev. E 69 (2004) 067109.
- [9] A. O. Sousa, K. Malarz, S. Galam, Int. J. Mod. Phys. C 16 (2005) 1507; K. Malarz, Int. J. Mod. Phys. C 14 (2003) 561.
- [10] D. Stauffer, K. Kułakowski, TASK Quarterly 7 (2003) 257.
- [11] B. Tadić, K. Malarz, K. Kułakowski, Phys. Rev. Lett. 94 (2005) 137204.
- [12] S. Galam, P. Azaria, H. T. Diep, J. Phys.: Condens. Matter 1 (1989) 5473.
- [13] F. W. S. Lima, D. Stauffer, Physica A 359 (2006) 423; M. A. Sumour, M. Shabat, Int. J. Mod. Phys. C 16 (2005) 585.
- [14] Note that due to the nature of the problem lowest driving rate is finite . See F. J. Pérez-Reche et al., Phys. Rev. Lett. 93 (2004) 195701 for finite driving rate effects in classical disordered solids.
- [15] G. Zheng, M. Pardavi-Horvath, G. Vertesy, J. Appl. Phys. 81 (1997) 5591.
- [16] A.-L. Barabási, R. Albert, Science 286 (1999) 509.
- [17] K. Malarz, K. Kułakowski, Acta Phys. Pol. B 36 (2005) 2523.
- [18] If each node is labeled, some permutation of labels leaves some graphs unchanged; then we can speak about symmetry, and the graphs are isomorphic: R. J. Wilson, Introduction to Graph Theory, (Addison Wesley Longman Ltd., London, 1996).
- [19] M. J. Krawczyk, K. Malarz, B. Kawecka-Magiera, A. Z. Maksymowicz, K. Kułakowski, Phys. Rev. B 72 (2005) 024445.
- [20] D.-H. Kim, G. J. Rodgers, B. Kahng, D. Kim, Phys. Rev. E 71 (2005) 056115; C. M. Newman, D. L. Stein, J. Phys.: Condens. Matter 15 (2003) R1319.
- [21] W. de Nooy, A. Mrvar, V. Batagelj, Exploratory Social Network Analysis with Pajek, (Cambridge UP, 2005); P. Doreian, V. Batagelj, A. Ferligoj, Generalized Blockmodeling, (Cambridge UP, 2005); http://vlado.fmf.uni-lj.si/pub/networks/pajek/.
- [22] E. Vives, A. Planes, J. Magn. Magn. Mater. 221 (2000) 164.
- [23] D. Spasojević, S. Bukvić, S. Milosević, H. E. Stanley, Phys. Rev. E 54 (1996) 2531.
- [24] H. Barkhausen, Z. Phys. 20 (1919) 401.
- [25] F. J. Pérez-Reche, E. Vives, Phys. Rev. B 67 (2003) 134421; B. Tadić, Phys. Rev. Lett. 77 (1996) 3843; B. Tadić, U. Nowak, Phys. Rev. E 61 (2000) 4610.
- [26] P. J. Cote, L. V. Meisel, Phys. Rev. Lett. 67 (1991) 1334.
- [27] S. Sabhapandit, P. Shukla, D. Dhar, J. Stat. Phys. 98 (2000) 103.
- [28] N. Metropolis, A. W. Rosenbluth, M. N. Rosenbluth, A. H. Teller, E. Teller, J. Chem. Phys. 21 (1953) 1087; D. W. Heermann, Computer Simulation Methods, (Springer-Verlag, Berlin, 1990).
- [29] J. Karpińska, M.Sc. thesis, AGH-UST, Cracow 2004 (in Polish).
- [30] S. N. Dorogovtsev, J. F. F. Mendes, A. N. Samukhin, Phys. Rev. E 64 (2001) 066110.
- [31] R. P. Cowburn, M. E. Welland, Science 287 (2000) 1466.
- [32] W. Antosiewicz, M.Sc. thesis, AGH-UST, Cracow 2006 (in Polish).
- [33] K. Malarz, J. Karpińska, A. Kardas, K. Kułakowski, TASK Quarterly 8 (2004) 115.