The electronic structure of La1-xSrxMnO3 thin films and its dependence as studied by angle-resolved photoemission
Abstract
We present angle-resolved photoemission spectroscopy results for thin films of the three-dimensional manganese perovskite La1-xSrxMnO3. We show that the transition temperature () from the paramagnetic insulating to ferromagnetic metallic state is closely related to details of the electronic structure, particularly to the spectral weight at the -point, where the sharpest step at the Fermi level was observed. We found that this -point is the same for all the samples, despite their different . The change of is discussed in terms of kinetic energy optimization. Our ARPES results suggest that the change of the electronic structure for the samples having different transition temperatures is different from the rigid band shift.
Colossal magnetoresistance (CMR) in hole-doped manganese oxides with perovskite structures Kusters ; Jin is a phenomenon of great scientific and technological importance. For a certain range of doping, La1-xSrxMnO3 (LSMO) shows a large decrease in resistivity upon cooling, associated with a paramagnetic (PM) to ferromagnetic (FM) transition Urushibara ; Hemberger . Close to the transition temperature , the resistivity can be further strongly reduced by applying a magnetic field, in a phenomenon known as colossal magnetoresistance. The temperature-dependent resistivity in the FM phase have been qualitatively explained by the double-exchange (DE) mechanism Zener ; Cieplak . The premise is as follows: in the FM phase, LSMO contains mixed-valent Mn3+ and Mn4+. For the site-symmetry of the cation in the MnO6 octahedra, the valence states in question are Mn4+: and Mn3+: . There are electrons per unit cell, which are free to move through the crystal, subject to a strong Hund’s coupling to the localized Mn4+ (S = 3/2) spins. The kinetic (band) energy is minimized by making all the spins parallel. It was also realized that the DE alone is not enough to explain CMR and other effects, especially the insulator-like transition above . The DE framework should be supplemented with more refined ideas (e.g. Jhan-Teller distortions, polaron formations) Millis2 . Among the Ruddelson-Popper series of manganites, (La,Sr)n+1MnnO3n+1 (n = 1, 2, …), (La,Sr)MnO3 has the highest and its resistivity at low temperatures is about two orders of magnitude lower than that of the layered manganite (n = 2) Kimura .
One major obstacle in understanding the physics of the three-dimensional manganites has been a lack of detailed knowledge of the electronic structure of the low binding energy electronic states. So far, only very limited experimental results on -resolved electronic structures of La1-xSrxMnO3 have been reported Shi ; Falub ; Chikamatsu . In this work we apply angle resolved photoemission spectroscopy (ARPES) to probe the electronic structure of metallic single crystalline films of La1-xSrxMnO3 with different . We observe that the finite spectral weight at the Fermi level (EF) is closely associated with a broad peak which disperses at higher binding energies. The difference in is directly reflected by a change in the electronic structure of the lowest binding energy states.
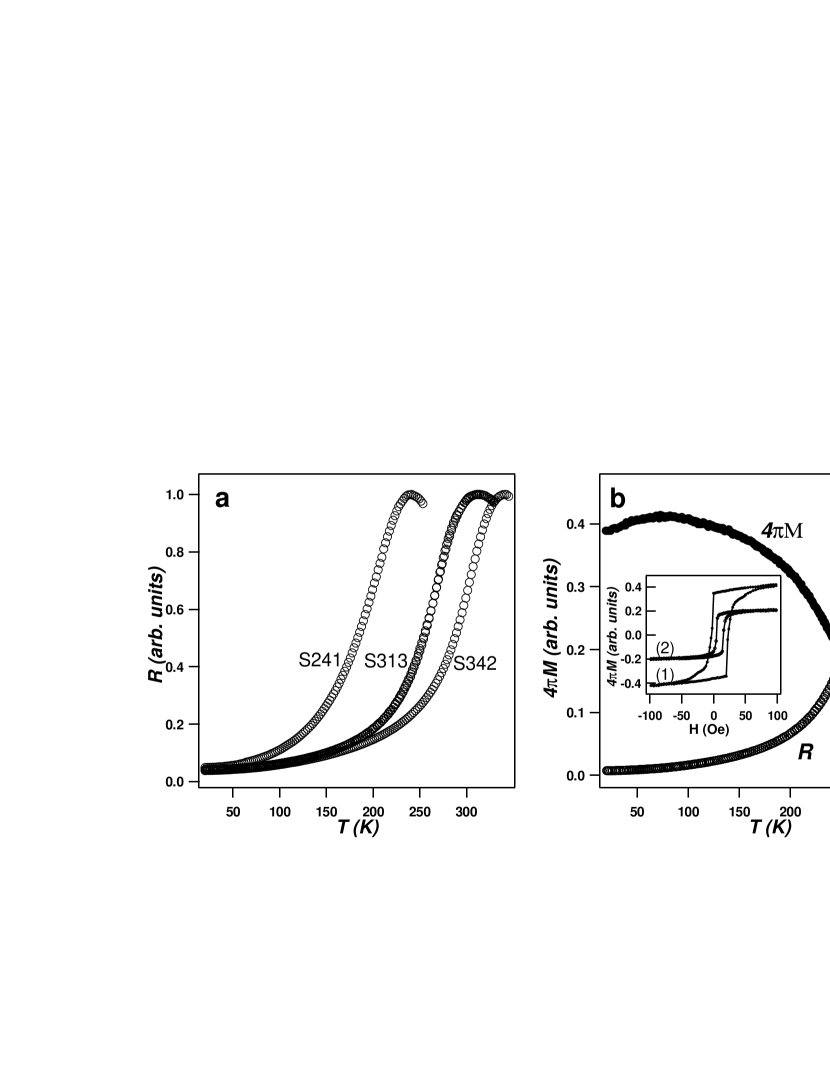
1300 Å-thick single crystalline thin films of LSMO were prepared by in situ heteroepitaxial growth on SrTiO3 (001) substrates by a novel adaptation of pulsed laser deposition Willmott1 ; Willmott2 . In situ reflection high-energy electron-diffraction patterns and Kiessig fringes in ex situ x-ray reflectivity curves demonstrate that the films have a surface roughness of less than one monolayer. Low-energy electron-diffraction analysis shows a clear (1 1) pattern with no sign of surface reconstruction. Three LSMO samples with ascending Sr/La ratios (0.44, 0.48, 0.52) were prepared. Because the hole-doping level could be changed by the small variation of the Oxygen stoichiometry, which can result in a change of , we further characterize the bulk properties of the samples by transport measurements. Figure 1a shows the resistance-temperature curves [R(T)] obtained from four-probe measurements. The transition temperatures determined from these data are 241 K, 342 K and 313 K, respectively. In the rest of the paper we will label the samples by their as S241, S342 and S313, respectively. The transition temperatures were confirmed by DC magnetization measurements. Figure 1b shows the magnetic momentum [4M(T)] of S313, together with R(T), as a function of temperature. The stoichiometry of S313, as determined by ex situ using Rutherford backscattering spectrometry, was La0.66Sr0.34MnO3.

ARPES measurements were performed at the Surface and Interface Spectroscopy (SIS) beamline at the Swiss Light Source (SLS). During measurements, the pressure always remained less than 1 10-10 mbar. The spectra were recorded with a Scienta 2002 analyzer with an angular resolution of better than 0.2∘. The energy resolution was relaxed to 40 meV to obtain a high intensity. All measurements were performed at temperature below 30 K. The reduced zone scheme is used to indicate the wave vectors () in reciprocal space. The free-electron final state approximation with (V0 - ) = 10.16 eV Shi is applied to determine paths or -points, where V0 is the inner potential and is the work function. Photon energies (Ehν) are indicated in the figure captions. In our ARPES measurements the polar angles (between the surface normal and the direction of the outgoing photoelectrons) were in the range of -5∘ 18∘.
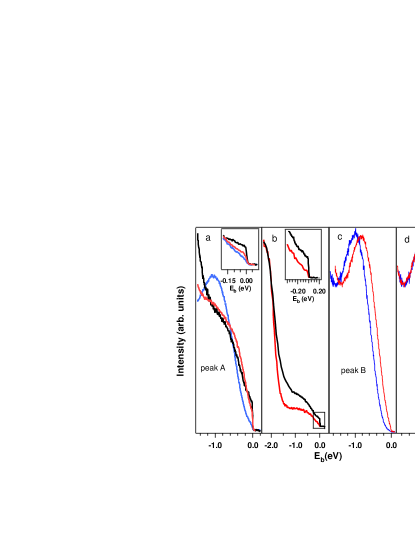
We show representative ARPES spectra taken from S313 in Fig. 2. Similar ARPES spectra were also obtained for S241 and S342. The spectra were collected along paths parallel to the sample surface in the (010) mirror plane (Fig. 2a) and (10) mirror plane (Fig. 2b), with linearly horizontally polarized light and with circularly polarized light, respectively. The common features in Fig. 2a and 2b are: close to the (001) axis a broad peak (peak A) sits on the sloped background and shows nearly no dispersion along k|| (the component of parallel to sample surface). Away from the (001) axis at about k|| = 0.3 /a, another peak (peak B) appears at higher binding energy and disperses towards EF as k|| increases. Further increasing k|| does not change the peak position of peak B in the (010) mirror plane, while it folds back to high binding energy in (10) mirror plane (not shown). The bandwidth of peak B in the (10) mirror plane is larger than that in the (010) mirror plane. In contrast to its non-dispersive behavior with respect to k|| in the vicinity of the (001) axis, peak A does show a dispersion with respect to k⟂ (along the surface normal, Fig. 2c). It can be seen that there is a close correlation between the peak position and the spectral weight at EF. Specifically, when peak A approaches EF, the spectral weight at EF increases and the step at EF sharpens. It should be noted that a finite spectral weight at EF has only been observed in the vicinity of the (001) axis in the Brillouin zone (BZ) with k|| 0.4 /a. The highest spectral weight and the sharpest step at EF have been found at k (0,0,0.4)/a, when Ehν = 38 eV or 67 eV is used. This applies for all the investigated samples, despite their different Tc. Peak B also disperses along a path parallel to the (001) axis Shi . This is strong circumstantial evidence that the dispersion of peak B derives from the bulk electronic structure. However, the dispersive feature is much weaker than that in the planes perpendicular to the (001) axis. It is important to mention that we have traced the peak B in different mirror planes, as well as many general -points in the BZ by using various photon energies and photon polarizations. We found that there is a correspondence between the positions of peak B and the of the samples (Fig. 3c): the higher Tc is, the closer becomes peak B to EF. However, for all three samples, the centroids of peak B never approach closer than 0.6 eV to EF, and there is never more than a vanishingly small spectral weight at EF.
Besides the many similarities, there are some quantitative differences in the ARPES spectra of S241, S342 and S313. Figure 3a and 3b show the EDCs taken with Ehν = 38 eV, corresponding to k (0,0,0.4)/a, where the highest spectral weight at EF was observed for all three samples. The spectra were normalized to the total areas under the EDCs. An important observation is that the spectral weight at EF is closely related to the transition temperatures, namely, the spectral weight at EF is higher when increases (Fig. 3a). In order to remove any ambiguity when comparing the spectral weight at EF, two additional normalization methods were employed. First, to minimize the contribution of the sloped background, we normalized the EDCs to the intensity at EB = 200 meV below EF (the inset of Fig. 3a). Second, for normalization we used the ”shoulder” of the Mn states of Mn (Fig. 3b). In both cases the spectral weights at EF for different samples have the same trend as the s of the samples. Figure 3a also shows that the line shape of peak A changes dramatically for the samples with different . For S241, it has the lowest among the three samples, and peak A is well defined. As increases some spectral weight is transferred from high binding energies to that close to EF, and at the same time peak A becomes broader and less pronounced. On the other hand, the line shape of peak B is rigid with respect to the change of . Figure 3c shows the EDCs for S241 and S313 taken at the same k (0.6,0,0.7)/a where a single band is expected Livesay ; Pickett . The peak position of the EDC of S313 is shifted about 170 meV towards EF with respect to that of S241. After offsetting the EDC of S313 by -170 meV the two EDCs overlap over nearly the entire energy range, except at the very low binding energy tail, where the EDC of S313 has a smaller spectral weight (the marked box in Fig. 3d).
We now address the issue of coherent electronic excitations at low binding energies. In recent ARPES studies of the layered manganite La2-2xSr1+2xMn2O7 with , it has been shown that quasiparticle peaks do exist close to the Fermi level Sun ; Mannella ; Jong . The quasiparticle peaks are followed by incoherent excitations, and the single particle spectral function has a ”peak-dip-hump” structure which indicates strong many-body effects and/or electron-lattice coupling. As our samples are three-dimensional, one would expect a higher spectral weight of coherent electronic excitations in the energy range where quasiparticles were observed in the layered manganite. The absence of sharp excitations in our ARPES spectra may be explained by the uncertainty of k⟂, the component of k along the surface normal, in the photoemission process. Because k⟂ is not conserved, due to the breaking of the translational symmetry at the sample surface, ARPES spectra in a three-dimensional system will be broadened (k⟂), especially for an energy band that has a large dispersion in the direction along the surface normal. The large change of the slopes as marked by the vertical line in Fig. 2c may indicate that the peak-dip-hump structure also exists in our samples. However, the broadening effect smears out the dip in the ARPES spectra.
We observed the finite spectral weight at EF only in the vicinity of (0,0,0.4)/a in the -space. This particular -point would correspond to the of the electron-pocket centered at point from band structure calculations Livesay ; Pickett when assuming that La1-xSrxMnO3 has a cubic structure. However, in our measurements there is never more than a vanishingly small spectral weight at EF at equivalent -points (0.4,0,0)/a or (0,0.4,0)/a, despite that various photon polarizations and different photon energies corresponding to the same -points in the reduced zone scheme were used in our experiments. Finite spectral intensities at the predicted Fermi surface of the hole-pocket centered at the R point (the corner of the BZ) in those calculations was also not observed in our measurements, and indeed was not reported in other ARPES studies on the same system Chikamatsu . As the calculated Fermi surface of the hole-pocket has a cubic-like shape Livesay ; Pickett , the nesting of the Fermi surface between the parallel faces of the cube may introduce an instability and result in a gap opening in the electronic excitation spectra. The consequence of this will be that the spectral weight at EF diminishes and the relevant energy band folds back from EF. In our previous ARPES studies on LSMO we observed the folding back of an energy band which is supposed to cross the calculated Fermi surface of the hole-pocket (see Fig. 1a and Fig. 2a in ref. Falub ). Another possibility to explain the absence of the hole-pocket is heteroepitaxial strain in the samples. The common point in our ARPES studies and others is that single crystalline LSMO films grown on SrTiO3 substrates were used in the experiments. The tensile stress due to the lattice mismatch between the LSMO and the substrate results in the ratio between the lattice constant in the [001] direction and those in the equivalent [100] directions is less than unity. Further studies are needed to understand the discrepancy between the experimental and calculated results, namely, is it due to the nesting, the change of lattice constant, a combination of these, or other effects? To clarify the role played by the strain induced by any lattice mismatch, it will be very useful to perform ARPES measurements on single crystals grown on different substrates, e.g. NdGaO3. In this case the compressive stress results in the lattice constant in [001] direction being larger than that in [100] direction. Comparison of the ARPES results on LSMO crystals under different stress will be very important in understanding how the electronic structure responds to small changes of the lattice constants.
Our ARPES results also indicate that the change of the electronic structure for the samples with different is different than the rigid band shift, as suggested in the angle integrated photoemission on the LSMO filmsHoriba . This is manifested by the facts that a) for all the samples, the highest spectral weight was found at the same -point (0,0,0.4)/a when Ehν = 38 eV is used in the measurements; b) the centroid of peak A of S313 is closer to EF than that of S342 at this -point, but S313 has a lower spectral weight at EF than S342 (Fig. 3a), which is opposite to what one would expect from the rigid band picture Shen ; and c) for S241 the peak position of peak A at k (0,0,0.4)/a is about the same as that of peak B at k (0.6,0,0.7)/a (Fig. 3a and 3c). When going to S313, the shift of the peak position of peak B (170 meV) is much smaller than that of peak A, 500 meV, and compared to the small change in the line-shape of the peak B at the low binding-energy tail (the marked box in the Fig. 3d) the spectral weight of peak A undergoes a large redistribution (Fig. 3a).
The relationship between and the spectral weight at EF, namely that a higher is associated with more spectral weight at EF, can be qualitatively explained by the double exchange model Kubo ; Ohata ; Millis . The essential quantity for the transition from PM to FM is the metallic density of charge carriers, which are subject to Hund’s rule and other interactions. The scale of the transition temperature is set by the kinetic energy of the mobile charge carriers, which is proportional to the expectation value of the hopping Hamiltonian. The highest is obtained when the kinetic energy is maximized in the system. As the Fermi level divides the occupied states and unoccupied states of electrons, the spectral weight in electronic excitation spectra is directly related to the hopping probability given by the number of electrons that are free to move from site to site and the number of available empty states that the electrons can hop into.
In summary, our ARPES measurements on LSMO thin films with different reveal both common features and quantitative differences in their electronic structures in the FM phase. It was found that is closely related to the spectral weight at EF at (0,0,0.4) /a, where the sharpest step at EF was observed for all investigated samples. We also provide evidence that the rigid band picture cannot account for the change of the electronic structure for the samples having different resulting from the change of dopings.
This work was performed at the Swiss Light Source, Paul Scherrer Institut, Villigen, Switzerland. R. Betemps, M. Kropf, F. Dubi and J. Rothe are acknowledged for technical support. This work was supported by Paul Scherrer Institut.
References
- (1) R. M. Kusters et al., Physica (Amsterdam) 155B, 362 (1989).
- (2) S. Jin et al., Science 264, 413 (1994).
- (3) A. Urushibara et al., Phys. Rev. B 51, 14103 (1995).
- (4) J. Hemberger et al., Phys. Rev. B 66, 094410 (2002).
- (5) C. Zener, Phys. Rev. 82, 403 (1951).
- (6) M. Cieplak, Phys. Rev. B 18, 3470 (1978).
- (7) A.J. Millis et al., Phys. Rev. Lett. 74, 5144 (1995).
- (8) T. Kimura et al., Mat. Res.. Soc. Symp. Proc. 494, Science and Technology of Magnetic Oxides, edited by M.F. Hundley, J.H. Nickel, R. Ramesh and Y. Tokura, pp. 347.
- (9) M. Shi et al., Phys. Rev. B 70, R140407 (2004).
- (10) M.C. Falub et al., Phys. Rev. B 72, 054444 (2005).
- (11) A. Chikamatsu et al., Phys. Rev. B 73, 195105 (2006).
- (12) P. R. Willmott and J. R. Huber, Rev. Mod. Phys. 72, 315 (2000).
- (13) P. R. Willmott, R. Herger, and C. M. Schlep tz, Thin Solid Films, 453-454, 438 (2004).
- (14) E. A. Livesay et al., J. Phys.: Condens. Matter 11, L279 (1999).
- (15) W. E. Pickett and D. J. Singh, Phys. Rev. B 55 R8642 (1997)
- (16) Z. Sun et al., Phys. Rev. Lett. 97, 056401 (2006).
- (17) N. Mannella et al., Nature 438, 474 (2005).
- (18) S. de Jong et al., arXiv:0710.2054 (2007).
- (19) K. Horiba et al., Phys. Rev. B 71, 155420 (2005).
- (20) K. M. Shen et al., Phys. Rev. Lett. 93, 267002 (2004).
- (21) K. Kubo and A. Ohata, J. Phys. Soc. Jpn. 33, 21(1972).
- (22) N. Ohata, J. Phys. Soc. Jpn. 34, 343(1973).
- (23) A.J. Millis, in Colossal Magnetoresistive Oxides, edited by Y. Tohura (Amsterdam : Gordon and Breach Science Publishers, 2000), p. 53.