Two Phase Collective Modes in Josephson Vortex Lattice in Intrinsic Josephson Junction Bi2Sr2CaCu2O8+δ
Abstract
Josephson plasma excitations in the high superconductor Bi2Sr2CaCu2O8+δ have been investigated in a wide microwave frequency region (9.8 – 75 GHz), in particular, in magnetic field applied parallel to the plane of the single crystal. In sharp contrast to the case for magnetic fields parallel to the axis or tilted from the plane, it was found that there are two kinds of resonance modes, which are split in energy and possess two distinctly different magnetic field dependences. One always lies higher in energy than the other and has a shallow minimum at about 0.8 kOe, then increases linearly with magnetic field. On the other hand, another mode begins to appear only in a magnetic field (from a few kOe and higher) and has a weakly decreasing tendency with increasing magnetic field. By comparing with a recent theoretical model the higher energy mode can naturally be attributed to the Josephson plasma resonance mode propagating along the primitive reciprocal lattice vector of the Josephson vortex lattice, whereas the lower frequency mode is assigned to the novel phase collective mode of the Josephson vortex lattice, which has never been observed before.
pacs:
74.25.Qt, 74.50.+r, 74.25.Nf, 72.30.+qI Introduction
The phase collective excitation in Josephson junctions known as Josephson plasma has been studied since the 1960’s, triggered by a theoretical prediction of Anderson. Anderson (1964) However, there are only a few experimental reports on Josephson plasma resonance in single junctions made by conventional superconductors Dahm et al. (1968); Pedersen et al. (1972) because there is a strong damping effect of the quasiparticles due to small superconducting energy gap in the single junctions. This situation was improved drastically in the case of high superconductors because they are comprised of well-established weakly coupled Josephson junctions along the crystallographic axis (intrinsic Josephson junction), whose plasma frequency along the axis is much lower than the superconducting gap. In particular, in the case of Bi2Sr2CaCu2O8+δ (Bi2212), Kleiner et al. (1992); Kleiner and Müller (1994) the superconducting CuO2 layers and the insulating or semiconducting Bi2O2 layers are regularly stacked in an atomic level in the unit cell forming a weakly coupled Josephson junctions. Based on this, Tachiki and co-workers predicted the existence of the Josephson plasma excitation in high superconductors. Tachiki et al. (1994); Bulaevskii et al. (1995) Subsequently, two theoretical models have been developed : one by Koyama and Machida, Koyama and Tachiki (1996); Machida et al. (1999) the other by Pedersen and Sakai. Pedersen and Sakai (1998); Sakai and Pedersen (1999) Quite recently, a unified theory has been reported. Machida and Sakai (2004)
The Josephson plasma resonance in Bi2212 is observed as a sharp and strong microwave absorption in a finite magnetic field parallel to the axis. Matsuda et al. (1995) Especially, the longitudinal Josephson plasma mode gives an extremely sharp resonance because of its small dispersion and the high quasiparticle damping rate of Bi2212 Kadowaki et al. (1997a); Ohashi and Takada (1999). The clear observation of the longitudinal plasma resonance has been a strong advantage of Bi2212 for investigation of the Josephson plasma phenomena in superconductors compared with many other materials such as La2-xSrxCuO4, Tamasaku et al. (1992) Bi2(Sr,La)2CuO6+δ(Bi2201), Sakamoto et al. (1996) YBa2Cu3O7-δ(YBCO), Tajima et al. (1997) and BEDT-TTF salts, Shibauchi et al. (1997) in which the Josephson plasma resonance (edge) is less clear.
According to the theory of the Josephson plasma resonance, the resonance frequency can be written as Bulaevskii et al. (1995, 1996)
| (1) |
where is the Josephson plasma frequency in the absence of a magnetic field. and stand for the dielectric constant and the temperature-dependent axis penetration depth, respectively. is the gauge-invariant phase difference between the ()th and ()th layers and denotes the spatial and time averages.
In the case of a magnetic field parallel to the axis (perpendicular to the superconducting CuO2 layers), it is well known that pancake vortices are generated above , the lower critical field. For the Josephson plasma resonance, this situation is taken into account by considering the uniform reduction of the Josephson current along the -axis, resulting in the decrease of ,— i.e., the reduction of in Eq. (1). Because of this fact, the Josephson plasma resonance can be used as a sensitive method to evaluate . Koshelev (1996); Shibauchi et al. (1999); Kakeya et al. (2001); Koshelev et al. (2000)
This treatment cannot be applied to the case where the external magnetic field is parallel to the plane. In this case, the Josephson vortices are introduced in-between the CuO2 double layers and contribute the Josephson plasma resonance as an essential ingredient of the phenomenon. In contrast to the case for the perpendicular field, the plasma frequency is hardly suppressed because the fluctuations of pancake vortices are too small to dominate the interlayer coupling. This is clearly observed in the angular dependence of the Josephson plasma resonance near the plane. A sharp dip in the Josephson plasma resonance field is clearly observed within an angle of 2 degrees from the plane. Kadowaki et al. (1997b) From this sharp change of the Josephson plasma resonance behavior, it is in turn expected that the dynamical motion of Josephson vortices such as Josephson vortex lattice collective modes has been thought to account for the Josephson plasma resonance frequency. This opens entirely new possibilities for the Josephson plasma resonance phenomena in the case of parallel magnetic field configurations and deserves more detailed consideration both experimentally and theoretically. Since the Josephson vortex modulates the interlayer Josephson tunnelling current in the length scale of along the plane, where is the anisotropy parameter and is the interlayer distance, the collective plasma oscillation strongly couples with the collective Josephson vortex motion such as Josephson vortex lattice modes.
This picture is initiated by the single junction model, which was studied in the 1960s by Lebwohl and Stephen Lebwhol and Stephen (1967) and by Fetter and Stephen Fetter and Stephen (1968) theoretically. They solved a one- dimensional nonlinear wave equation and obtained two modes as excitation spectra: one of them lies above the plasma gap in zero field and approaches asymptotically the linear relation with the propagation vector (plasma mode). Another mode obtained by Fetter and Stephen in a single junction is a gapless vortex sliding mode. The plasma mode with an array of Josephson vortices was first of all observed indirectly as a so-called Eck resonance in the current–voltage () characteristics of the Pb/PbO/Pb single junction, in which the resonance was detected at a voltage proportional to the applied parallel field .Eck et al. (1964) Fiske has also shown an anomalous step-like behavior in the characteristics in Al, Sn, Pb, and Nb junctions Fiske (1964) and this phenomenon was associated with the resonant electromagnetic modes of the junction.
More recently, Josephson plasma resonance experiments have been performed in the external magnetic field configuration being closely parallel to the plane in single-crystal Bi2212. Matsuda et al. (1997); Tsui et al. (1997); Kadowaki et al. (1997b) They observed anomalous behaviors such as the angular dependence of the resonance field associated with the sudden jump of it, which have partly been explained by the theory of Bulaevskii et al. Bulaevskii et al. (1997) It seems that the resonance mode indicating this anomalous behavior can be described qualitatively by the single junction model Fetter and Stephen (1968). However, the model in which conventional (metallic) single junctions are connected in series cannot be applied in intrinsic Josephson junctions especially in treating Josephson plasma excitations because the charge conservation inside a layer does not hold due to thinner CuO2 double layers (3 Å) than the charge screening length ( Å). Therefore, we consider that the previous treatment of the Josephson plasma resonance in a parallel magnetic field is insufficient and exclude the rich physics inherent to the intrinsic Josephson junctions.
In this paper, we report observation of two-phase collective modes through systematic measurements of microwave absorption as functions of magnetic fields parallel to the plane, temperature, and frequency in Bi2212 single crystals, and then the origins of the two modes are argued. The organization is as follows. Experimental results by using the microwave resonance technique described in Sec. II are presented in Sec. III. In this section, we first present the experimental data at 25.5 GHz, where the phenomena are the most interesting and the richest among all frequencies (Sec. III.1). Next, we show the experimental results at different frequencies and describe the frequency dependence in order to obtain a field dependence of the resonance modes (Sec. III.2). Finally, universal features deduced from the doping dependence are described (Sec. III.3). The origins of the observed two modes are discussed in Sec. IV with the help of recent theoretical models. Koshelev and Aranson (2001); Koshelev and Machida ; Koyama (2003)
II Experimental setup
In order to perform Josephson plasma experiments in the Josephson vortex state, it is necessary to have a wide range of microwave frequencies beyond the zero-field plasma frequency, which is expected above 100 GHz for optimally doped Bi2212. Since in our experimental facility the microwave frequencies were limited up to 90 GHz, it was necessary to bring down the zero-field Josephson plasma resonance in the range of 50 GHz. This was achieved by shifting the doping level to the underdoped region by annealing the pristine overdoped Bi2212 samples under reduced atmospheres.
We have measured microwave absorption in three Bi2212 single crystals grown by the modified traveling solvent floating zone (TSFZ) method. Two underdoped crystals (U1, U2) and one optimallydoped crystal (OP) were used in the measurements for the comparison. The superconducting transition temperatures ’s of these crystals were determined by low-field magnetization measurements with a superconducting quantum interference device (SQUID) magnetometer as 70.2, 76.8, and 90.5 K with superconducting transition widths of 1.0, 2.5, and 0.8 K for U1, U2, and OP, respectively. The typical size of the crystals is mm3.
Most of the microwave absorption data except for those in Sec. III.3 have been obtained in U1. Measurements were made in a frequency range between 9.8 and 75 GHz by both reflection- and transmission-type bridge balance techniques using rectangular cavity resonators with TE102 mode. In order to excite the Josephson plasma, the samples were placed inside the cavity in such a way that the oscillating electric field of the microwaves was exerted parallel to the axis over the plane of the crystal as shown in Fig. 1 of Ref. Kakeya et al. (1998). Frequency-stabilized microwaves were generated by the synthesized signal generator (Hewlett Packard 83650B) or Gunn oscillators, and the magnetic field was applied by a split-pair superconducting magnet. The angle between field direction and CuO2 plane of the sample was adjusted by rotating the cavity resonator with respect to the field direction by a precision rotator within an accuracy of 0.001 degree.
The resonance data were obtained either by sweeping the magnetic field at various fixed temperatures or by sweeping the temperature at various fixed fields. The resonance occurs when matches with the incident microwave frequency by varying either the magnetic field or temperature. It is worth noting that the field sweep (FS) measurements would give a non-equilibrium Josephson vortex state because the strong hysteretic behavior of the resonance was observed, especially at low temperatures while the magnetic field was swept up and down. In order to avoid this unnecessary complication, we employed measurements mostly by the temperature sweep (TS) when low-temperature data were needed. The temperature was either stabilized within 20 mK during the field sweep or swept at a rate of 2 K/min. It is also worth noting that since it is technically difficult to sweep microwave frequency as far as the cavity resonator method is employed, we are compelled to prepare a number of cavities (about 15 cavities) with different resonance frequencies.
III Experimental Results
III.1 Simultaneous observation of two resonance modes
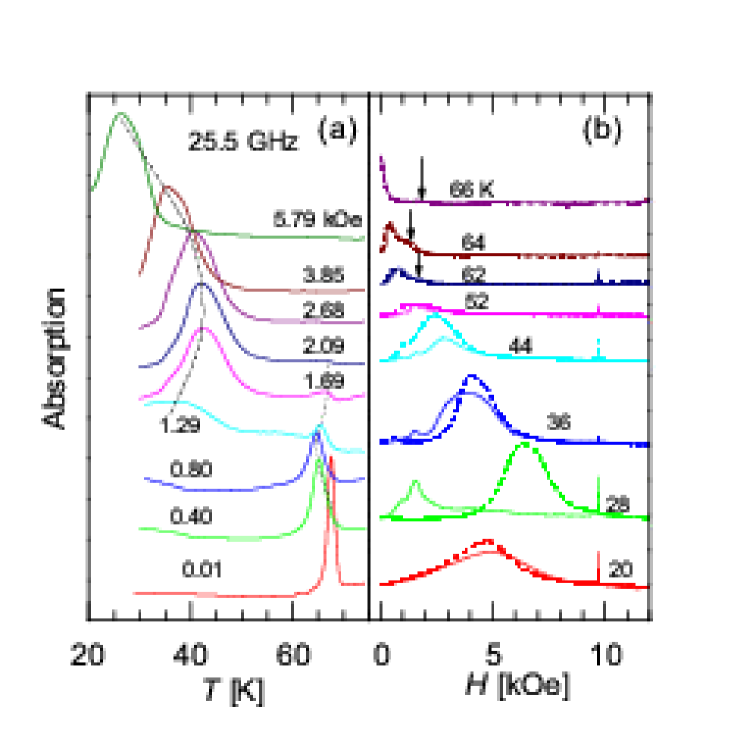
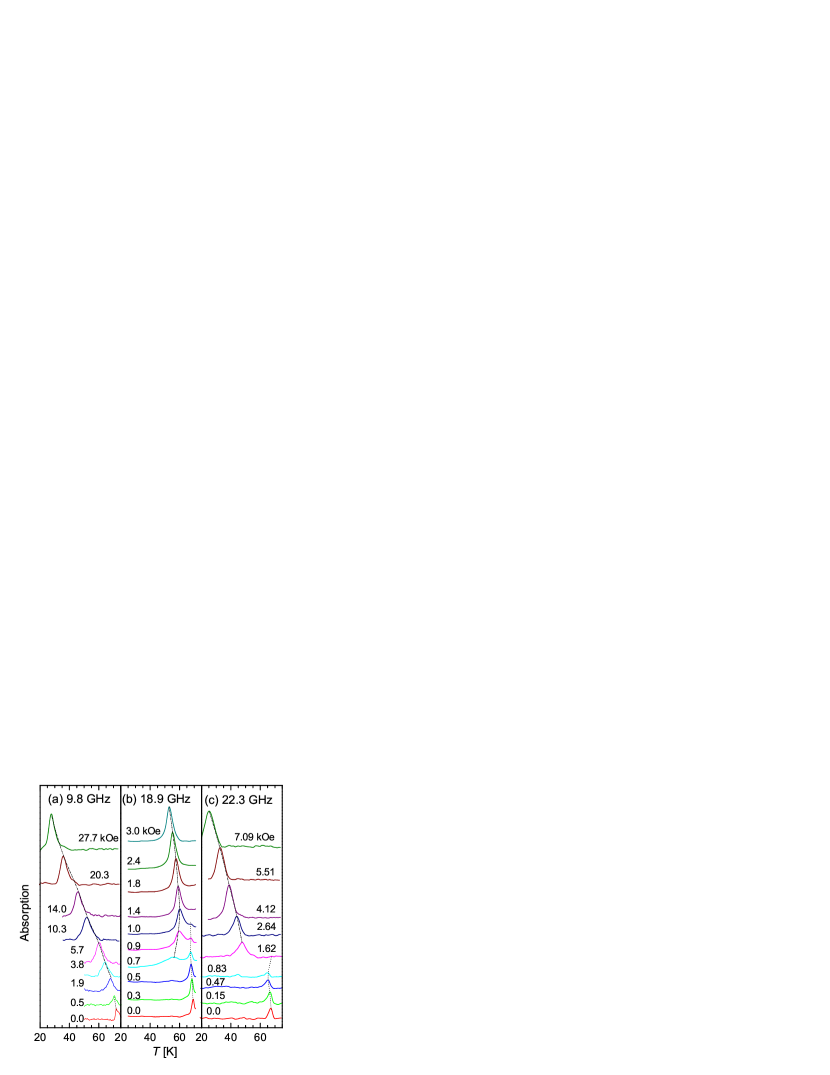
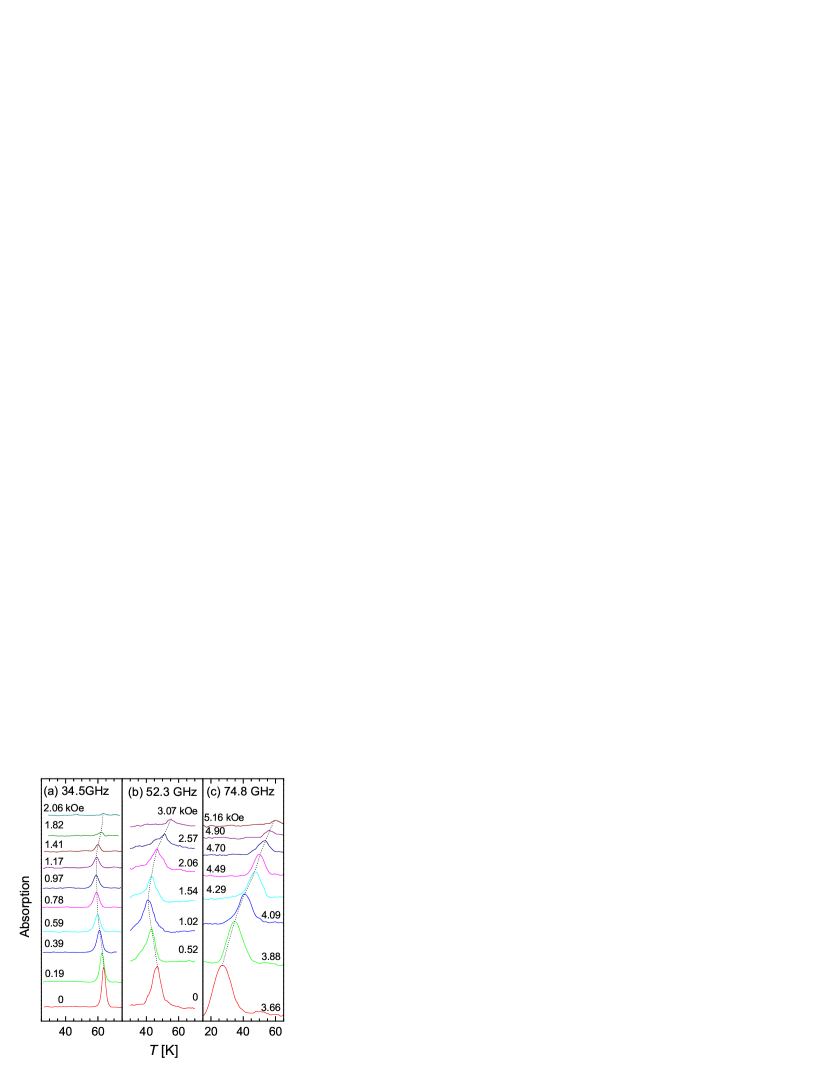
Figure 1(a) shows microwave absorption curves at 25.5 GHz in various constant parallel magnetic fields obtained by TS measurements. Two clear resonance lines with different characters are found at higher and lower temperatures. As is seen clearly, there is a well-separated temperature gap in-between. This feature strongly depends on the microwave frequencies: the higher in frequency the larger separation in temperature is observed. As will be shown later, the lower temperature mode (LTM) quickly shifts towards the low temperature side and disappears with increasing microwave frequency . On the other hand, with lowering frequency below 30 GHz the LTM quickly shifts up and merges with the higher temperature mode (HTM), which is explained in Fig. 2. In general, the HTM in this frequency region appears only in a relatively low field, approximately below 3 kOe, as long as is lower than 55 GHz, which is close to the zero-field and zero-temperature plasma frequency described later. When goes beyond 33 GHz, only one resonance is observed as shown in Fig. 3. In the frequency region between 10 and 30 GHz both resonances come into a play, resulting in a complicated phenomenon as a function of temperature as well as magnetic field.
Focusing on the HTM, it behaves in a very unusual manner as seen in Fig. 1(a), for example. In zero magnetic field a sharp resonance with a symmetric lineshape with respect to temperature was clearly observed. Since this resonance corresponds to the zero-field mode argued previously, the temperature dependence of the zero-filed plasma frequency can be described by the two-fluid model assuming the conventional Drude model. Kadowaki et al. (2000)
In a finite parallel magnetic field below approximately 1 kOe, HTM begins to shift slightly to lower temperatures. With further increase of the magnetic field, however, it turns to shift backward to higher temperatures at around 0.8 kOe as obviously seen in Fig. 1(a) [this behavior is more clearly displayed in Fig. 4 (b), where the data obtained at many frequencies measured are presented for the LTM]. The strong absorption intensity of this HTM in zero field quickly decreases as the field is applied. The linewidth in terms of temperature is wider in finite fields than in the zero field.
It has been well-established that is always suppressed by application of perpendicular magnetic fields, Kakeya et al. (2001)Shibauchi et al. (1999) because the Josephson current due to coherence effect between layers is a decreasing function of magnetic field. Koshelev (1996) This requires that in higher magnetic fields the resonance temperature must be lower in order to gain the fraction of Josephson current which is reduced by the perpendicular magnetic fields. It seems that this is not the case in the Josephson plasma resonance in parallel fields to the layers and this phenomenon certainly requires a new explanation.
Such an unusual turnover behavior just mentioned above cannot be explained either without making an unusual assumption that the phase coherence between layers would increase further with further increase of the parallel magnetic field approximately above 0.8 kOe or without introducing entirely new mechanisms for the Josephson plasma resonance in the parallel magnetic field. It is worth mentioning that this increasing tendency of the temperature dependence of toward higher temperatures seems never to go beyond in zero field, although it goes beyond the plasma resonance temperature in zero field at the frequency as seen in Fig. 4(b). It fades away quickly just below . This surprising result may allow us to speculate that the HTM is more stable in temperatures with the formation of the Josephson lattice state than without Josephson lattices. This unusual behavior has never been observed in the Josephson plasma resonance in perpendicular magnetic fields studied earlier and is certainly a new phenomenon only observable in parallel magnetic fields.
In parallel magnetic fields, consecutive occupation of the Josephson vortices in-between the CuO2 layers is expected to be realized along the axis as a function of increasing magnetic field, preserving an isosceles triangular symmetry according to the theoretical calculations. Hu and Tachiki (2000) This formation of Josephson vortex lattices would cause the oscillatory coherent Josephson current, which accordingly possesses the wave vector associated with the periodicity of the Josephson vortex, and would provide the resonance at even higher temperatures in a finite field than that in zero field according to the periodic Josephson vortex arrangement.
At the intermediate field region between 1.3 and 2.2 kOe both the HTM and LTM can be observed at the same magnetic field as seen in Fig. 1(a). For instance, the data at 1.69 kOe indicate the existence of both the HTM and LTM with 25.5 GHz at (1.69 kOe, 66.2 K) and (1.69 kOe, 43.0 K), respectively. This feature is observed only within a certain frequency region between 18 and 30 GHz, and only one resonance line can be found at the other frequencies. This observation of two resonance modes indicates a peculiarity in the the Josephson plasma resonance in unlike the one for , where only one resonance line as far as the longitudinal mode is concerned, was observed to monotonically decrease with both increasing temperature and magnetic field.
The resonance curves obtained by FS measurements are displayed in Fig. 1 (b). As the temperature is just below (= 70.2 K) a sharp resonance begins to appear ( 68 K) from the zero field limit. The resonance rapidly grows with decreasing temperature. As a few degrees Kelvin below , two resonance line can be distinguished: one at a lower field is stronger in intensity than the other one which lies at a higher fields and at the foot of the resonance of the stronger line (pointed by arrows). This two-resonance feature can only be found in 62 66 K, below which the resonance suddenly changes its character with broadening and with highly the hysteretic nature as seen in Fig. 1(b). The temperature range is wider at higher frequencies. For example, it extends to 14 K at 52.3 GHz, above which frequency the two resonance feature can no longer be observed.
As seen in Fig. 1(b) the absorption curves show a considerable hysteretic behavior for the field being swept up and down, especially below 45 K. This hysteretic feature is not appreciable at high temperatures above 60 K whereas it is most prominent in the intermediate temperature region between 10 and 45 K. It is noticed that there are several small resonancelike peaks at the lower-field side in addition to the main large resonance. However, this anomaly as well as even in the main peaks depends strongly on the field sweeping direction and the sweeping rate. Furthermore, it must be mentioned that some faint peaks are observed in-between the HTM and LTM in the FS mode [at 52 K in Fig. 1 (b), for example], where there is no resonance in the TS mode because of the gap between the HTM and LTM as seen in Fig. 1 (a). The peaks are, perhaps, non-resonant absorptions due to the non-equilibrium effect of the Josephson vortex state because the peak fields are almost equal to the fields where the LTM is observed at the highest temperatures. Therefore, we do not consider these faint peaks in the FS measurement hereafter.
III.2 Frequency Dependence
III.2.1 Low-frequency region ( 30 GHz)
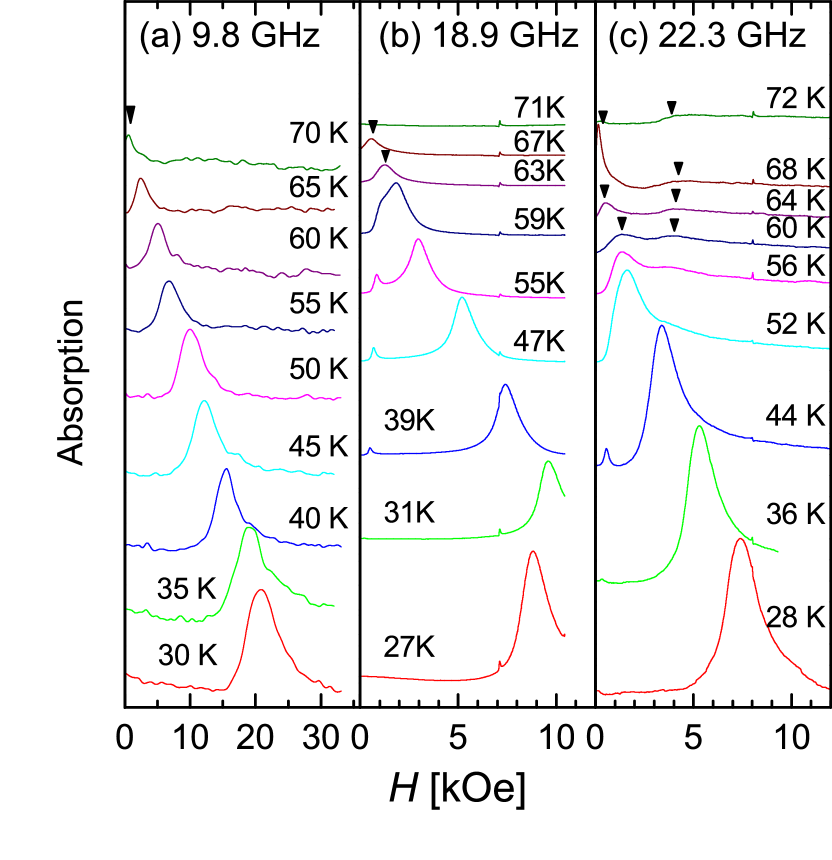
The typical resonance curves at 9.8, 18.9, and 22.3 GHz obtained by TS measurements are shown in Figs. 2(a), 2(b), and 2(c), respectively. At the lowest frequency of 9.8 GHz, only one resonance line is observed. The resonance line shape changes from asymmetric to symmetric with increasing field below 0.5 kOe, indicating a precursor effect of splitting into the HTM and LTM already at this frequency region. In sharp contrast to this, the resonance splitting is clearly observed at 18.9 GHz as shown in Fig. 2(b), where the LTM resonance and the HTM resonance appear below and above 64 K, respectively. The HTM resonance becomes weak in intensity and is quickly smeared with increasing field, and finally disappears at 1.0 kOe, while the LTM resonance appears from the low-temperature side above about 0.7 kOe, then shifts to the higher-temperature side, and then turns back to lower temperatures with increasing field with little change in the lineshape up to 3 kOe. The larger separation between the LTM and HTM resonances at higher frequencies indicates that the LTM has a different frequency dependence from the HTM. The integrated diagrams for most frequencies for both the LTM and HTM are shown in Fig. 4 by plotting the resonance temperatures as a function of field.
The resonance curves obtained in FS measurements for various temperatures at the same frequencies shown in Fig. 2 are shown in Fig. 5. All resonance peaks displayed here belong the LTM except for the ones indicated by the inverted triangles. The resonance peaks of the LTM in increasing field lie at a lower field than the ones in decreasing field, and the hysteresis observed in increasing and decreasing magnetic fields becomes more significant at lower temperatures and in lower fields. In comparison with the TS data, the resonance peaks obtained in the case of decreasing field coincide with the peaks in the TS measurements rather well, in which more homogeneous Josephson vortex state is expected to occur.
It is very unlikely that a complete lock-in vortex state is realized without any pancake vortices in the actual experimental condition, because the calculated angle to be allowed to form the lock-in state by taking into account of the sample geometry (the interlayer distance of 12 Åand the length of the sample of 0.8 mm) would be of the order of deg or less, which is much smaller than the experimental angular resolution. Furthermore, from the x-ray parallel-beam double-crystal method, it has been known that our sample used for the present experiment has a width of the rocking curve of the order of . This means that the crystallographic imperfectness of our sample, especially the parallelism of the CuO2 layers, gives an actual limitation to the measurements. Therefore, we think that the Josephson vortex state is always accompanied by some amount of the remaining pancake vortices. In such a situation the vortex crossing lattice state would be formed as first suggested by Koshelev, Koshelev (1999) where the interaction between Josephson vortices and pancake vortices may be attractive. Since the pancake vortices are pinned strongly at low temperatures as seen in the large hysteresis in magnetization, the Josephson vortex (JV) system would be compelled to be pinned by the pancake vortices through an attractive interaction. At the present stage of knowledge we do not know to what extent this pinning effect is important in the Josephson plasma phenomena except for the hysteretic effect while the magnetic field is swept.
However, it is important to note that the complete JV state can be established in a smaller sample with the dimensions less than in the plane. This is evidenced by the angular dependence measurement of the JV flow resistance which shows a sudden rise at an angle within one degree or so from the plane, depending strongly on the sample size and the intensity of the applied magnetic field. Kakeya et al. (2005)
III.2.2 High frequency region
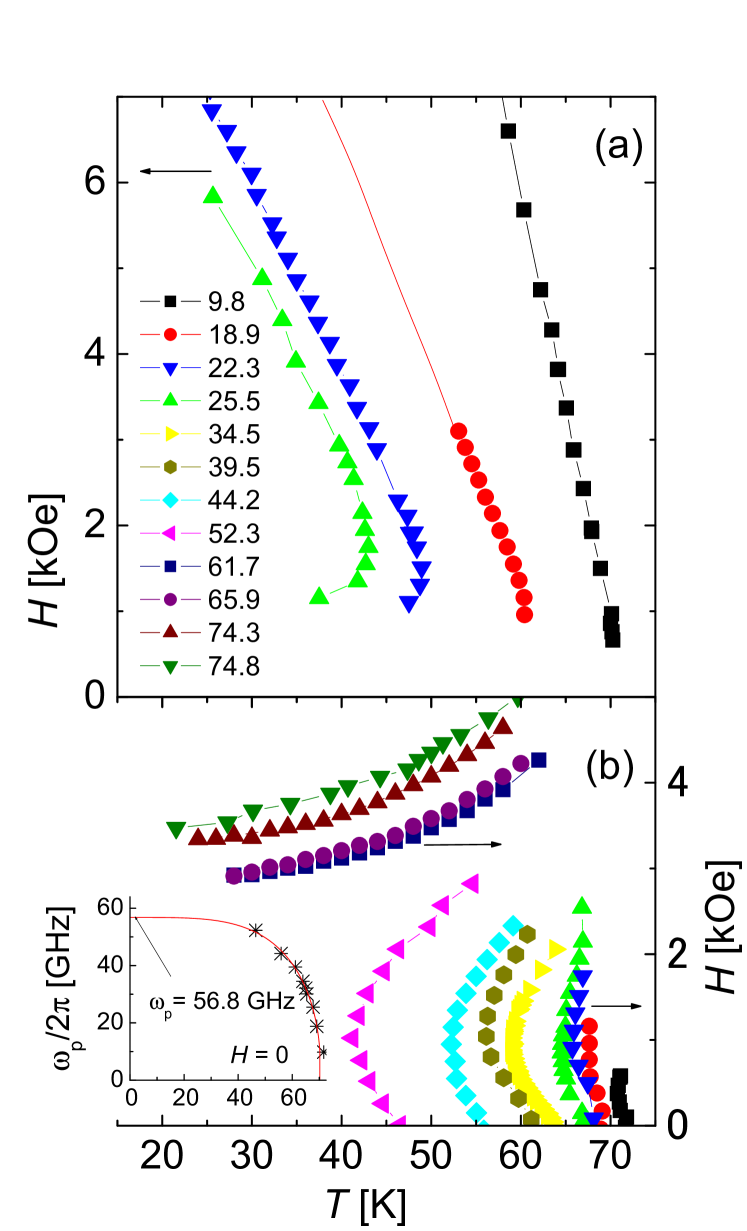
Figures 3(a), 3(b), and 3(c) depict resonance absorption curves at 34.5, 52.3, and 74.8 GHz, respectively, by TS measurements at various fixed magnetic fields. In this higher-frequency region, only the HTM is observed. As seen from Fig. 3, it is indispensable to note that the HTM at 34.5 and 52.3 GHz has zero field resonance, while it does not have zero field resonance at 74.8 GHz. This is because the HTM in the low-field region quickly shifts to the low temperature side and disappears above approximately 57 GHz. This can be seen more clearly in Fig. 4(b), where the HTM is shown in the plot. This zero-field resonance occurs only at a particular temperature at the corresponding . The dependence of has been reported previouslyKadowaki et al. (2000); Gaifullin et al. (1999) and is explained by using a simple two-fluid model with a temperature-independent scattering rate.Kadowaki et al. (2000) By extrapolating this temperature dependence of the plasma frequency to as shown in the inset of Fig. 4(b), the inherent (zero temperature) plasma frequency is estimated to be 56.8 GHz, which yields m with . This value of is quite reasonable for underdoped BSCCO with of 70.2 K and is used to quantify the field dependence of the HTM in the later sections.
In the frequency range below but near , the dramatic turnover behavior of the resonance temperature is observed as seen in Fig. 4(b). The Josephson plasma resonance at low fields below 1 kOe shifts to the lower temperature side and then turns back to higher temperatures above 1 kOe as the magnetic field is increased. A typical example is shown in the plot in the left panel of Fig. 6 in the case of GHz, where K and the shift in temperature amounts to about 3.5 K below at about 1 kOe, then the resonance peak sharply turns over toward the high-temperature side, and reaches to 59 K, which is even more than 3 K higher than . The intensity of the resonance becomes weaker and weaker with increasing magnetic field, and the resonance finally fades away. As the frequency is increased, the whole curves including moves towards low temperature as shown in the plot in Fig. 4(b). However, it is interesting to note that the disappearing temperature of the resonance after the turnover lies in the temperature region between 55 and 65 K even above the zero- field resonance temperature . This surprising behavior is very different from our understanding of the Josephson plasma resonance for , where the plasma frequency should decrease with application of a magnetic field and with increasing temperature as a result of the suppression of the interlayer coherence due to the fluctuation of pancake vortices as formulated in Eq. (1).
At frequencies above , there is no longer the resonance line at but only one resonance in a finite field in the HTM. As shown in Fig. 3(c), the resonance line can be observed only above about 3 kOe, and the resonance occurs at higher temperatures in higher magnetic field until reaching the limiting temperature of about 60 K around 5 kOe. This means that the excitation energy of the HTM becomes higher at higher temperatures. Since the superconducting phase coherence should become weaker and weaker at higher temperatures, this increasing excitation energy of the Josephson plasma in the HTM needs a new expression if it is enhanced further by overcoming the reducing temperature effect. As shown in Fig. 4(b), three more data sets obtained at different frequencies are included.
III.2.3 Overall features
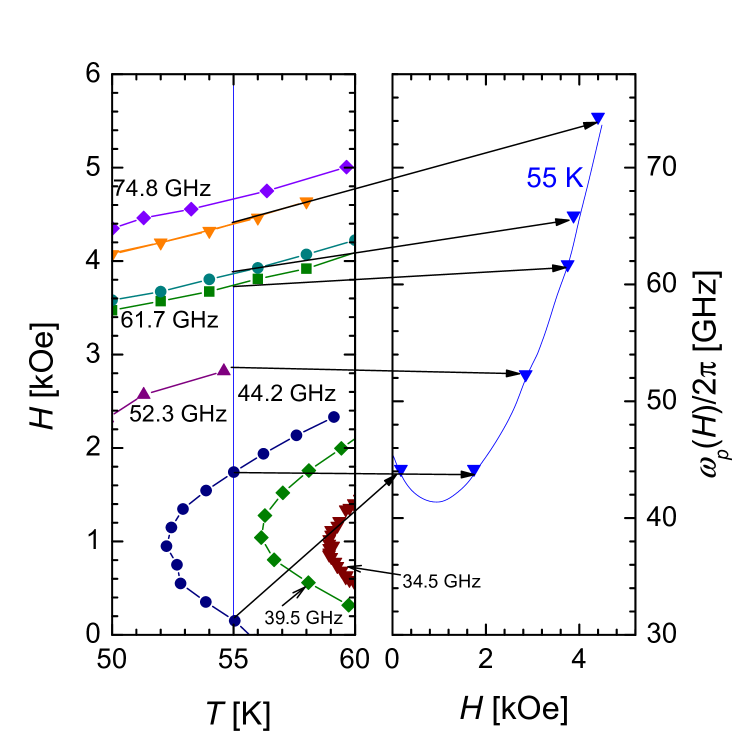
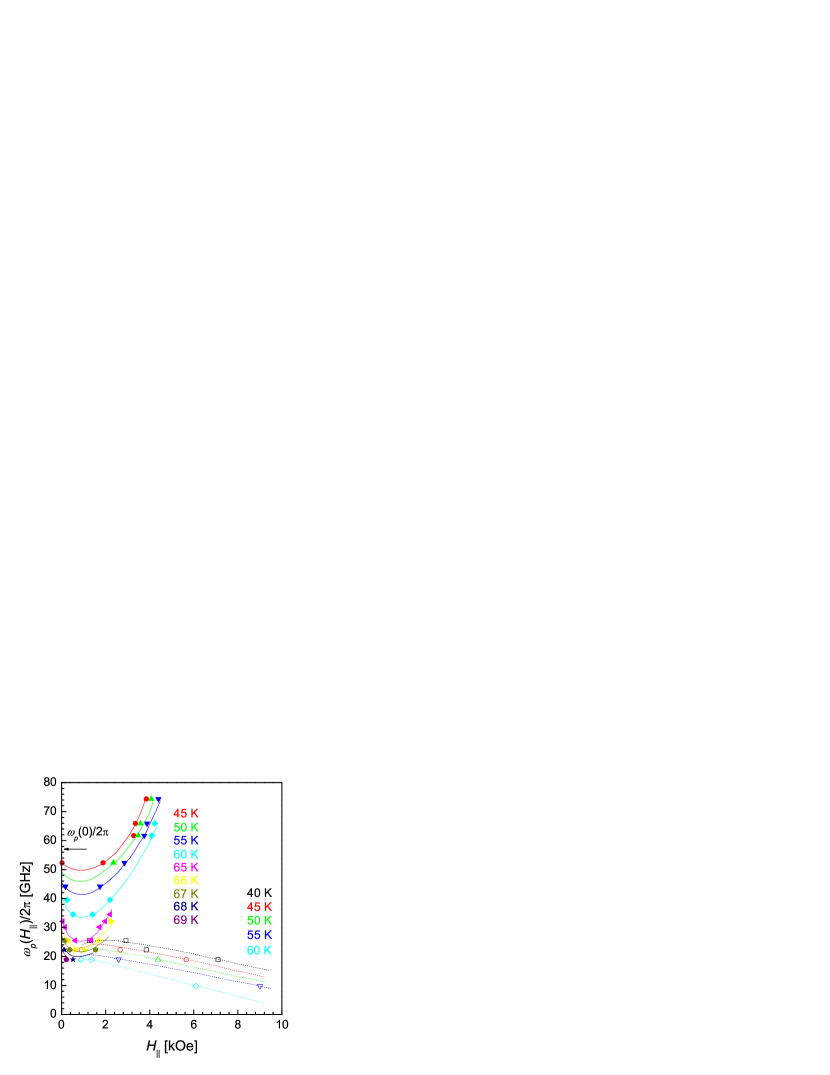
In order to construct the diagram, which is a direct indication of the effect on the excitation modes, the following procedure is applied: Since the most of experiments have been done in the TS mode at a fixed magnetic field at a certain and the diagram was constructed as shown in Fig. 4, one should convert this to the plot by taking the resonance points from corresponding at various temperatures as shown in Fig. 6. The resonance frequency is plotted as a function of magnetic field for nine different temperatures in Fig. 7. It is noted that the plots in Fig. 7 were extracted from resonance field versus temperature plots at all measured frequencies (partly not shown in Fig. 4) .
It is clear that there are two different type of resonance modes with very different field dependent characteristic features: one corresponds to the HTM, which starts with at zero field; then, the frequency grows monotonically and almost linearly after passing a shallow minimum in the vs diagram as the field is increased. On the contrary to this, the LTM shows a weak initial increasing behavior with increasing magnetic fields and then turns to the gradual decreasing behavior after passing a broad maximum. This LTM seems to be disappear at the zero-field limit.
As mentioned above, the HTM deviates from linear behavior and tends to have a minimum at 0.5 – 1.0 kOe, and then merges with the zero field Josephson plasma mode. Since this HTM is directly connected to the zero-field Josephson plasma mode, the HTM is confirmed to be the Josephson plasma mode in the Josephson vortex state in a parallel external magnetic field. It is noted that the initial decrease of is stronger at higher temperatures. On the other hand, the LTM exhibits a broad peak at around 1.5 kOe and then tends to decrease again with decreasing field. It is important to note that this LTM disappears at the limit of zero magnetic field. This experimental fact implies strongly that the existence of JV’s is crucial to the LTM.
III.3 Universality of Two Excitation Modes
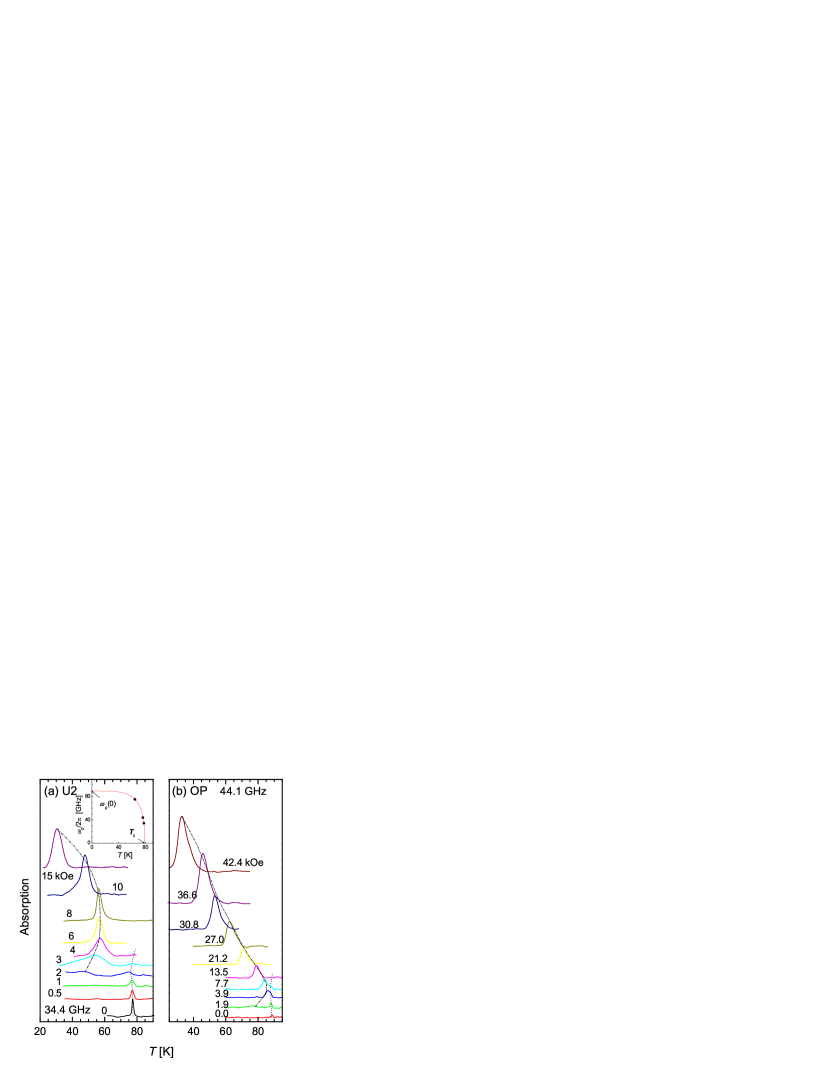
The microwave measurements have been performed in a similar manner in other crystals with higher doping levels (U2 and OP samples). The essential features described above were unchanged: the characteristic two modes HTM and LTM exist with qualitatively similar temperature as well as magnetic field dependencies. A typical example of the experimental data are shown in Figs. 9(a) and 9(b) for an underdoped U2 sample and for an optimally doped OP sample, respectively. Comparing these data with the data shown in Figs. 2 and 3, one can easily find that the separation between the HTM and LTM for U2 is smaller than that of U1 at a similar frequency. For example, the data in Fig. 9(a) (at 34.4 GHz) can be compared with the data in Fig. 3(a) (at 34.5 GHz) and are rather similar to the those obtained at 22.3 GHz shown in Fig. 2(c). Assuming that these two data sets obtained at 22.3 and 34.5 GHz provide the same ratio of to each sample, for U2 can be derived as 88.1 GHz. This estimated value of is consistent and agrees rather well with the value extrapolated by the temperature dependence of the zero-field Josephson plasma frequency as shown in the inset of Fig. 9(a), although the number of experimental points are only a few.
In the case of the OP sample, typical experimental data are shown in Fig. 9(b) at 44.1 GHz, where no clear splitting of HTM and LTM is observed. Applying the similar scaling in this case (for 18.9 GHz in U1), a value of GHz is derived. This value is close to the one obtained for an optimally doped Bi2212 single crystal. Gaifullin et al. (1999) Thus we suggest that the resonance splitting can be noticeably observed at and the magnitude of the -gap is larger for being closer to unity. In contrast, is much smaller than , and the LTM merges to HTM as observed at 9.8 GHz in U1, resulting in a single branch of the plot.
In previous studies, Matsuda et al. Matsuda et al. (1997) and Tsui et al. Tsui et al. (1997) have reported that the Josephson plasma resonance field has a sharp decrease near (). In particular, Matsuda et al. found the disappearance of resonance in an underdoped crystal ( K) through measurements of the angular dependence of the FS data and argued the existence of a collective mode of the Josephson vortex lattice which lies above the experimental microwave frequency ( GHz) at zero field and increases with parallel magnetic fields on the basis of a theory by Bulaevskii et al. Bulaevskii et al. (1997). Judging from our results, this vanishing of the resonance observed by Matsuda et al. can be interpreted differently because their sample is underdoped crystal and the measurement was done at 36 K. Their experimental conditions seem to be in the gap region between the HTM and LTM. Furthermore, according to their results the disappearance was not observed in an optimally doped crystal ( K). This also seems to be consistent with the systematics which we found here although they attributed it to the misalignment of the magnetic field. From an experimental point of view, no matter what the theoretical interpretation may be, the observed dramatic change of the Josephson plasma resonance near is strongly suggestive for the excitation of the new phase collective modes in intrinsic Josephson junctions.
IV Origin of excitation modes
IV.1 High Temperature Mode
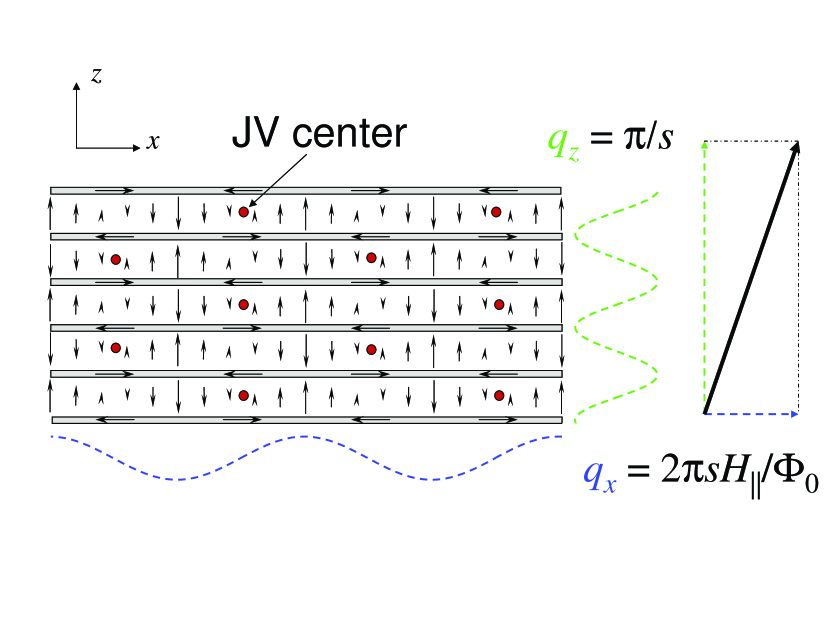
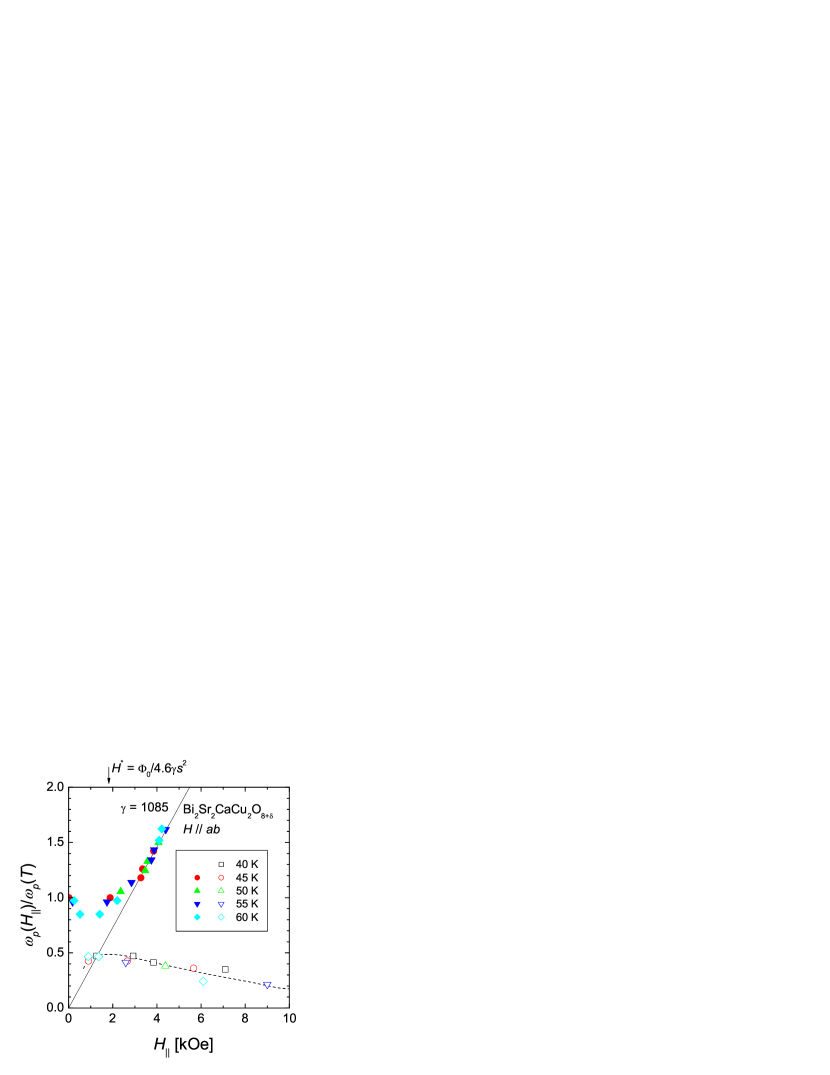
As discussed by Fetter and Stephen in single junctions, Fetter and Stephen (1968) propagating Josephson plasma waves are strongly modified by the JV’s, resulting in the Josephson plasma mode having a linear field dependence according to the linear increase of the reciprocal lattice vector of the JV array, , where is the flux quantum. This indicates that a periodic arrangement of JVs is crucial to have the propagating Josephson plasma mode. We first assume that JV’s penetrate all block layers and form isosceles triangular lattice with the lattice constants along the axis and the plane being and in high- region, respectively, as shown in Fig. 10, although for layered superconductors the argument has not been completely settled yet. A theoretical calculation by Ichioka Ichioka (1995) predicts that such a dense JV lattice can be realized above , which gives 1.8 kOe for obtained from m and Å. This value is rather in good agreement with the magnetic field, where the HTM begins to tend to the linear relation and the LTM has a broad maximum. Hence, it is reasonable to think that the HTM above may be the Josephson plasma resonance mode in the dense JV lattice.
Considering a Josephson plasma wave traveling in the isosceles triangular JV lattice, the vector of the Josephson plasma mode corresponds to the primitive reciprocal lattice vector of the JV lattice , which consists of the constant -axis component and the proportional -plane component , as depicted in Fig. 10. Here, and axes are taken parallel to the JV and axis, respectively, and is taken perpendicular to the and axes. Thus, Josephson plasma waves can be excited at all possible wave vectors as of the mixture of the longitudinal plasma with and the transverse plasma with . The plasma frequency is determined by the dispersion relation along lying between the longitudinal and transverse plasma modes and increases with magnetic field because of the linear increase in . It should be noted that the dispersion is very close to the longitudinal dispersion for .
Bulaevskii et al. have proposed a formulation of the plasma resonance in a layered superconductor on the basis of the single- junction model, Bulaevskii et al. (1997) and Koshelev and Machida have derived excitation spectra by considering the longitudinal coupling effect. Koshelev and Aranson (2001); Koshelev and Machida In the high field limit, where all block layers are occupied by JV’s forming an isosceles triangular lattice, the peak frequency of the dissipation spectrum, corresponding to the resonance peak, as a function of parallel magnetic field is formulated as
| (2) |
Using , this equation provides an excellent agreement with the experimental data above 3 kOe at all temperatures, as shown in Fig. 8. It is also consistent that the linear field dependence of the HTM is violated below . We therefore conclude that the linear increase in of the HTM is due to an increase in of the JV lattice, while is fixed on because of the intrinsic pinning. This result suggests that the excited plasma frequency can be easily controlled by adjusting the magnetic fields parallel to the layers even above .
IV.2 Low Temperature Mode
The LTM lies at and slightly decreases with as displayed in Fig. 8. The LTM in crystals with higher doping tends to appear at higher frequencies although the whole diagram has not been established yet. In under doped YBCO, a similar excitation mode was observed around with slight negative dependence and is referred to the mode Kojima et al. (2002). The mode cannot be observed after zero-field cooling, suggesting the considerable influence of pinning of the JV’s on the collective oscillation mode. This may also be the case in Bi2212 as shown in Fig. 1(b) and as well as in Fig. 5, where a large hysteretic effect is observed. Assuming that our LTM corresponds to their mode, the low-lying collective mode should strongly depend on , which is a material parameter and given by the strength of the Josephson coupling between CuO2 bilayers.
It is well known that the lowest collective mode of a Josephson vortex system is the vortex sliding mode with . Fetter and Stephen (1968) The sliding mode becomes gapless in an ideal system without pinning and couples with a dc homogenous electric field perpendicular to the superconducting layers. Since the pinning of Josephson vortices cannot completely be removed in actual samples, the lowest mode should have a nonzero frequency. In a junction with a periodic pinning for instance, the Josephson critical current depends periodically on . Bulaevskii et al. (1997)
Since the hysteresis obtained by the FS measurements indicates that the JV pinning strongly affects to the LTM, we once discussed the pinned vortex sliding scenario as a possible origin of the LTM. Kakeya et al. (2002) However, our finding that LTM tends to become higher in more highly doped samples with higher cannot be explained by this scenario, because it is not natural that the collective mode hardened by the pinning effect can be scaled by . Therefore, the vortex sliding model is not suited for and not likely for the origin of LTM in the framework of conventional knowledge, and needs for a new explanation.
In order to reveal the origin of the LTM, it is required to introduce an intrinsic stacking effect of intrinsic Josephson junctions because previous theoretical models giving the vortex sliding mode are based on the single junction model, where the correlation of the JV lattice along the axis is neglected. The vortex sliding mode in layered superconductors which we have in mind means coherent vortex motion parallel and perpendicular to the layers with . Here, we may consider a collective mode with but at a finite frequency. Considering an antiphase oscillation of JV arrays between adjacent junctions with and , for instance, the oscillation is a sharing motion between adjacent JV arrays as a result of dynamic phase oscillations not only between adjacent layers but also next-adjacent layers, so that the frequency of the oscillation can be considered to be scaled by because the interaction between JV’s in adjacent junctions is to be governed by the Josephson coupling as the first approximation.
Very recently, Koyama reported theoretical calculations on the Josephson plasma resonance in the JV lattice. Koyama (2003) After numerical calculations on analytically derived equations, a collective mode which lies about in the low-field limit and slightly decreases with increasing field was obtained. He argues that the collective mode is considered as an anti-phase oscillation mode of JV’s which originates from the strong charge coupling between junctions, and it is also responsible for the longitudinal Josephson plasma mode. This picture seems to be most appropriate as a candidate for the origin of the LTM although no direct experimental proof has been obtained.
For deeper understandings of the LTM, further theoretical and experimental investigations are needed in the low-frequency region. We think that an investigation of the JV flow branch in the current-voltage characteristics along the axis is a complementary experiment to elucidate the JV behavior in the layered superconductors in the low-frequency region.
V Conclusions
We have clearly identified two microwave excitation modes with a temperature-dependent gap in parallel magnetic fields in single crystal Bi2Sr2CaCu2O8+δ. It is shown that the strong coupling effect between the Josephson plasma and JV lattice is responsible for these two modes. The high frequency mode is attributed to the Josephson plasma mode propagating along the primitive reciprocal lattice vector of the JV lattice. Making use of this interplay, we may be able to explore electromagnetic waves in the frequency range between the superconducting gap and . The low frequency mode is attributed to the new collective mode which has never been observed before and seems to be unique for layered superconductors. It is considered that the Josephson vortex collective oscillation mode with finite contributes to the phase oscillations, although a quantitative full understanding has not been obtained.
Acknowledgements.
We would like to thank Drs. M. Machida, A. E. Koshelev, T. Koyama, H. Matsumoto, K. M. Kojima and N. F. Pedersen for their fruitful discussions and critical comments. This work has been supported by the Grant-in-Aid for Young Scientists (B), No. 14740201 at FY2002-2003, and 21st Century Center of Excellence (COE) Program at University of Tsukuba under MEXT, Japan.References
- Anderson (1964) P. W. Anderson, “Lectures on the Many-Body problem” (Academic Press, New York, 1964), vol. 2, p. 113.
- Dahm et al. (1968) A. J. Dahm, A. Denenstein, T. F. Finnegan, D. N. Langenberg, and D. J. Scalapino, Phys. Rev. Lett. 20, 859 (1968).
- Pedersen et al. (1972) N. F. Pedersen, T. F. Finnegan, and D. N. Langenberg, Phys. Rev. B 6, 4151 (1972).
- Kleiner et al. (1992) R. Kleiner, F. Steinmeyer, G. Kunkel, and P. Müller, Phys. Rev. Lett. 68, 2394 (1992).
- Kleiner and Müller (1994) R. Kleiner and P. Müller, Phys. Rev. B 49, 1327 (1994).
- Tachiki et al. (1994) M. Tachiki, T. Koyama, and S. Takahashi, Phys. Rev. B 50, 7065 (1994).
- Bulaevskii et al. (1995) L. N. Bulaevskii, M. P. Maley, and M. Tachiki, Phys. Rev. Lett. 74, 801 (1995).
- Koyama and Tachiki (1996) T. Koyama and M. Tachiki, Phys. Rev. B 54, 16183 (1996).
- Machida et al. (1999) M. Machida, T. Koyama, and M. Tachiki, Phys. Rev. Lett. 83, 4618 (1999).
- Pedersen and Sakai (1998) N. F. Pedersen and S. Sakai, Phys. Rev. B 58, 2820 (1998).
- Sakai and Pedersen (1999) S. Sakai and N. Pedersen, Phys. Rev. B 60, 9810 (1999).
- Machida and Sakai (2004) M. Machida and S. Sakai, Phys. Rev. B 70, 144520 (2004).
- Matsuda et al. (1995) Y. Matsuda, M. Gaifullin, K. Kumagai, K. Kadowaki, and T. Mochiku, Phys. Rev. Lett. 75, 4512 (1995).
- Kadowaki et al. (1997a) K. Kadowaki, I. Kakeya, M. Gaifullin, T. Mochiku, S. Takahashi, T. Koyama, and M. Tachiki, Phys. Rev. B 56, 5617 (1997a).
- Ohashi and Takada (1999) Y. Ohashi and S. Takada, Phys. Rev. B 59, 4404 (1999).
- Tamasaku et al. (1992) K. Tamasaku, Y. Nakamura, and S. Uchida, Phys. Rev. Lett. 69, 1455 (1992).
- Sakamoto et al. (1996) S. Sakamoto, A. Maeda, T. Hanaguri, Y. Kotaka, J. Shimoyama, K. Kishio, Y. Matsushita, M. Hasegawa, H. Takei, and R. Yoshizaki, Phys. Rev. B 53, 14749 (1996).
- Tajima et al. (1997) S. Tajima, J. Schützmann, S. Miyamoto, I. Terasaki, Y. Sato, and R. Hauff, Phys. Rev. B 55, 6051 (1997).
- Shibauchi et al. (1997) T. Shibauchi, M. Sato, A. Mashiro, T. Tamegai, H. Mori, S. Tajima, and S. Tanaka, Phys. Rev. B 55, 11977 (1997).
- Bulaevskii et al. (1996) L. N. Bulaevskii, V. L. Pokrovsky, and M. P. Maley, Phys. Rev. Lett. 76, 1719 (1996).
- Koshelev (1996) A. E. Koshelev, Phys. Rev. Lett. 77, 3901 (1996).
- Shibauchi et al. (1999) T. Shibauchi, T. Nakano, M. Sato, T. Kisu, N. Kameda, N. Okuda, S. Ooi, and T. Tamegai, Phys. Rev. Lett. 83, 1010 (1999).
- Kakeya et al. (2001) I. Kakeya, R. Nakamura, T. Wada, and K. Kadowaki, Physica C 362, 234 (2001).
- Koshelev et al. (2000) A. E. Koshelev, L. N. Bulaevskii, and M. P. Maley, Phys. Rev. B 62, 14403 (2000).
- Kadowaki et al. (1997b) K. Kadowaki, I. Kakeya, K. Kindo, S. Takahashi, T. Koyama, and M. Tachiki, Physica C 293, 130 (1997b).
- Lebwhol and Stephen (1967) P. Lebwhol and M. J. Stephen, Phys. Rev. 163, 376 (1967).
- Fetter and Stephen (1968) A. L. Fetter and M. J. Stephen, Phys. Rev. 168, 475 (1968).
- Eck et al. (1964) R. E. Eck, D. J. Scalapino, and B. N. Taylor, Phys. Rev. Lett. 13, 15 (1964).
- Fiske (1964) M. D. Fiske, Rev. Mod. Phys. 36, 221 (1964).
- Matsuda et al. (1997) Y. Matsuda, M. Gaifullin, K. Kumagai, K. Kadowaki, T. Mochiku, and K. Hirata, Phys. Rev. B 55, 8685 (1997).
- Tsui et al. (1997) O. K. C. Tsui, S. P. Bayrakci, N. Ong, K. Kishio, and S. Watauchi, Phys. Rev. B 56, 2948 (1997).
- Bulaevskii et al. (1997) L. N. Bulaevskii, M. Domínguez, M. P. Maley, and A. R. Bishop, Phys. Rev. B 55, 8482 (1997).
- Koshelev and Aranson (2001) A. E. Koshelev and I. Aranson, Phys. Rev. B 64, 174508 (2001).
- (34) A. E. Koshelev and M. Machida, private comminucations.
- Koyama (2003) T. Koyama, Phys. Rev. B 68, 224505 (2003).
- Kakeya et al. (1998) I. Kakeya, K. Kindo, K. Kadowaki, S. Takahashi, and T. Mochiku, Phys. Rev. B 57, 3108 (1998).
- Kadowaki et al. (2000) K. Kadowaki, I. Kakeya, T. Wakabayashi, R. Nakamura, and S. Takahashi, Int. J. Mod. Phys. B 14, 547 (2000).
- Hu and Tachiki (2000) X. Hu and M. Tachiki, Phys. Rev. Lett. 85, 2577 (2000).
- Koshelev (1999) A. E. Koshelev, Phys. Rev. Lett. 83, 187 (1999).
- Kakeya et al. (2005) I. Kakeya et al. (2005), cond-mat/0503498.
- Gaifullin et al. (1999) M. B. Gaifullin, Y. Matsuda, N. Chikumoto, J. Shimoyama, K. Kishio, and R. Yoshizaki, Phys. Rev. Lett. 83, 3928 (1999).
- Ichioka (1995) M. Ichioka, Phys. Rev. B 51, 9423 (1995).
- Kojima et al. (2002) K. M. Kojima, S. Uchida, Y. Fudamoto, and S. Tajima, Phys. Rev. Lett. 89, 247001 (2002).
- Kakeya et al. (2002) I. Kakeya, T. Wada, M. Machida, and K. Kadowaki, Physica C 378-381, 437 (2002).