A combined theoretical and experimental study of the low temperature properties of BaZrO3
Abstract
Low temperature properties of BaZrO3 are revealed by combining experimental techniques (X-ray diffraction, neutron scattering and dielectric measurements) with theoretical first-principles-based methods (total energy and linear response calculations within density functional theory, and effective Hamiltonian approaches incorporating/neglecting zero-point phonon vibrations). Unlike most of the perovskite systems, BaZrO3 does not undergo any (long-range-order) structural phase transition and thus remains cubic and paraelectric down to 2 K, even when neglecting zero-point phonon vibrations. On the other hand, these latter pure quantum effects lead to a negligible thermal dependency of the cubic lattice parameter below 40 K. They also affect the dielectricity of BaZrO3 by inducing an overall saturation of the real part of the dielectric response, for temperatures below K. Two fine structures in the real part, as well as in the imaginary part, of dielectric response are further observed around 50-65 K and 15 K, respectively. Microscopic origins (e.g., unavoidable defects and oxygen octahedra rotation occurring at a local scale) of such anomalies are suggested. Finally, possible reasons for the facts that some of these dielectric anomalies have not been previously reported in the better studied KTaO3 and SrTiO3 incipient ferroelectrics are also discussed.
pacs:
77.22.-d,77.22.Gm,61.50.-fI INTRODUCTION
BaZrO3 is a ceramic oxide of the perovskite family structure with a large lattice constant, high melting point, small thermal expansion coefficient, low dielectric loss and low thermal conductivity (see, e.g. Refs. BhallaAPL, ; Majeed1, ; Majeed2, ; Robertz, ; Lecerf, ; Taglieri, ; Celik, ; Koopman, ; Brzezinska, ; ChaiDavies, ; Erb, ; Kiyotaka, ; Davies, and references therein). These afore-mentioned properties make BaZrO3 (i) a very good candidate to be used as an inert crucible in crystal growth techniques Celik ; Erb , (ii) an excellent material for wireless communications BhallaAPL ; ChaiDavies and (iii) a very good substrate in thin film deposition BhallaAPL ; Majeed2 . BaZrO3 is also one of the two parent compounds of the (Pb-free and thus environmental-friendly) Ba(Zr,Ti)O3 solid solutions, which is promising for manufacturing high Q materials with a variety of applications in microwave industry Davies .
Interestingly, properties of BaZrO3 have been measured as long as 40 years ago, as well as very recently BhallaAPL ; Majeed1 ; Majeed2 , but only at room or higher temperature (to the best of our knowledge). Similarly, we are not aware of any calculation (either from phenomenological theory or first-principles calculations) predicting the dielectric properties of BaZrO3. As a result, low-temperature dielectric properties of BaZrO3 have never been investigated, despite the fact that many unusual effects are known to occur in some perovskite materials between 0 and 50 K. One drastic example of such effects is the (temperature-independent) plateau and large values of the real part of the dielectric response in KTaO3 and SrTiO3, which arise from the quantum-induced suppression of ferroelectricity in these materials. Other examples are the anomalous peaks observed around 10-50 K for the imaginary part of the dielectric response in KTaO3, K(Ta,Nb)O3, (Pb,La)TiO3:Cu Salce ; Bidault , SrTiO3 Bidault ; Viana , that are neither associated with structural phase transition nor do have a corresponding peak in the real part of the dielectric response (which conflicts with the well-established Kramers-Kronig relations Scaife ).
The aim of this article is to investigate the low-temperature behavior of BaZrO3 from measurements and first-principles-based simulations. We report several unusual features in the real and imaginary parts of the dielectric responses while no long-range ferroelectric, antiferroelectric or antiferrodistortive structural phase transition occurs in BaZrO3 down to 2 K. Discussions and similarities/differences between BaZrO3 and the (better-studied) KTaO3 and SrTiO3-related materials are also indicated to better understand the low-temperature dielectric anomalies reported in several perovskites.
This article is organized as follows. Sec. II describes the experimental and theoretical methods we used to investigate BaZrO3. Sec. III reports the measurements and predictions for structural and dielectric properties. Finally, Sections IV and V provide a discussion and conclusion, respectively.
| lattice constant | a0 | 7.91943 | Soft mode mass | 75.721 | |||
|---|---|---|---|---|---|---|---|
| Onsite | 0.0183 | 0.009733 | 0.01663 | ||||
| 0.00738 | 0.02311 | ||||||
| Intersite | 0.00262 | -0.00163 | 0.00120 | ||||
| 0.00049 | 0.00024 | ||||||
| Elastic | 4.794 | 0.755 | 1.416 | ||||
| Soft mode-elastic | -0.431 | 0.033 | -0.055 | ||||
| Dipole | 5.81 | 4.928 |
II METHODOLOGY
II.1 EXPERIMENTAL PROCEDURES
Powder samples of BaZrO3 were synthesized by solid state reaction by calcination at 1400K and sintering at 1600K starting from stoichiometric amounts of the corresponding oxides (BaCO3, ZrO2). The synthesized samples were well crystallized and no presence of parasitic phases was evidenced by X-ray diffraction (XRD) and chemical analysis. The temperature dependence of the dielectric constant was measured at various frequencies in a temperature range from 5 K to 300 K using a Hewlett-Packard 4192A impedance analyzer and a cryostat with an estimated precision of 0.1 K. These measurements were performed on ceramic samples which were polished and cleaned, and sputtered gold electrodes were applied. Samples were annealed at 800 K and slowly cooled in order to eliminate strains caused by polishing. Powdered samples were used for the diffraction experiments. X-ray-diffraction measurements were performed on a high accuracy, two-axis diffractometer in a Bragg-Brentano geometry using Cu-Kb wavelength issued from a 18-kW rotating anode generator, with diffraction angles precision better than 0.002 . The neutron powder diffraction patterns were collected at temperatures between 300 and 2 K on the 3T2 high resolution goniometer on a thermal source (1.227 ) using the Orph e reactor facilities at Laboratoire Léon Brillouin (Saclay, France). Structural Rietveld refinements on both X-ray and neutron patterns were carried out with the XND software.
II.2 THEORETICAL APPROACHES
In this study, two different (direct) first-principles codes, as well as a first-principles-derived technique, were used to obtain and/or extract various information. One of the two first-principles codes is denoted ABINIT ABINIT . We took advantage of its implementation of the linear response theory to compute the phonon dispersion curves of BaZrO3 at its low-temperature experimental lattice constant. Some technical details are as following. In this method we used Teter extended norm-conserving pseudopotentials Teter and the local-density approximation (LDA) Kohn . The exchange-correlation functional was approximated using Perdew-Zunger parametrization PZ of Ceperley-Alder data CA . The Ba , Ba , Ba , Zr , Zr , Zr , Zr , O , and O electrons are treated as valence electrons. A plane-wave cut off of 100 Ry was used to obtain convergence of the ground state total energy. Phonon frequencies were found to converge for dynamical matrices calculated on a 666 Monkhorst-Pack grid MP .
The second first-principles code used in our study is denoted CUSP CUSP . It also implements the LDA Kohn , and the Ceperley-Alder exchange and correlation CA as parameterized by Perdew and Zunger PZ . We also used the same valence electrons (indicated above) as in the ABINIT code. On the other hand, the pseudopotentials are those given by the Vanderbilt ultrasoft scheme USPP , and the plane-wave cutoff is chosen to be 25 Ry, which leads to converged results of physical properties of interest CUSP . The CUSP code is used to calculate the energetics of BaZrO3 that are associated with the rotation of the oxygen octahedra, at its low-temperature experimental lattice constant. It is also used to derive, at this specific lattice constant, the 18 parameters of the first-principles-based effective Hamiltonian () approach developed in Ref. ZhongDavid, . These parameters are given in Table I.
We also perform simulations using such technique (and its parameters) to go beyond the abilities of direct first-principles techniques, namely to investigate finite-temperature properties of large BaZrO3 supercells. The degrees of freedom of this Hamiltonian are the so-called local modes (that are directly proportional to the spontaneous electrical polarization), and the strain variables (that characterize the crystallographic phase). The total energy, Etot of Heff contains five different interactions between local modes and/or strains, namely, a local-mode self energy, a long-range dipole-dipole interaction, a short-range interaction between local modes, an elastic energy and an interaction between local-modes and strain ZhongDavid . Monte-Carlo (MC) simulations are performed using in two different schemes: classical Monte Carlo (CMC) Metropolis , which neglects zero-point phonon vibrations and, path-integral quantum Monte Carlo (PI-QMC) jorge ; ZhongPRB96 ; ceperley , which includes these quantum-mechanical zero-point motions. Consequently, comparison between the results of these two different Monte-Carlo techniques will allow the determination of quantum effects on structural and dielectric properties of BaZrO3. 121212 supercells (corresponding to 8,640 atoms) are used in all Monte-Carlo simulations. We typically perform 30,000 MC sweeps to thermalize the system and 70,000 more to compute averages, except at low temperatures in PI-QMC where more statistics is needed.
In PI-QMC, each 5-atom cell interacts with its images at neighboring imaginary times through a spring-like potential (representing the zero-point phonon vibrations as implemented in PI-QMC formulations), while all the 5-atom cells interact with each other at the same imaginary time through the internal potential associated with . The product , where is the simulated temperature and is the number of imaginary time slices, controls the accuracy of the PI-QMC calculation Cuccoli . In all our simulations we use =600, which we find leads to sufficiently converged results. Outputs of the PI-QMC simulations thus contain local-modes ui(t), where runs over the 5-atom unit cells of the studied supercell while the imaginary time t ranges between 1 and . (Note that t corresponds to CMC simulations.) Strain variables are another output of MC simulations.
III RESULTS
III.1 STRUCTURAL PROPERTIES
XRD and neutron scattering indicate that BaZrO3 is cubic (and thus paraelectric) down to 2 Kelvin (the minimal temperature accessed during our neutron scattering). Note that we are not aware of any previous measurement investigating the low-temperature, rather than high-temperature Majeed1 ; Majeed2 ; Fuenzalida , properties of BaZrO3.
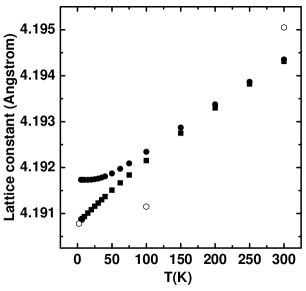
Our experimental result is consistent with the fact that we further find that our PI-QMC simulations using the effective Hamiltonian approach provide a vanishing supercell average of the local-modes down to 0 K and a resulting cubic ground-state. Interestingly, our CMC simulations also predict such paraelectric ground-state. This indicates that, unlike KTaO3 AliLaurent ; samara and SrTiO3 ZhongPRB96 ; Viana for which quantum effects suppress ferroelectricity in favor of paraelectricity, zero-point phonon vibrations do not affect the symmetry of the ground-state in BaZrO3. On the other hand, Fig. 1 – which displays the predicted and measured temperature evolutions of the cubic lattice constant of BaZrO3 – clearly shows, via the comparison of CMC and PI-QMC results, how zero-point phonon vibrations quantitatively affect structural properties of BaZrO3. Below 100 K, the zero-point phonon vibrations tend to prevent the lattice constant from decreasing when decreasing the temperature. Quantum effects thus increase the lattice constant with respect to classical predictions, with this increase becoming more pronounced as the temperature decreases. As a matter of fact, PI-QMC calculations result in (1) a dramatic change of thermal expansion below versus above 100 K, (2) a lattice constant that is nearly temperature-independent below 40 K, and (3) a lattice parameter that is larger by from its CMC result at the lowest temperatures. Note that item (1) is clearly confirmed by our neutron scattering data (reported in Fig. 1 for 300, 100 and 2 K) that shows a relatively rapid decrease of the lattice constant between 300 K and 100 K, while the difference in lattice parameters between 100 and 2 K is as small as . Furthermore, items (1) and (2) have also previously been observed in the incipient KTaO3 system SM (but for different critical temperatures). Moreover, item (3) provides a measure of the (relatively small) quantitative effects of zero-point phonon vibrations on the lattice parameter per se (rather than on the thermal expansion) of BaZrO3.
Fig. 1 also indicates that above 100 K, one can safely use the approximation that the cubic lattice parameter linearly depends on temperature with the thermal expansion coefficient being 0.27 (1/K), 0.23 (1/K) and 0.47 (1/K) for the CMC, PI-QMC and neutron scattering data, respectively. Our experimental value of 0.47 (1/K) compares rather well with the linear thermal expansion coefficient of 0.69 (1/K) previously measured by X-ray diffraction for temperature ranging between 273 and 873 K Zhao . On the other hand, the thermal expansion of 0.27 (1/K) and 0.23 (1/K) predicted by our simulations underestimate the experimental values by a ratio of . This discrepancy between simulations and the measurements arises from the fact that the effective Hamiltonian approach only incorporates the ferroelectric-related vibrations among the optical modes, while an accurate description of thermal expansion requires to take into account all phonon modes Tinte .
The effective Hamiltonian approach used in our study thus also neglects some phonon modes that may condense in BaZrO3, such as the R25 modes that are associated with the rotation of the oxygen octahedra ZhongDavidPRL . To check such possibility, we decided to compute the whole phonon dispersion of cubic BaZrO3, using the linear response theory as implemented in the first principles ABINIT code ABINIT . The results are shown in Fig. 2, and indeed confirm the previous ab-initio prediction ZhongDavidPRL of the condensation of the R-point zone-boundary mode.

(Note that these phonon calculations also confirm that BaZrO3 does not exhibit any ferroelectric instability at the point, even when quantum statistics are neglected). One has to realize, though, that the instability associated with these antiferrodistortive motions is rather weak, as demonstrated by the relatively small negative value of the frequency. This is further evidenced in Fig. 3, that displays the total

energy (as predicted by the first principles CUSP program CUSP ) versus the angle of the octahedra rotation about the [001] direction: the minimum energy (occurring for an angle about 4 ) is only 1.5 meV deeper than the energy of the paraelectric phase (associated with a zero angle). Such difference in energy corresponds to a rather small temperature of 17 K. It is thus highly possible that zero-point phonon vibrations prevent the occurrence (down to 2 K) of the macroscopic cubic paraelectric–to–antiferrodistortive phase transition, which would explain why our low-temperature XRD and neutron scattering experiments do not reveal any additional peak related to a doubling of the unit cell. This quantum-induced suppression may act either globally (i.e., different unit cells do exhibit some rotation of their oxygen octahedra, but these rotations are not long-range correlated) or locally (i.e., there is no rotation of the oxygen octahedra in any unit cell). We will come back to this point, and to this 17 K temperature, when discussing the results on dielectric properties.
III.2 REAL PART OF THE DIELECTRIC RESPONSE
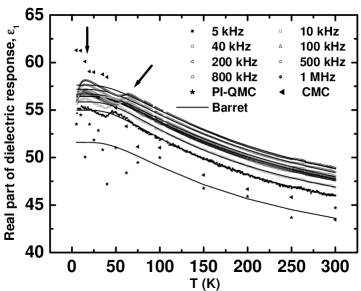
Fig. 4 shows our experimental determination of the real part of the dielectric response, , versus temperature for different frequencies.
| f[kHz] | 5 | 10 | 40 | 100 | 200 | 500 | 800 | 1000 | PI-QMC |
|---|---|---|---|---|---|---|---|---|---|
| C | 2900185 | 2900 170 | 3200200 | 3400240 | 3600280 | 4200370 | 4600440 | 4800480 | 2900 |
| Ts[K] | 812 | 802 | 802 | 802 | 802 | 773 | 763 | 753 | 81 |
| T0[K] | -9910 | -1029 | -11410 | -12412 | -13513 | -16017 | -17519 | -18220 | -11421 |
| B | 38.80.3 | 39.60.2 | 40.00.3 | 39.80.4 | 39.50.4 | 39.00.5 | 39.00.6 | 39.00.6 | 36.7 1.4 |
The real part of the dielectric response of BaZrO3 increases as the temperature decreases from 300 K for any given frequency. It then exhibits an overall low-temperature saturation to a plateau having a value that is slightly dependent on the frequency (ranging between 55 and 58 for frequency varying between 5 kHZ and 1 MHz). The existence of such plateau has already been reported in the incipient ferroelectrics KTaO3 AliLaurent ; samara and SrTiO3 ZhongPRB96 ; Viana , and is usually thought to be associated with zero-point phonon vibrations. To check this fact, we also report in Fig. 4 the predictions from the approach using both CMC and PI-QMC techniques. It is obvious that using CMC, the real part of the dielectric response continuously increases to higher value when the temperature decreases while on the other hand the dielectric constant computed within PI-QMC tends to saturate, in overall, at low-temperature footnote . Our simulations thus prove that quantum fluctuations play an important role on the low-temperature dielectric responses of BaZrO3, as in KTaO3 AliLaurent ; samara and SrTiO3 ZhongPRB96 ; Viana . However and as already mentioned in Section III.A, this quantum-induced modification of dielectricity in BaZrO3 is not accompanied by a suppression of ferroelectricity since BaZrO3 does not have any ferroelectric instability even in the classical regime – as indicated by the fact that our CMC simulations lead to a cubic paraelectric ground-state and a lack of peak in . This distinguishes BaZrO3 from both KTaO3 and SrTiO3. Figure 4 also reveals that our PI-QMC simulations yield predictions that are slightly smaller in magnitude than our experimental results. In fact, this has to be expected since (i) the measurements displayed in Fig. 4 demonstrate that decreasing frequency leads to a decrease of the dielectric response at any temperature and (ii) the calculations correspond to the static regime, i.e. to a zero frequency. We can thus conclude that the PI-QMC results are in overall quite accurate, especially when realizing that dielectric coefficients are related to the derivative of the polarization (i.e., they are much more difficult to predict than properties that are directly proportional to polarization) and that the magnitude of is rather small in BaZrO3 (e.g., the low-temperature plateau has a value that is smaller by 2-3 orders of magnitude than the corresponding ones in KTaO3 AliLaurent ; Salce ; SamaraBook and SrTiO KleemannQBarret ; Viana )
To further analyze our results, we fitted them using the Barret relation Barrett
| (1) |
where and are the so-called Curie constant and saturation temperature, respectively Barrett ; AliLaurent ; Ang . is interpreted as being the classical Curie temperature (that is, the Curie temperature if quantum effects would not exist) and is a constant independent of temperature. The resulting fits are indicated by means of solid lines in Fig. 4, and the coefficients of these fits are given in Table 2. In addition to the fact that the quality of these fits is in overall rather good (thus, confirming, as in KTaO3 and SrTiO3, the relevance of the empirical Barret relation for describing quantum effects on dielectricity of perovskites), four features are particularly worth noticing related to these fits. First of all, is (strongly) negative which confirms our theoretical findings that BaZrO3, unlike KTaO3 and SrTiO3, does not exhibit any ferroelectric instability even in the classical regime. Secondly, the Ts deduced from the experimental data is around 75-81 K, which is located in the temperature region for which PI-QMC predictions begin to significantly differ from CMC results for dielectric as well as structural properties (see Fig. 4 and Fig. 1). In other words, our simulations confirm the physical meaning usually associated with , that is the temperature below which quantum effects play a non-negligible role on physical properties Barrett ; AliLaurent ; Ang . Thirdly, and also unlike in KTaO3 Ang and SrTiO3 KleemannQBarret , the B parameter can not be neglected to get good fits in BaZrO3. This latter difference is due to the fact that the low-temperature plateau is much larger in KTaO3 (around 4000) AliLaurent ; Salce ; SamaraBook and SrTiO3 (around 20,000) KleemannQBarret ; Viana than in BaZrO3 (around 55, see Fig. 4), or equivalently that is positive in KTaO3 Ang ; AliLaurent and SrTiO3 KleemannQBarret while being negative in BaZrO3. Finally, two fine structures, existing in the experimental data, deviates from (and seem to be superimposed with respect to) the Barrett fit. More precisely, one hump appears in around 50 K at the lowest used frequency versus 65 K for the highest frequency, while a second hump shows up around 15 K for (more-or-less) any frequency. The magnitude of this second hump decreases when decreasing frequency. Note that these relatively small humps do not appear within our CMC simulations, and that the large fluctuations inherent to the PI-QMC approach Cuccoli do not allow us to assert if these humps are also predicted from our quantum simulations.
III.3 IMAGINARY PART OF THE DIELECTRIC RESPONSE AND DIELECTRIC LOSS
Fig 5 displays the imaginary part of the dielectric response, and the loss angle (as given by ) of BaZrO3 versus temperature for frequencies ranging between 10 kHz and 1 MHz.
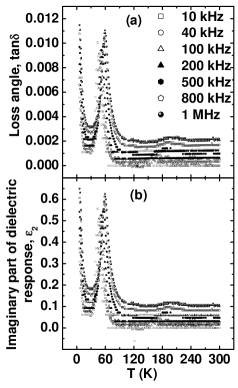
All the results displayed in Fig 5 are from measurements since simulating loss on an ab-initio level is one of the most interesting and difficult challenges that remain to be accomplished nowadays. One can first notice from Fig 5 that both and are very weak for the whole investigated frequency range, as also observed in Ba(Zn1/3Ta2/3)O3-BaZrO3 solid solutions Davies . BaZrO3 can thus be a material of choice to design high-Q compounds. Furthermore, our measurements show the existence of two loss anomalies, namely a peak in (and ) around 50-65 K and a continuously increasing (and ) when decreasing temperature below 25 K. These two anomalies are correlated with the humps seen in since they occur at similar temperatures and since they behave in a similar fashion. For instance, both the peaks in and , occurring around 50 K at low frequency, shift to higher temperature when increasing the frequency. Similarly, the anomalies observed in and at very low temperature get more pronounced at higher frequency. Interestingly, the well-known Kramers-Kronig relations Scaife imply that any peak/anomaly in should be accompanied with a peak/anomaly in (and vice-versa) at the same temperature. Such correlation is thus indeed satisfied in BaZrO3, but surprisingly, does not seem to hold for pure SrTiO and KTaO. More precisely, has been found to exhibit a peak in these two latter materials for a temperature around 30-50 K, but no corresponding peak has been seen in the real part of the dielectric response. One possible reason for this lack of observation in pure KTaO3 and pure SrTiO3 may be due to the fact that these two materials (unlike BaZrO3) have a large overall real part of the dielectric response Viana ; AliLaurent that “washes out” (i.e., prevents the observation of) weak superimposed peaks.
IV DISCUSSIONS
We believe that the enhancement in the real and imaginary parts of the dielectric responses occurring at temperature around 15 K is due to the activation of the oxygen octahedra rotation in BaZrO3. This belief is based on the fact that the minimum energy associated with antiferrodistortive motions is predicted to correspond to a temperature that is very close to the one at which these enhancements begin to occur, namely 17 K (see Fig. 3 and Sec. III.1). The zero-point phonon vibrations may annihilate the long-range order of such rotation down to 2 K, which would explain our X-ray diffraction and neutron scattering results. However, these quantum-induced effects likely can not prevent the octahedra rotation from occurring at a local scale (especially at very low temperature), which would be consistent with the fact that increases when decreasing the temperature below 25 K (see Fig 5).
Regarding the unusual dielectric features occurring around 50 K, it is important to realize that a frequency-dependent peak has previously been reported for and in several other perovskite systems (e.g., BaTiO3:La, SrTiO3:La, SrTiO3, SrTiO3:Ca, K(Ta,Nb)O3, (Pb,La)TiO3:Cu, KTaO3) near a similar temperature (see, e.g. Refs Bidault, ; Viana, ; samara, ; Salce, and references therein). For instance, peaks around 40 K for low frequency in KTaO3 samara ; Salce . It is commonly believed that the reasons behind these peaks is the existence of unavoidable impurity ions having a different valence than the host atoms (see Refs. SamaraFerro04, ; Laguta, and reference therein). In such a case, these peaks should become more pronounced when intentionally doping the sample with impurities, as consistent with the fact that adding up to 3% of Mn2+ in KTaO3 leads to a noticeable peak in the real part of the dielectric response around 40 K SamaraFerro04 . Observing and understanding the effects of doping on physical properties of BaZrO3 is thus of importance to confirm this (general) possibility, but goes beyond the scope of the present article. One particular previous study Bidault further stipulates that it is a polaronic relaxation – that is, a coupling between the free charge carriers arising from the impurity ions and the lattice properties of the host material – that causes such weak dielectric anomalies. As done in Ref. Bidault, , such possibility can be checked by extracting the temperature-dependency and frequency-dependency of relaxation time via an analysis of loss dynamics using, e.g, Cole-Cole formula loss Scaife . Such analysis, to be accurate, requires the investigation of and under a range of frequency that is much wider than the one available for the present study.
V CONCLUSIONS
In summary, we combined measurements with first-principles-based techniques to investigate the low-temperature properties of BaZrO3. This system is found to be cubic and macroscopically paraelectric down to 2 K. Unlike the “better-studied” KTaO3 AliLaurent ; SamaraBook and SrTiO3 ZhongPRB96 ; Viana incipient ferroelectrics, the zero-point phonon vibrations do not suppress ferroelectricity in BaZrO3. In other words, this latter material is also paraelectric in the classical regime. On the other hand, quantum effects lead to the saturation of the cubic lattice parameter below 40 K.
Despite having no long-range-order structural phase transition, BaZrO3 exhibits the following striking dielectric features: (1) the real part of the dielectric response saturates in overall at low temperature (namely, below 40 K) to a value 55. Our PI-QMC simulations are in rather good agreement with experimental data, and show that such saturation is caused by zero-point phonon vibrations; (2) the temperature behavior of can be well fitted by the empirical Barrett relation when allowing the parameter to differ from zero in this fit; (3) two peaks or fine structures are observed in around 50-65 K and 15 K, respectively. The first peak shifts to lower temperatures when decreasing the frequency, while the second one occurs at around the same temperature but decreases in magnitude when decreasing the frequency; (4) these two fine structures are associated with anomalies in the imaginary part of the dielectric response, , which peaks at around 50-65 K while suddenly and continuously increases when decreasing temperature below 15 K.
By comparing with previously reported data in other perovskites and adopting some related interpretations, we propose that the highest-temperature dielectric anomalies are caused by defects like oxygen vacancies and/or unavoidable impurity ions such as Fe3+ — which, e.g., are the source of free charge carriers, that can interact with a soft lattice to create a polaronic state responsible for the dielectric anomaly Bidault . Furthermore, our (direct) first-principles calculations suggest that the lowest-temperature dielectric anomalies may result from local rotation of the oxygen octahedra.
In order to acquire a deeper knowledge of perovskites, it is interesting to compare items (1-4) with corresponding features in KTaO3 and SrTiO3. For instance, also saturates at low temperature in KTaO3 and SrTiO3, but with a much higher value of the plateau (as a result of the quantum-induced suppression of ferroelectricity in these latter compounds). Such high value of the plateau explains why the coefficient is generally omitted in the Barrett fit of KTaO3 and SrTiO3. It is also highly plausible, as we believe it, that such high prevents the observation of the hump that should be associated (according to the Kramers-Kronig relation Scaife ) with the peak of seen around 30-50 K in KTaO3 Bidault ; Salce and SrTiO3 Bidault ; Viana .
We hope that our work stimulates further investigations aimed at checking our suggestions, in particular, and understanding dielectric anomalies in perovskites, in general.
ACKNOWLEDGMENTS
The authors would like to thank Jorge Íñiguez and David Vanderbilt for providing the code for PI-QMC simulations. This work is supported by ONR grants N 00014-01-1-0365 (CPD), N00014-97-1-0048, N00014-04-1-0413 and 00014-01-1-0600, by NSF grants DMR-0404335 and DMR-9983678 and by DOE grant DE-FG02-05ER46188.
References
- (1) P. S. Dobal, A. Dixit, R. S. Katiyar, Z. Yu, R. Guo and A. S. Bhalla, J. Appl. Phys. 89, 8085 (2001).
- (2) Abdul-Majeed Azad and S. Subramaniam, Materials Research Bulletin 37, 85 (2002); Materials Research Bulletin 37, 11 (2002).
- (3) Abdul-Majeed Azad, S.Subramaniam and T. W. Dung, Journal of Alloys and compounds 334, 118 (2002).
- (4) B. Robertz, F. Boschini, R. Cloots and A. Rulmont, International Journal of Inorganic Materials 3, 1185 (2001).
- (5) N. Lecerf, S. Mathur, H. Shen, M. Veith and S. Hüfner, Scripta Mater. 44, 2157 (2001).
- (6) G. Taglieri, M. Tersigni, P. L. Villa and C. Mondelli, International Journal of Inorganic Materials 1, 103 (1999).
- (7) E. Celik, Y. Akin, I. H. Mutlu, W. Sigmund and Y. S. Hascicek, Physica C 382, 355 (2002).
- (8) M. Koopman, S. Duncan, K. K. Chawla and C. Coffin, Composites: part A 32 1039 (2001).
- (9) J. Brzezińska-Miecznik, K. Haberko and M. M. Bucko, Materials Letters 56, 273 (2002).
- (10) L. Chai, M. A. Akbas, P. K. Davies and J. B. Parise, Matreials Research Bulletin 32, 1261 (1997).
- (11) A. Erb, E. Walker and R. Flükiger, Physica C 245, 245 (1995).
- (12) K. Tanaka, K. Suzuki, D. Fu. K. Nishizawa, T. Miki and K. Kato, Key Engineering Materials 269, 57 (2004).
- (13) P. K. Davies, in Proceedings of the Symposium on Materials and Preocessing for Wireless Communications ed. T. Negas, J. Am. Ceram. Soc. 53 137, (1994).
- (14) B. Salce, J. L. Gravil and L. A. Boatner, J. Phys: Condens. Matter 6, 4077 (1994).
- (15) O. Bidault, M. Maglione, M. Actis, M. Kchikech, and B. Salce, Phys. Rev. B 52, 4191 (1995).
- (16) R. Viana, P. Lunkenheimer, J. Hemberger, R. Böhmer, and A. Loidl, Phys. Rev. B 50, 601(R) (1994).
- (17) B. K. P. Scaife, Principles of Dielectrics, Clarendon Press, Oxford (1989).
- (18) The ABINIT code is a common project of the Universite Catholique de Louvain, Corning, InC., and other contributors (URL http://www.abinit.org)
- (19) M. Teter, Phys. Rev. B 48, 5031 (1993).
- (20) P. Hohenberg and W. Kohn, Phys. Rev. 136, B864 (1964);W. Kohn and L.J. Sham, ibid. 140, A1133 (1965).
- (21) J. Perdew and A. Zunger, Phys. Rev. B 23, 5048 (1981);
- (22) D.M. Ceperley and B.J. Alder, Phys. Rev. Lett. 45, 566 (1980).
- (23) H.J. Monkhorst and J.D. Pack, Phys. Rev. B 13, 5188 (1976).
- (24) R.D. King-Smith and D. Vanderbilt, Phys. Rev. B 47, 1651 (1993).
- (25) D. Vanderbilt, Phys. Rev. B 41, 7892 (1990).
- (26) W. Zhong, D. Vanderbilt and K. M. Rabe, Phys. Rev. Lett. 73, 1861 (1994); Phys. Rev. B 52, 6301 (1995).
- (27) N. Metropolis, A. W. Rosenbluth, M. N. Rosenbluth, A. H. Teller and E. Teller, J. Chem. Phys. 21, 1087 (1953).
- (28) J. Íñiguez and D. Vanderbilt, Phys. Rev. Lett. 89, 115503-1 (2002).
- (29) W. Zhong and David Vanderbilt, Phys. Rev. B 53, 5047 (1996).
- (30) D. M. Ceperley, Rev. Mod. Phys. 67, 279 (1995).
- (31) A. Cuccoli, A. Macchi, G. Pedrolli, V. Tognetti, and R. Vaia, Phys. Rev. B 51, 12369 (1995).
- (32) V. M. Fuenzalida and M. E. Pilleux, J. Mater. Res., 10, 2749 (1996)
- (33) A. R. Akbarzadeh, L. Bellaiche, K. Leung, J. Ińiguez and David Vanderbilt, Phys. Rev. B 70, 054103 (2004).
- (34) G. A. Samara, J. Phys. Condens. Matter 15, R367 (2003).
- (35) G. Samara, and B. Morosin, Phys. Rev. B 8, 1256 (1973).
- (36) Y. Zhao and D. J. Weidner, Phys. Chem. Mineral, 18, 294 (1991).
- (37) S. Tinte, J. Íñiguez, K. M. Rabe and D. Vanderbilt, Phys. Rev. B 67, 064106 (2003).
- (38) W. Zhong and David Vanderbilt, Phys. Rev. Lett. 74, 2587 (1995).
- (39) Dielectric constants at different temperatures are typically calculated using the correlation function method. However, for some temperatures and in order to get better statistics and smoother curves, we also used the difference between polarization under different electric field to extract the dielectric constant. These two kinds of methods provide similar results. For instance, in PI-QMC at T=75 K correlation function yield a value of 48.75 for dielectric constant while on the other hand finite difference method lead to 49.48 when the electric field along either of x, y or z directions is gradually increased from zero to 5106 V/m.
- (40) G. Samara, in Solid State Physics, ed. H. Ehrenreich and F. Spaepen, Academic Press 56, 239 (2001).
- (41) J. Dec and W. Kleemann, Solid State Commun. 106, 695 (1998).
- (42) J. H. Barrett, Phys. Rev. 86, 118 (1952).
- (43) C. Ang, A.S. Bhalla and L.E. Cross, Phys. Rev. B 64, 184104 (2001).
- (44) G. A. Samara and, L. Venturini, in First-Principles Calculations for Ferroelectrics: Fifth Williamsburg Workshop, R. E. Cohen, and P. Gehring ed. (IOP, Journal of Physics: Condensed Matter, 2004),p. 122.
- (45) V. V. Laguta, M. D. Glinchuk, I. P. Bykov, J. Rosa, L. Jastrabík, M. Savinov and, Z. Trybula, Phys. Rev. B 61, 3897 (2000).