Influence of Homeotropic Anchoring Walls upon Nematic and Smectic Phases
Abstract
McMillan liquid crystal model sandwiched between strong homeotropic anchoring walls is studied. Phase transitions between isotropic, nematic, and smectic A phases are investigated for wide ranges of an interaction parameter and of the system thickness. It is confirmed that the anchoring walls induce an increase in transition temperatures, dissappearance of phase transitions, and an appearance of non-spontaneous nematic phase. The similarity between influence of anchoring walls and that of external fields is discussed.
1 Introduction
Liquid crystals are very sensitive to conditions of boundary surfaces. The anchoring conditions at the boundary walls strongly influence the liquid crystalline orderings if the systems are thin enough. The isotropic(I)-nematic(N) phase transition is easily affected by the anchoring walls since the discontinuity at the I-N phase transition is small. It is known that a thin nematogen system sandwiched between homeotropic anchoring walls exhibits the I-N transition at higher temperature than the I-N transition temperature of the system without boundary anchoring [1, 3, 2]. As the system becomes thin, the discontinuity at the I-N transition decreases; eventually the I-N transition vanishes if the system is thinner than a critical thickness [1]. It is also shown theoretically that, even if the system exhibits I-smectic A(A) phase transition in bulk systems(i.e., in the absence of the walls), the homeotropic anchoring walls can induce a surface N phase [4]; such a N phase is called a non-spontaneous N phase. Corresponding to this result, strong N order induced near the anchoring walls has found in decylcyanobiphenyl (10CB), which exhibits direct I-A transition in bulk systems [5]. The fact that such a wall-induced N order has not found in undecylcyanobiphenyl (11CB) and dodecylcyanobiphenyl (12CB) indicates that 10CB has stronger tendency to exhibit the N phase than others. Such a tendency is to be expected since the 10CB is the shortest molecule among the homologous series of cyanobiphenyl CB exhibiting direct I-A transition in bulk systems.
Although studies on a homologous series would provide a unified understanding of the phase behavior, there are no theoretical studies on the influence of anchoring walls upon members of homologous series. In the present paper, we investigate such influence in systematic way; in order to do so, we use a so-called McMillan model sandwiched between strong homeotropic anchoring walls. The McMillan model can mimic several materials of a homologous series by choosing a parameter , contained in the model; depending on the , the McMillan model exhibits three phases (I, N and A) or two phases (I and A). We report the influence of the anchoring walls, i.e., the changes in phase transition temperatures, the critical thicknesses and their dependence on , and the non-spontaneous N phase induced by anchoring walls. In the last section, we will discuss the similarity between the influence of anchoring walls and of the external fields on the McMillan model.
2 Discrete McMillan Model
Self-consistent equations for the discrete McMillan model in inhomogeneous systems have been derived in ref. \citenTorikai2004, as a generalization of the original McMillan model [7]. Thus in this section we will shortly give definitions and formulae.
The N and A phase order parameters are functions of the distance from one of walls in this system. We divide the system into layers parallel to the walls and assume the order parameters within each layer are constant. Let the number of layers be , and zeroth and -th layers be in contact with walls. In the discrete McMillan model, the number of layers can be interpreted as the system thickness. The N order parameter and A order parameter of -th () layer are, by assuming that the -axis is parallel to the director, defined as
| (1a) | ||||
| (1b) | ||||
where ; and are the polar angle and -coordinate of a molecule, respectively. The brackets denote the thermal average over molecules in -th layer.
We take into account only the molecular fields produced by neighboring molecules. Then the one-particle potential for a molecule in the -th layer is
| (2) |
where and are molecular fields of the -th layer; and are molecular fields of neighboring layers, that vanish in homogeneous systems. The parameter is an interaction strength for A phase; can be assumed to be an increasing function of the molecular length [7]. Using the discrete McMillan model potential (2), we obtain the self-consistent equations:
| (3a) | ||||
| (3b) | ||||
where functions and are defined as
| (4a) | |||
| (4b) | |||
where
| (5) |
3 Results
For later discussions, it is suitable here to refer to the phase diagram of the McMillan model without boundaries [7]. This model exhibits some different behaviors depending on the value of . For , A phase directly melts into I phase; this transition is first-order. The N phase appears as an intermediate phase between I and A phases for . The I-N transition temperature for is (in units of ), which does not depend on ; the triple point of I, N and A phase is thus and . The I-N phase transition is first-order for any , while the N-A phase transition is first-order for and second-order for ; i.e., there is a tricritical point on the N-A coexisting line (at and ).
In the presence of walls or fields, the N order is induced even if the temperature is high; such a high temperature phase with finite N order is called a para-nematic phase. However, for simplicity, we do not use the term para-nematic but use the terms of systems without walls and fields; we call the high temperature phase I phase, the low temperature phase A phase, and the intermediate phase N phase, if it exists.
In this work, we assume the homeotropic anchoring condition, i.e., the director is perpendicular to the walls. In addition, we assume that the anchoring is so strong that the order parameters at the walls are extremely large. Thus we will solve the self-consistent equations under the boundary conditions . Furthermore, we also assume that the strong A ordering is induced at the walls, i.e., . We set the potential parameters and .
A typical behavior of order parameters of layers is shown in fig. 1 for a system of and thickness .
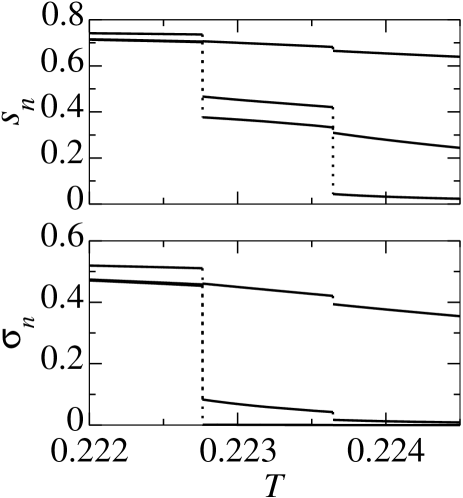
In our calculations, as shown in fig. 1, all the layers undergo each phase transition at the same temperature, i.e., the transition temperatures do not depend on the distance from the walls. Thus in order to find each transition temperature we can use averaged order parameters, and , over the whole system. The transition at the same temperature throughout the system is possibly a characteristic of systems under the complete wetting (by ordered phase) condition at the boundaries. In nematic liquid crystals, the phase transition of the whole system at the same temperature has observed in systems under complete wetting condition [1]; while under the incomplete wetting condition these systems undergo the “boundary-layer phase transition” that occurs at a temperature higher than the bulk transition temperature [8].
Figures 2 show the temperature dependence of order parameters and for .
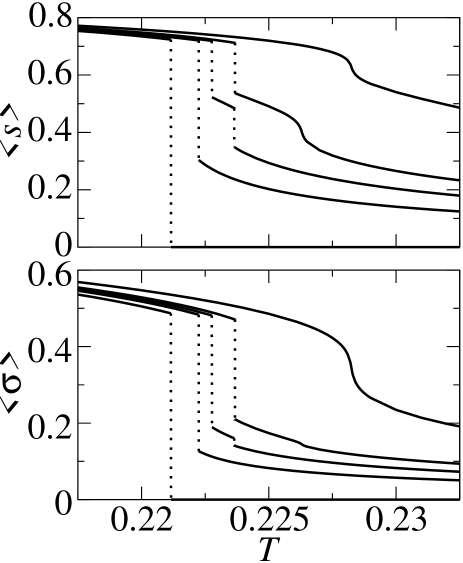
These figures clearly exhibit three important features: the increase in the transition temperatures, the existence of the non-spontaneous N phase, and the existence of critical thicknesses below which the phase transitions disappear. The system with exhibits direct I-A transition in the absence of the walls. By the influence of the walls the discontinuity at the transition decreases but there is no qualitative difference in systems thicker than . If the system becomes thinner than , the N phase appears between I and A phases. Thus in systems with thickness three phases appear; i.e., the non-spontaneous N phase appears in these systems. As the system becomes thin, the discontinuities at the phase transitions decreases and I-N transition vanishes at ; eventually the I-A transition also vanishes at .
The critical thicknesses depend on the parameter ; the critical thicknesses for I-N and N-A phase transitions ( and , respectively) as functions of are shown in fig. 3. The -dependence of is strong while that of is weak, since the parameter directly couples to the A phase order parameter in the one-particle potential (2). The N-A critical thickness seems to diverge as approaches to from above. This is because the discontinuity at the N-A transition is small near the tricritical point, and thus the boundary anchoring condition strongly influences to the N-A transition.
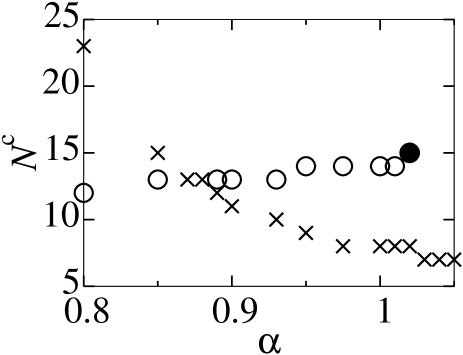
Figure 3 also shows that the curve terminates at , above which the intermediate N phase never appears no matter what the thickness is and only the I-A phase transition remains. Since the N phase does not appear in the bulk systems with , the non-spontaneous N phase appears in the systems with .
Such a non-spontaneous N phase just above the corresponds to experimental results as follows. The vs temperature phase diagram for the McMillan model in the absence of boundaries and fields can be compared with the alkyl chain length vs temperature phase diagram because of the relation between and the molecular length [7]. These phase diagrams are very similar as shown in figs.2 and 6 of ref. \citenMcMillan. The experimental result for 10CB liquid crystals sandwiched between walls [5] shows that the non-spontaneous N phase appears at the surface. Since the 10CB is the shortest molecule among members of the homologous series of CB exhibiting I-A transition, the 10CB can be assumed to correspond to the material with the parameter just above the triple point .
The thickness dependences of the transition temperatures are shown in figs. 4(a) and (b) for and , respectively.
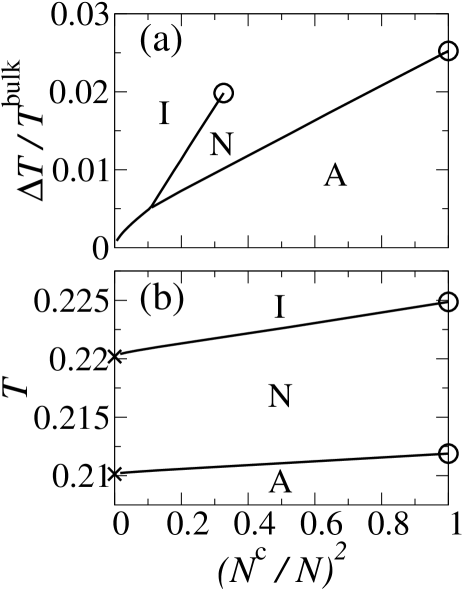
From these figures, it seems that the increments of the transition temperatures, , depend on the system thickness as in a very thin region. Such dependences differ from the prediction of the Kelvin equation [9]:
| (7) |
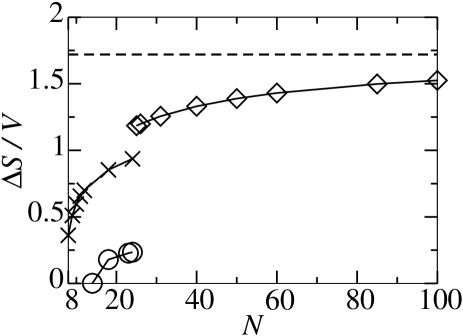
where is the latent heat per volume; and are, respectively, the surface tensions (per a wall) of higher and lower temperature phases. According to the Kelvin equation, the thickness dependence of is . This difference from the Kelvin equation clearly shows that the assumption on which the Kelvin equation based is not valid in very thin systems. The Kelvin equation is derived by assuming that the latent heat and surface tensions are independent of the system thickness, and this assumption is accurate for sufficiently thick systems. In fact as shown in fig. 5, the entropy of transition (i.e., ) strongly depends on the thickness in thin region; the Kelvin equation is valid for much thicker systems than the system we considered here.
The Clapeyron-Clausius equation, which is valid irrespective of the system thickness [2], is appropriate to treat such thin systems.
4 Summary and Discussions
In summary, we have investigated the influence of the strongly homeotropic anchoring walls on the McMillan model system. We have shown that the existence of the critical thickness for I-N, N-A and I-A transitions. This result is analogous to the existence of critical thickness for I-N transition in Landau-de Gennes nematogen model [1]. We have found that the system with just above the exhibits non-spontaneous N phase induced by anchoring walls; such a behavior is consistent with the behavior of a homologous series CB [5]. We have also obtained the I-N, N-A and I-A transition temperatures as functions of the system thickness. We have confirmed that the Kelvin equation is not valid for very thin system; the transition temperature behaves as instead of the prediction of the Kelvin equation .
We emphasize that the effects of anchoring walls are qualitatively similar to the effects of the external field as indicated in the early studies [1, 2]. Let us introduce two external fields and , conjugate to the order parameters and , respectively. We note that the squares of electric and magnetic fields correspond to , while has no experimental counterpart; thus usually only the field has been considered in literatures [13, 16, 12, 14, 15, 10, 11, 17], and has been omitted. In the following, we first consider only the influence of the field .
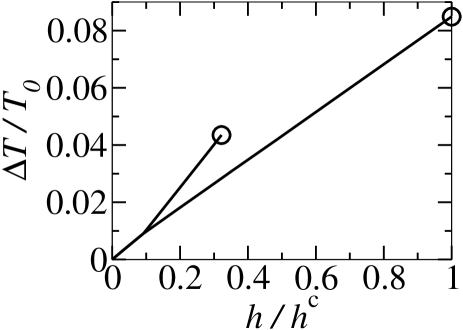
The increase of the transition temperature and the non-spontaneous N phase occur under the influence of ; in this sense, the influence of the field and of the anchoring walls are qualitatively similar. However, the similarity is incomplete with respect to the existence of the critical points. By the application of sufficiently strong field the I-N transition vanishes but the N-A transition does not, i.e., the critical point on the N-A coexisting line of - phase diagram does not exist. The N-A transition in a bulk McMillan system changes from first-order to second-order transition by the influence of ; i.e. the tricritical point appears on the N-A coexisting line instead of the critical point [10, 11, 12]. Thus we can conclude that the similarity is broken since both the I-N and N-A coexisting line terminate at critical points in the system under the influence of the anchoring walls, as shown in fig. 4. However, if we consider the external field in addition to , the tricritical point on the N-A coexisting line changes to a critical point in the bulk system [6]; then the similarity is again recovered. In order to show this similarity explicitly, we calculate the increment in transition temperatures under the application of both the and (see ref. [6] for details of the transition temperatures under the external fields). We plot on fig. 6 the increment of the transition temperature , under a condition for simplicity. The similarity between the influence of anchoring walls and of external fields is clearly seen in fig. 4 and fig. 6. This fact shows that, in considering the anchoring effects in the relationship with the external field, it is necessary to introduce the fictitious field together with .
References
- [1] P. Sheng: Phys. Rev. Lett., 37 (1976) 1059.
- [2] A. Poniewierski and T. J. Sluckin: Liq. Cryst., 2 (1987) 281.
- [3] H. Yokoyama: J. Chem. Soc., Faraday Trans. 2, 84 (1988) 1023.
- [4] I. Lelidis and P. Galatola: Phys. Rev. E, 66 (2002) 010701(R).
- [5] T. Moses: Phys. Rev. E, 64 (2001) 010702(R).
- [6] M. Torikai and M. Yamashita: J. Phys. Soc. Jpn., 73 (2004) 2154.
- [7] W. L. McMillan: Phys. Rev. A 4 (1971) 1238.
- [8] P. Sheng: Phys. Rev. A 26 (1982) 1610.
- [9] T. J. Sluckin and A. Poniewierski: Mol. Cryst. Liq. Cryst., 179 (1990) 349.
- [10] I. Lelidis and G. Durand: Phys. Rev. Lett., 73 (1994) 672.
- [11] I. Lelidis and G. Durand: J. Phys. II (Paris) 6 (1996) 1359.
- [12] H. Hama: J. Phys. Soc. Jpn. 54 (1985) 2204.
- [13] P. J. Wojtowicz and P. Sheng: Phys. Lett. A, 48 (1974) 235.
- [14] I. Lelidis, M. Nobili and G. Durand: Phys. Rev. E, 48 (1993) 3818.
- [15] I. Lelidis and G. Durand: Phys. Rev. E, 48 (1993) 3822.
- [16] C. Rosenblatt: Phys. Lett. A, 83 (1981) 221.
- [17] P. Galatora, M. Żelazna and I. Lelidis: Eur. Phys. J. B, 2 (1998) 51.