Email: ]nlwang@aphy.iphy.ac.cn
Crystal growth and in-plane optical properties of Tl2Ba2Can-1CunOx (n=1,2,3) superconductors
Abstract
Single crystals of thallium-based cuprates with the general formula Tl2Ba2Can-1CunOx(n=1,2,3) have been grown by the flux method. The superconducting transition temperatures determined by the ac magnetic susceptibility are 92 K, 109 K, and 119 K for n=1,2,3 respectively. X-ray diffraction measurements and EDX compositional analysis were described. We measured in-plane optical reflectance from room temperature down to 10 K, placing emphasis on Tl-2223. The reflectance roughly has a linear-frequency dependence above superconducting transition temperature, but displays a pronounced knee structure together with a dip-like feature at higher frequency below Tc. Correspondingly, the ratio of the reflectances below and above Tc displays a maximum and a minimum near those feature frequencies. In particular, those features in Tl2223 appear at higher energy scale than Tl2212, and Tl2201. The optical data are analyzed in terms of spectral function. We discussed the physical consequences of the data in terms of both clean and dirty limit.
pacs:
74.25.Gz, 74.72.JtI INTRODUCTION
Since the discovery of the high temperature superconductors(HTSC) in the 1980’s, many experiments have been done to disclose the microscopic origin of high temperature superconductivity. For example, inelastic neutron scattering revealed a peculiar magnetic resonance mode at an energy of 41 meV in two-dimensional reciprocal lattice position (,) for optimally doped YBa2Cu3O6+xNorman ; Mook . The angle resolved photoemission spectroscopy (ARPES) has indicated a kink in the band dispersion as well as an anisotropic gap (the d-wave behavior) for some high-Tc cuprates.Norman ; Ding ; Loeser . These results are very helpful for understanding the superconductivity mechanism in the cuprates. Naturally, one may ask whether these behaviors are generic in HTSC materials. But there are technical reasons why those experimental probes have not been used with success on all the families of HTSCs. For example, inelastic neutron scattering experiment requires large-size single crystals and had mostly been done on YBCO-123 and LSCO-214Norman ; Mook ; Cheong , although some groups have tried to work on Tl2Ba2CuO6+δ by synthesizing about 300 relatively large (0.5 to 3mm3) single crystals and co-aligning them in a mosaic of total volume 0.11cm3He , as well as on Bi2Sr2CaCu2O8+δ with a comparatively large single crystal of volume 1051.2mm3 and mosaicity (that is, the angular spread of the crystallographic axes), 1∘Fong . Tunnelling spectroscopy and ARPES are surface-sensitive probes. They are mainly applied to Bi-based cuprate systems as they could be cleaved easily in a vacuum along the Bi-O planes, yielding a high-quality virgin surfaceNorman . However, technique like optical spectroscopy places relatively less demands on the sample size and surface, and have consequently been applied with success to a larger number of high temperature superconducting systems. At present, optical probes cover a wide frequency and temperature range, which have provided much useful information about charge excitations and dynamics of cuprate superconductors.
In the whole HTSC families, thallium-based cuprates have provided a large series of superconductors including single Tl-O layered compounds with the number of CuO2 layers from 1 to 5 and double Tl-O layered compounds Tl2Ba2Can-1CunOx with the CuO2 layers n from 1 to 3 (hereafter abbreviated as Tl-2201, Tl-2212, Tl-2223, respectively)Parkin1 ; Ihara ; Sheng1 ; Toshihiro ; Maignan ; Kondoh ; Parkin2 ; Merrien . The Tl-based cuprates offer a good opportunity to investigate the physical properties of systems with different number of CuO2 layers in a unit cell, and therefore different Tc at the optimal doping. This will help to understand the mechanism of high temperature superconductivity. Another advantage of Tl-based cuprates is that, all the double Tl-O layer based cuprates have higher s than the double Bi-O layer based cuprates with the same structure. Even for the single CuO2 layered compound Tl-2201, its Tc can reach 90 K. Consequently, the difference between the superconducting state and the normal state can be easily probed. Nevertheless, despite those advantages, much less spectroscopic studies have been done on the Tl-based cuprates. This is mainly due to the difficulty of obtaining high quality single crystal samples. One has to overcome the problem of avoiding the poisonous thallium volatility and formation of intergrowth defects during crystal growthMaignan . Infrared studies have been done on crystals of single-layered Tl-2201Puchkov1 ; Puchkov2 , and thin-films of double-layered Tl-2212Wang , but there is still no report, to the best of our knowledge, on triple-layered Tl-2223 and any other Tl-based superconductors.
We have recently successfully grown single crystals of Tl2Ba2Can-1CunOx compounds with n=1,2, and 3 by the flux method. In this study, we first describe the crystal growth procedure and characterization of the as grown crystals by the ac magnetic susceptibility, X-ray diffraction measurements and EDX compositional analysis. Then, we report the measurement of the in-plane infrared reflectance. As optical data for optimally doped Tl-2201 and Tl-2212 are available in literature, we place emphasis on the spectra collected on triple-layered Tl-2223 crystals and their comparisons with data of Tl-2212 and Tl-2201. Very similar to the Tl-2201 and Tl-2212, we observe significant change of spectra after entering superconducting state, which was related to the combination of a Boson mode and a gap. We analyzed the spectra in terms of spectral function. A linear scaling is established between the energy of the characteristic feature and the superconducting transition temperature for different systems at optimal doping.
II CRYSTAL GROWTH AND CHARACTERISTICS
Single crystals were grown by the flux method from raw materials with nominal compositions as listed in Table I. The mixed oxide BaCaCuO powders were synthesized prior to the crystal growth. For example, we made the BaCaCuO-223x powder for Tl-2212, and BaCaCuO-266x for Tl-2223. Then, Tl2O3 powder was added into the mixed powders to get a stoichiometry as in Table I. The ratio of the oxide powders is essential for the crystal phase growth.
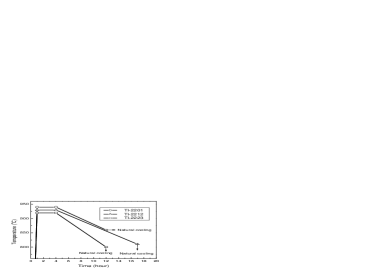
In the growth experiment, the powders of amount 15 grams were ground in an agate mortar, then placed in an alumina crucible and covered with two Al2O3 lids for decreasing the volatility of Tl2O3. The crucible was put in a tube furnace with flowing oxygen, and heated up to a high temperature for several hours. The temperature was set to be different for growing Tl-2201, Tl-2212, and Tl-2223 systems as shown in Fig. 1. The furnace was cooled down slowly at a rate of about 10∘C per hour to certain temperature (depending on the system), then down to room temperature naturally. The oxygen flowed all the time during the sintering process. The starting temperature and the cooling rate seriously affect the size of a as-grown crystal. It also affects substantially the superconducting transition temperature of Tl-2201 phase.
| Sample | Starting material | Size | Phase | |
|---|---|---|---|---|
| No. | Tl/Ba/Ca/Cu | K | mm2 | |
| A | 2/2/0/1 | 92 | 1.21.5 | Tl-2201 |
| B | 2/2/2/3 | 109 | 2.01.8 | Tl-2212 |
| C | 2/2/6/6 | 119 | 1.20.9 | Tl-2223 |
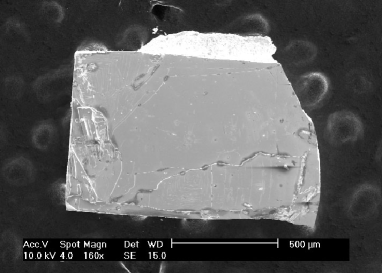
As the crucible had been cooled down to room temperature, the mm-sized crystals of Tl-2201, Tl-2212, and Tl-2223 single crystals have formed. Some shinny, usually free-standing crystals are found at the place near the cavities formed in the melt. The SEM image of a typical Tl-2223 crystal is shown in Fig. 2.
According to X-ray diffraction measurements shown in Fig. 3, nearly all the (0,0,) peaks can be seen clearly, furthermore, no other phase can be seen in the diffraction pattern, and every sample has a good c-axial orientation which is perpendicular to the sample natural growth face. The half widths of midpoint of the X-ray diffraction peaks are typically 0.07∘, 0.09∘ and 0.08∘ for Tl-2201, Tl-2212, and Tl-2223 single crystals, respectively. Clearly the intergrowth defects of the different members have been depressed by the sintering process. The lattice constants, c, of the three type of crystals are 23.21Å, 29.28Å and 35.55Å for Tl-2201, Tl-2212, Tl-2223 phases, respectively, as there is a CuCaO2 difference in each unit cell for the three phases.

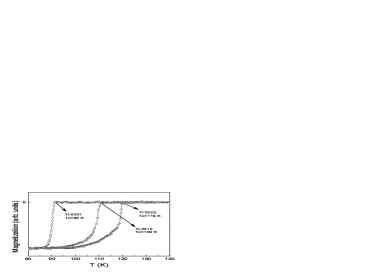
The superconducting transition temperature Tc was determined by ac susceptibility measurement. Tc increases in the three phases as the CuO2 layers in a unit cell increase from 1 to 3. The Tc for as-grown Tl-2212 and Tl-2223 crystals are always close to 109 K and 119 K, respectively, while the Tc for as-grown Tl-2201 crystals ranges from about 70 K to 92 K. Fig. 4 shows the temperature dependence of the ac susceptibility for as-grown Tl-2201, Tl2212, and Tl-2223 single crystals.
The compositions of the crystals were examined by energy dispersive X-ray micro analysis(EDX). The quantitative measurements were performed at several points on the surface of the crystal, which show a good uniformity of composition on the crystal surface. Typical EDX spectra obtained from each phase of the crystal are shown in Fig. 5. As expected form the ideal chemical formula of each phase, the peak ratios of CaKBaL and CuKBaL in the EDX spectra increased with the number of Cu-O layers in Tl compounds. Note that there is no Ca in the Tl-2201 phase, this is because we did not mix the CaO before this phase has been formed. Other peaks are of the Tl, Ba, Ca, Cu character spectrum. All these results are consistent with the X-ray diffraction experiments.

III Optical Properties
Optical spectroscopy measurement can yield rich information about charge dynamics of a system. Intensive optical studies have been done on La-, Y-, and Bi-based cuprate systems, comparatively, much less optical investigations have been done on Tl-based systems. As we mentioned in the introduction, infrared studies on the Tl-based systems have been performed only on single-layer and double-layer compounds near optimal doping. Therefore, in this work, we shall mainly focus on the data of Tl-2223 crystals, as well as their comparisons with data of Tl-2201 and Tl-2212.
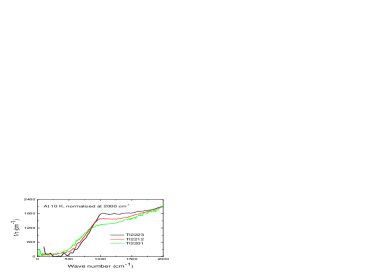
The reflectance measurements from 100 to 22000 cm-1 were carried out on a Bruker 66v/S spectrometer. An in-situ overcoating technique was used for the experimentHomes . The optical conductivity spectra were derived from the Kramers-Kronig transformation. Hagen-Rubens relation was assumed for the low-frequency extrapolation. At high frequency side, a constant extrapolation was adopted up to 100,000 cm-1, then a R()-4 was used. A comparison of the in-plane reflectances of Tl-2201, Tl-2212 and Tl-2223 single crystal at room temperature is shown in Fig. 6. Clearly as the CuO2 layers of a unit cell goes from 1 to 3, the reflectance edge goes to higher energy. The observation indicates that the carrier density increases with increasing the number of CuO2 layers in a unit cell.
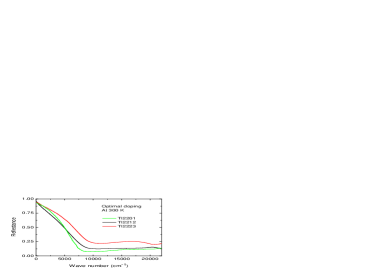
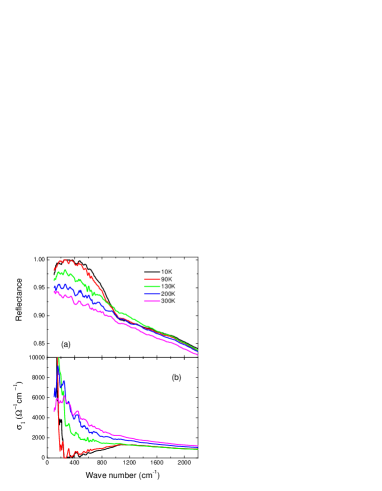
Fig. 7 (a) and (b) show the reflectance R() and conductivity 1() spectra for a Tl-2223 crystal at different temperatures. In the high temperature, the Tl-2223 reflectance spectra show roughly linear frequency dependence, a behavior common to all hole-doped high-Tc cuprates. The linear frequency dependence of ) implies a linear variation of the inverse lifetime of carriers with frequency, which could be well described by a marginal Fermi liquid theory.Hwang With decreasing temperature, the low- ) increases, indicating a metallic response of the sample. At 10 K in the superconducting state, R() shows a clear knee structure at around 600 cm-1. Above this frequency, the reflectance drops fast and becomes lower than the normal-state values at around 1000 cm-1. R() recovers the linear-frequency dependence at higher frequency about 1600 cm-1. Similar but slightly weak behaviors were seen at 90 K, which is close to .
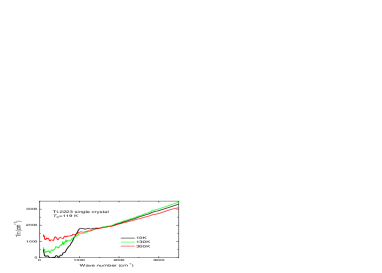
The temperature- and frequency-dependent optical responses of Tl-2201 and Tl-2212 crystals are very similar to those of Tl-2223 sample. For comparison we show in Fig. 8 the conductivity spectra for optimally doped Tl-2201, Tl-2212 and Tl-2223 at 300 K and 10 K, respectively. Qualitatively, the spectra exhibit the same characteristic in both normal and superconducting states for the three phases. The conductivity spectrum has a Drude-like shape in the normal state, but becomes suppressed below a certain frequency in the superconductiing state. However, it is found that the energy scale below which the is suppressed at 10 K shifts to lower frequencies as the CuO2 layers in a unit cell decreases from 3 to 1.
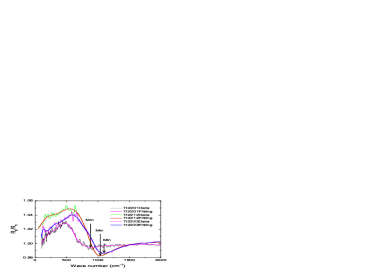
In fact, the change of optical response in the superconducting state with respect to the normal state could be seen more clearly from the plot of the ratio of the reflectance below over that above . Fig. 9 shows the ratio of R10K()/R130K() as a function of frequency. The R10K()/R95K() of a Tl-2201 crystal and the R10K()/R120K() of a Tl-2212 crystal are also included for comparison. Obviously both of them have a maximum and a minimum in the plot. The values near the maximum have much noise, nevertheless, we can see clearly the dip minimum and the fitting maximum of Tl-2223 shift to higher energy compared with Tl-2212Wang and Tl-2201.
A useful way to display in-plane infrared data is in terms of the optical life time of the carriers which can be extracted from the conductivity data using the extended-Drude formalism. The reciprocal of the lifetime, or the scattering rate, 1/(), is defined asPuchkov2
| (1) |
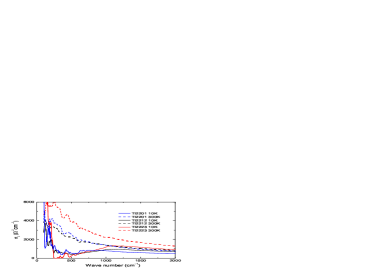
where p is the plasma frequency. The scattering rate 1/() for 10 K and 130 K and 300 K data are shown in Fig. 10, extracted from Eq.(1) using the plasma frequency 2.0104 cm-1, determined by summarizing the optical conductivity up to the plasma edge near 8,000 cm-1. The 1/() at 300 K is linear in the low energy range. However, 1/() at 10 K exhibits a rapid rise and a substantial overshoot of the normal-state spectrum at the frequencies corresponding to the maximum and minimum in the R10K()/R130K() plot (in Fig.9), respectively. Above this range the scattering rate in the superconducting state becomes linear up to several thousand wave number.
The sharp rise and the overshoot in 1/() at low T are quite similar to other high-Tc cuprates. The difference is that the energy scales of the characteristic features for Tl-2223 are higher than that for Tl-2212 compound. In our earlier studyWang , we already showed that the same structures in 1/() on Tl-2212 system with Tc=108 K are substantially higher than systems with Tc around 90 K. A comparison of the scattering rate for the three phases at 10 K is shown in Fig. 11. In this plot, the data for Tl-2201 crystal near optimal doping are taken from Puchkov’s workPuchkov1 . Our data on Tl-2201 crystal are almost identical to their reported data. The energy shifts of both the sharp rise and the overshoot structures are seen rather clearly. In fact, the energy scales of those features continue to shift up in compounds with higher superconducting transition temperature. This can be seen very clearly from optical work done on Hg-1223 with Tc130 KMcGuire .
The characteristic features were widely believed to result from the interaction of electrons with a collective mode in combination with a superconducting gap that appears below Carbotte1 ; Schachinger ; Abanov ; Tu ; Hwang2 . In photoemission experiment, a kink in the dispersion along the zone diagonal develops in the low temperature which is due to the correction by the real part of self-energy of quasiparticle, and by Kramers-Kronig relation, a rapid broadening of the photoemission line width, i.e. a sudden change of the life time of quasiparticle is seen simultaneouslyNorman . The enhanced absorption above the knee frequency in infrared response results from an enhanced scattering, which should have the same origin as the line width broadening or the kink in the dispersion observed along the zone diagonal in ARPES. Extracting the Bosonic spectral function from the infrared spectra has been established theoretically by performing second derivative of the optical scattering rate multiplied by frequency throughMarsiglio ; Carbotte1 :
| (2) |
As such second derivative contains detectable singularities at a number of characteristic energies, the inversion method was widely used to determine the parameters like gap amplitude and Boson mode energy .
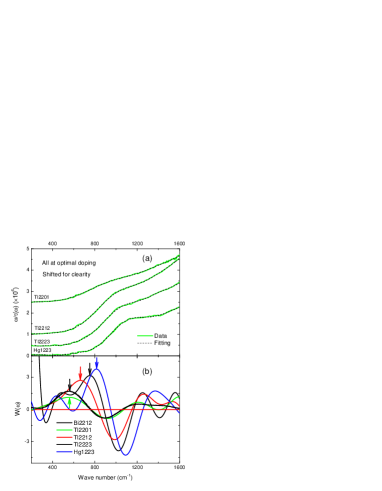
Fig. 12(a) shows the plot of the scattering rate multiplied by frequency vs. frequency for Tl-2201, Tl-2212, and Tl-2223 crystals. The data for Hg-1223 crystal taken from ref.McGuire are also plotted. In order to perform second derivative, the curves were fit with a high-order (40 orders) polynomial. To see the energy scales of the features more clearly, we have shifted the curves vertically for different compounds. The spectral functions W() obtained by equation (2) are plotted in Fig. 12(b). The W() data for a high-quality Bi-2212 crystal with Tc=91 K obtained by Tu et al. are also addedTu . We can see clearly that, roughly at frequencies corresponding to the sharp rise and the overshoot in 1/(), there exist a major peak, or positive maximum as indicated by the arrow and a negative minimum in W(), respectively. In particular, for those systems with different Tc at optimal doping, the positive maximum and the negative minimum increase systematically with Tc.
It also deserves to remark that some weak maxima could exist preceding the main peak in W(). They come from the week fluctuations in the fitting curves due to the experimental noise in the far-infrared region. Because the signal-to-noise level at low- side depends strongly on the sample size, those structures are observed most eminently for Tl-2223 and Hg-1223 samples due to their relatively smaller sizes. Those maxima are not steady for different measurements on different samples. Nevertheless, the main peak and the following negative minimum in each spectral function W() are fairly robust. They correspond to the sharp rise and overshoot in the scattering rate spectra, or the knee structure and dip-like feature in the reflectance spectra.
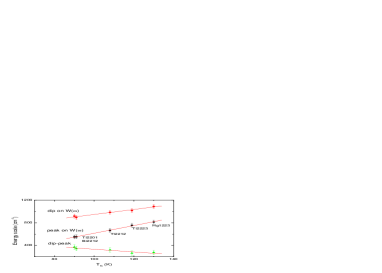
Although it is generally agreed that the second derivative of the optical conductivity, i.e. the W( spectrum, reflects the bosonic spectral function, different opinions exist regarding to the energy positions of the positive maximum and the negative minimum. Considering a d-wave gap symmetry, Carbotte et al.Carbotte1 ; Schachinger argued that the peak in W() below Tc occurs at +, while the minimum is at 2+. However, Abanov et al.Abanov argued that the d-wave gap does not affect the threshold position in conductivity, as a result, a sharp maximum in W() occurs at 2+ followed by a deep minimum. They emphasized that at T=0 K the maximum and minimum are at the same frequency, while at finite temperature, the maximum shifts to low frequency, but the minimum remains at the same frequency as at T=0 K. So, they also identify the 2+ with the deep minimum in W(). If we accept that the peak in W() locates at +, and the minimum is at 2+, we obtained a plot for the peak and the dip energy as a function of Tc for the different systems at optimal doping, as shown in Fig. 13. Obviously, both of them scale well with Tc for different systems. Furthermore, the difference between them should give the superconducting gap energy . In the figure, we also make the plot for the energy difference between the dip and the peak vs Tc for different compounds. It then shows a trend of increase with decreasing the superconducting transition temperature Tc for different systems. This result is not physically reasonable, and also in contradiction to the ARPESMatsui ; Feng and RamanGallais experimental results which show a decrease of the gap amplitude for the systems with lower Tc. We think that the current analysis puts new challenge to the established models.
Nevertheless, the linear scaling of the energy of the peak (and also the dip) in W() with Tc is firmly established in our experiment. At present, the nature of the mode is not clear. It is still under dispute whether the mode is a phonon or a magnetic resonance as detected by neutron scattering experiment. If the maximum or minimum indeed involve a sum of the gap and a Boson mode , then the scaling behavior not only means that the gap amplitude is proportional to Tc, but Boson mode energy is also proportional to Tc for the different systems. In this case, the phonon origin for the Boson mode is unambiguously ruled out, because the in-plane phonon is determined by the Cu-O bond length, which should not change in systems with different Tc.
However, we would also like to point out that the above scenario of a mode plus a gap for the reflectance feature below Tc relies on the clean limit of the ab-plane superconductivity. The unreasonable result obtained from the energy difference between the dip and the peak in terms of the model by Carbotte et al.Carbotte1 may suggest that the ab-plane of high-Tc cuprates may not be in clean limit. In the case of dirty limit, on the other hand, the sharp rise feature in the scattering rate should be at 2, since the impurities elastic scattering should be able to transfer the momentum of the particle-hole excitations without affecting the threshold energy. At present, there is still no agreement on whether or not the ab-plane is in clean limit. Very recently, HomesHomes2 suggests that the criteria of a small value of the quasiparticle scattering rate for T Tc is not a good measure of whether or not the superconductivity is in the clean or dirty limit. By contrast, The normal-state value of 1/ should be considered when determining whether a system is in the clean or dirty limit. They also pointed out that the clean-limit requirement is much more stringent for a d-wave system than it is for a material with an isotropic energy gap, since it not only requires 1/ much less than the maximum gap amplitude, but also 1/2 in the nodal regions. They established a linear scaling relation for cupratesHomes3 , and argued that this scaling is the hallmark of a dirty-limit systemHomes2 . In a dirty-limit case, no Boson mode would be involved in the sharp rise of scattering rate, or the main peak in the spectral function W(). The feature would be purely due to the singularity of density of state at gap position. Then what we observed and analyzed in this work only reflect the variation of the gap amplitude in systems with different Tc. At present, it needs rather sufficient experimental data and more theoretical efforts to identify whether the ab-plane superconductivity in cuprates is in the dirty-limit.
IV Summary
Single crystals of thallium-based cuprates have been grown by flux method. All crystals were of the platelet form, from 0.5 to 2mm2. They were characterized by ac susceptibility, X-ray diffraction, SEM and EDX analysis. The optical properties were investigated for the crystals with focus on the Tl-2223 compounds. The reflectance spectrum exhibits a knee structure at around 600 cm-1 and a dip at higher frequency below . The ratio of the reflectance below and above Tc displays a maximum and pronounced minimum at the knee and dip frequencies. The scattering rate and its second derivative were extracted and compared with other cuprate systems. A linear scaling behavior for the maximum and the negative minimum with Tc is established for systems with different Tc at optimal doping. We discussed the physical consequences of the experimental data in terms of both clean and dirty limits. At present, it is an open question whether the ab-plane of HTSCs is in the clean or dirty limit.
Acknowledgements.
We wish to acknowledge senior engineer H. Chen for her help in XRD experiment. This work is supported by National Science Foundation of China, the Knowledge Innovation Project of Chinese Academy of Sciences.References
- (1) M. R. Norman and C. C. Pépin, Rep. Prog. Phys. 66, 1547 (2003).
- (2) H. A. Mook, M. Yethraj, G. Aeppli, T. E. Mason and T. Armstrong, Phys. Rev. Lett. 70, 3490 (1993).
- (3) H. Ding, T. Yokoya, J. C. Campuzano, T. Takahashi, M. Randeria, M. R. Norman, T. Mochiku, K. Kadowaki and J. Giapintzakis, Nature 382, 51 (1996).
- (4) A. G. Loeser, Z. X. Shen, D. S. Dessau, D. S. Marshall, C. H. Park, P. Fournier and A. Kapitulnik, Science 273, 325 (1996).
- (5) S. W. Cheong, G. Aeppli, T. E. Mason, H. Mook, S. M. Hayden, P. C. Canfeld, Z. Fisk, K. N. Clausen, and J. M. Martinez, Phys. Rev. Lett. 67, 1791 (1991).
- (6) H. He, P. Bourges, Y. Sidis, C. Ulrich, L. P. Regnault, S. Pailhes, N. S. Berzigiarova, N. N. Kolesnikov and B. Keimer, Science 295, 1045 (2002).
- (7) H. F. Fong, P. Bourges, Y. Sidis, L. P. Regnault, A. Ivanov, G. D. Gu, N. Koshizuka and B. Keimer, Nature 398, 588 (1999).
- (8) S. S. P. Parkin, V. Y. Lee, A. I. Nazzal, R. Savoy, T. C. Huang, G. Gorman and R. Beyers, Phys.Rev.B 38, 6531 (1988).
- (9) H. Ihara, R. Sugise, K. Hatashi, M. Terada, M. Jo, N. Hirabayashi, A. Negishi, N. Atoda, H. Oyanagi, T. Shimomura and S. Ohashi, Phys.Rev.B 38, 11952 (1988).
- (10) Z. Z. Sheng and A. M. Hermann, Nature 332, 138 (1988).
- (11) Toshihiro KOTANI, Tetsuyuki KANEKO, Hiromi TAKEI and Koji TADA, Jap.J.appl.Phys. 28, 1378 (1989).
- (12) A. Maignan, C. Martin, V. Hardy, Ch. Simon, M. Hervieu and B. Raveau, Physica C 219, 407 (1994).
- (13) S. Kondoh, Y. Ando, M. Onoda and M. Sato, solid state commun. 65, 1329 (1988).
- (14) S. S. P. Parkin, V. Y. Lee, E. M. Engler, A. I. Nazzal, T. C. Huang, G. Gorman, R. Savoy, and R. Beyers, Phys.Rev.Lett. 60, 2539 (1988).
- (15) N. Merrien, L. Coudrier, C. Martin, A. Maignan, F. Studer, and A. M. Flank, Phys.Rev.B 49, 9906 (1994).
- (16) A. V. Puchkov, T. Timusk, S. Doyle, and A. M. Hermann, Phys.Rev.B 51, 3312 (1995).
- (17) A. V. Puchkov, D. N. Basov and T. Timusk, J.Phys C 8, 10049 (1996).
- (18) N. L. Wang, P. Zheng, J. L. Luo, Z. J. Chen, S. L. Yan, L. Fang, Y. C. Ma, Phys.Rev.B 68, 054516 (2003).
- (19) C. C. Homes, M. Reedyk, D.A. Crandles, and T. Timusk, Appl. Opt. 32, 2976 (1993).
- (20) J. Hwang, T. Timusk, A. V. Puchkov, N. L. Wang, G.D. Gu, C. C. Homes, J. J. Tu, and H. Eisaki, Phys. Rev. B 69, 094520 (2004).
- (21) J. J. McGuire, M. Windt, T. Startseva, T. Timusk, D. Colson and V. Viallet-Guillen, Phys. Rev. B 62, 8711 (2000).
- (22) J. P. Carbotte, E. Schachinger, and D. N. Bosov, Nature 401, 354 (1999).
- (23) E. Schachinger and J. P. Carbotte, Phys. Rev. B 64, 094501 (2001).
- (24) A. Abanov, A.V. Chubukov, and J. Schmalian, Phys. Rev. B 63, 180510(R) (2001).
- (25) J. J. Tu, C. C. Homes, G. D. Gu, D. N. Basov, and M. Strongin, Phys. Rev. B 66, 144514 (2002).
- (26) J. Hwang, T. Timusk, and G. D. Gu, Nature 427, 714. (2004).
- (27) F. Marsiglio, T. Startseva, and J.P. Carbotte, Phys. Lett. A 245, 172 (1998).
- (28) H. Matsui, T. Sato, T. Takahashi, H. Ding, H.-B. Yang, S.-C. Wang, T. Fujii, T. Watanabe, A. Matsuda, T. Terashima, and K. Kadowaki, Phys. Rev. B 67, 060501(R) (2003).
- (29) D. L. Feng, A. Damascelli, K. M. Shen, N. Motoyama, D. H. Lu, H. Eisaki, K. Shimizu, J.-i. Shimoyama, K. Kishio, N. Kaneko, M. Greven, G. D. Gu, X. J. Zhou, C. Kim, F. Ronning, N. P. Armitage, and Z.-X Shen, Phys. Rev. Lett. Phys. Rev. Lett. 88, 107001 (2002)
- (30) Y. Gallais, A. Sacuto, D. Colson, Physica C 408, 785 (2004)
- (31) C. C. Homes, S. V. Dordevic, T. Valla, and M.Strongin arXiv: cond-mat/0410719.
- (32) C. C. Homes, S. V. Dordevic, M. Strongin, D. A. Bonn, R. X. Liang, W. N. Hardy, S. Komiya, Y. Ando, G. Yu, N. Kaneko, X. Zhao, M. Greven, D. N. Basov, T. Timusk, Nature 430, 539 (2004)