Statistical properties of the critical eigenstates in power-law random banded matrices across the band
Abstract
The level-spacing distribution in the tails of the eigenvalue bands of the power-law random banded matrix (PRBM) ensemble have been investigated numerically. The change of level-spacing statistics across the band is examined for different coupling strengths and compared to the density of states for the different systems. It is confirmed that, by varying the eigenvalue region, the same level-spacing statistics can be reached as by varying the coupling strength.
pacs:
71.30.+h, 72.15.Rn, 71.55.JvThe Anderson metal-insulator transition (MIT) Anderson (1958) is a phenomenon of major physical importance that continues to attract a substantial research effort Brandes and Kettemann (2003); Janssen (2001). With just short-range interactions, localization-delocalization (LD) transitions are only found in systems with dimensionality, , greater than two Mirlin and Evers (2000). However, with the addition of long-range interactions, or correlations between the short-range interactions, it is possible to study the LD transition in systems with dimensionality less than two Levitov (1990). In this respect, power-law random-banded matrices (PRBMs), that exhibit this transition, have recently attracted much attention Cuevas (2004a); Lima et al. (2004); García-García and Osborn (2004); Cuevas et al. (2002, 2001). The PRBM ensemble was introduced by Mirlin et. al. Mirlin et al. (1996) and, in the real case, is defined as the ensemble of random symmetric matrices, . The PRBM elements, , are randomly drawn from a Gaussian distribution, centred around zero, with a variance governed by a power-law decay:
| (1) |
where and are parameters. Regarding as a Hamiltonian, the eigenvalues, E, are energies.
For , it has been shown Mirlin et al. (1996) that all the eigenstates of these matrices are critical (i.e. at the LD transition). The parameter is inversely related to the coupling strength between the nodes. In the limit and , the PRBM critical states are analogous to the critical states at the Anderson transition with and , and for to those found in the Anderson model with Evers and Mirlin (2000). By varying , it is possible to access a set of different critical theories parameterized by dimension () in the conventional Anderson transition. This ability to examine Anderson transitions in different dimensions, in the same effectively one-dimensional model, makes the study of PRBMs a powerful method to make progress in this rich field. As well as being an analogue for the study of important transitions elsewhere, the PRBM is physically important in its own right and has been applied to the study of the finite-temperature Luttinger liquid Kravtsov and Tsvelik (2000), the coherent propagation of two interacting particles in a 1D weak random potential Ponomarev and Silvestrov (1997) and other problems Lima et al. (2004); Cuevas (2004b). Recently, it has also been realized that, with the addition of chirality, the PRBM also describes the LD transition of quark zero modes in QCD García-García and Osborn (2004). In the QCD vacuum, the quark zero-mode wavefunction decay has a power-law dependence and long-range hopping between sites is possible. In this model, the eigenvalues away from the centre of the spectral band are not affected by the chiral structure; this makes it relevant to the analysis of the critical states away from the band centre given in this paper.
It is known Evers and Mirlin (2000) that, by changing the coupling parameter, , for , it is possible to access the set of models in different dimensions by investigating the statistical properties of the PRBM eigenstates, , around the band centre, . Alternatively, this can be achieved by varying away from the band centre and keeping constant, as was mentioned in Ref. Mirlin and Evers (2000). However, this feature of the PRBM has not been previously studied and confirmed numerically, and this is the aim of this paper: to investigate the statistical properties of the eigenstates of the PRBM across the whole range of the spectrum. One of the main results of the paper is to demonstrate numerically that there is a mapping between different values of and given certain critical level-spacing statistics, i.e. with and , in terms of equivalent level-spacing statistics. This is important, both in models where PRBMs are used to model systems in which all the eigenvalues are of physical importance, see e.g. Ref. García-García and Osborn (2004), and to support the validity of taking statistics from a finite region Evers and Mirlin (2000); Cuevas et al. (2001); Lima et al. (2004) around the band centre; we obtain estimates to justify the width of the region around the band centre that is used for statistical analysis.
To study the level-spacing statistics, a careful unfolding procedure was used, taking into account the varying mean level spacing (especially in the band tails) when normalizing the spacings. The width of the bins in was chosen to be sufficiently small so as to ensure that the nature of the states, and thus their statistical properties, do not change appreciably across them. The symmetry of the spectrum about has also been used to improve the level-spacing statistics. The size of the matrices (with periodic boundary conditions) varied in the range between and . The off-diagonal elements of the matrices were multiplied by a factor (as in Ref. Cuevas (2003)) in order to reinforce the closeness of the system to the Gaussian orthogonal ensemble.
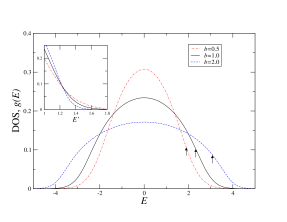
The densities of states (DOS) of the PRBM ensembles for different values of the parameter and are shown in Fig. 1. It can be seen that with increasing the bandwidth increases. There is substantial deviation from the semi-circle shape (cf. Ref. Varga and Braun (2000)) typical for the spectra of matrices from the Gaussian orthogonal ensemble, which do not show any change in the level-spacing statistics (the Wigner surmise) across the band Mehta (1991). The inset in Fig. 1 shows eigenvalue-rescaled DOSs, and verifies what is suggested by the main graph - that lower values of also correspond to longer tails appearing in the density of states. This means that the DOSs corresponding to different values of cannot be equated by a simple linear rescaling of the eigenvalues. The fact that the plots in the inset appear to intersect at one point is not significant, but merely a result of the particular variables used to produce the graph.
The bands shown in Fig. 1 contain only critical states of multifractal nature, which exhibit a particular type of level-spacing statistics. For these critical states, the probability distribution function, , of normalized level spacings, , between adjacent levels starts from zero at (level-repelling effect), goes through a maximum, and then exponentially decays for according to the following law Zharekeshev and Kramer (1997); Bogomolny et al. (1999); Cuevas (2004a):
| (2) |
This functional form is different from those appropriate for descriptions of level-spacing statistics for localized or extended states. The level spacing for localized states follows the Poisson law, , while for extended states, the distribution is described by the Wigner-Dyson surmise distribution Mehta (1991), .
In the case of the standard Anderson transition for systems in Euclidean geometries, there has been some controversy about the value of the exponent in Eq. (2). Recent papersVarga et al. (1995); Cuevas (2004a) have given for 3D, whilst this value was refuted in another paperZharekeshev and Kramer (1997) and the value set at . The uncertainty in the numerical value of for the standard Anderson transition comes from the fact that it is difficult to evaluate this exponent from an analysis of the critical states which exist only around one point (the LD transition) on the energy scale. This difficulty is lessened for the PRBM where all the states are critical, and thus an analysis of the level-spacing statistics can be performed relatively easily under the assumption that the statistics do not change with varying . This assumption has been made Cuevas (2004a) to perform a level-spacing statistical analysis around . It was demonstrated there that the exponent in Eq. (2) depends on the parameter . An obvious question, which has not been addressed before, is how the level-spacing statistics change away from the band centre. In particular, is there a correspondence between the statistics for different values of and ? These questions are answered below.
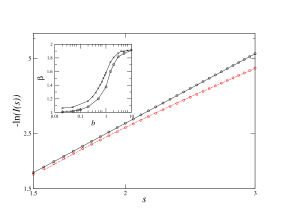
In order to examine the level-spacing statistics for different values of , we have performed a standard analysis, studying the cumulative level-spacing distribution , which retains the asymptotic behaviour of . We expect a linear dependence in a double-logarithmic plot of vs for , with the gradient (i.e. ) being in the range , where and are the exponents for the Poisson and Wigner-Dyson distributions, respectively. Indeed, we have found such linear dependences characterized by different values of for varying . In Fig. 2, we show two representative dependencies for the states at the band centre (solid line, ) and from the tail region (dashed line, ). We should emphasize that we have used a slightly different statistic from that of Ref. Cuevas (2004a). This was due to the fact that the DOS in the tail regions rapidly approaches zero and there are a smaller number of eigenvalues (and thus level spacings) available for statistical analysis. Therefore, we have moved the range of level spacing towards smaller values, , where there are more data in and the double-log graph is still reasonably straight, in contrast to the higher ranges used in Ref. Cuevas (2004a). Such a change in the range of analysis resulted in slightly higher values of for the states around the band centre (see the inset in Fig. 2). We have checked our method of analysis for the band centre using higher ranges and reproduced the published values Cuevas (2004a) of for different .
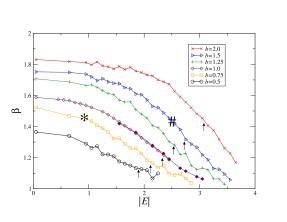
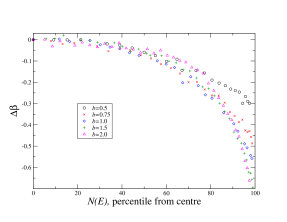
Fig. 3 shows our main result. In this figure, we demonstrate the possibility of mapping between different values of eigenvalue and parameter in terms of the same level-spacing statistics characterized by the exponent . Indeed, as can be seen from Fig. 3, one value of for a given (e.g. the star-symbol) corresponds to a different value of with another value of (e.g. the hache symbol) but having the same statistics characterized by . In other words, we demonstrate that it is possible to access different dimensionalities for the standard Anderson LD transition simply by analyzing different eigenvalues of the PRBM at fixed value of the the parameter .
The plots in Fig. 3 clearly show a region around the band centre where the statistics do not change much followed by a decrease in towards the Poisson value () on approaching the edge of the band. The range of eigenvalues around the band centre where the value of is approximately constant depends on the value of parameter . In order to determine the extent of this region around the band centre, it is illuminating to plot the change of the exponent from the band centre, , versus the cumulative density of states, . In this case, as seen in Fig. 4, all the curves in the midgap region, say for , approximately collapse to a single curve. This justifies an analysis of the level-spacing statistics around the band centre for less than approximately 50 of states with an absolute error in less than .
The data presented in Fig. 3 were obtained for matrices by averaging over 420 realizations for all values of except , for which 620 realizations were used to obtain better statistics in the far tail. The absence of size effects has been checked for the case of by performing additional analyses for matrices (compare open and solid squares in Fig. 3).
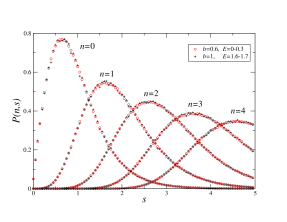
In order to verify the equivalence between different values of in terms of equivalent level-spacing statistics, found by analysis to have the same value of the exponent for the adjacent level-spacing probability distribution , given by Eq. (2), we have calculated in addition the -level distribution functions, Mehta (1991). These functions are the probability distribution functions for the level spacing between two levels separated by other levels, with . Fig. 5 shows the equivalence between all five -level distribution functions for two representative pairs of parameters, and characterized by the same value of . This means that the statistical properties of the critical eigenvalues, which can be characterized by different functions, e.g. the two-point correlation function Braun and Montambaux (1995), , are the same for and .
In conclusion, we have provided numerical evidence for the equivalence of statistical properties of critical eigenstates for different values of both the strength parameter and eigenvalues of power-law random banded matrices (PRBMs). This justifies the use of an alternative way of exploring different dimensionalities for the standard Anderson transition. Instead of the usual way of analyzing the level-spacing statistics around the band centre for different values of , we show that it is possible to access the same statistics by moving through the band of eigenvalues at fixed value of . Also, we specify the range of the eigenvalues around the band centre where the level-spacing statistics do not change significantly, and thus justify the standard method of statistical analysis of eigenvalues of the PRBM by varying .
CJP would like to thank the Engineering and Physical Sciences Research Council for financial support.
References
- Anderson (1958) P. W. Anderson, Phys. Rev. 109, 42 (1958).
- Brandes and Kettemann (2003) T. Brandes and S. Kettemann, The Anderson Transition and its Ramifications - Localisation, Quantum Interference, and Interactions (Springer, 2003).
- Janssen (2001) M. Janssen, Fluctuations and Localization in Mesoscopic Electron Systems (World Scientific, 2001).
- Mirlin and Evers (2000) A. Mirlin and F. Evers, Phys. Rev. B 62, 7920 (2000).
- Levitov (1990) L. Levitov, Phys. Rev. Lett. 64, 547 (1990).
- Cuevas (2004a) E. Cuevas, Europhys. Lett. 67, 84 (2004a).
- Lima et al. (2004) R. Lima, H. da Cruz, J. Cressoni, and M. Lyra, Phys. Rev. B 69, 165117 (2004).
- García-García and Osborn (2004) A. García-García and J. Osborn, Phys. Rev. Lett. 93, 132002 (2004).
- Cuevas et al. (2002) E. Cuevas, M. Ortuño, V. Gasparian, and A. Pérez-Garrido, Phys. Rev. Lett. 88, 016401 (2002).
- Cuevas et al. (2001) E. Cuevas, V. Gasparian, and M. Ortuñno, Phys. Rev. Lett. 87, 056601 (2001).
- Mirlin et al. (1996) A. Mirlin, Y. Fyodorov, F. Dittes, J. Quezada, and T. Seligman, Phys. Rev. E 54, 3221 (1996).
- Evers and Mirlin (2000) F. Evers and A. Mirlin, Phys. Rev. Lett. 84, 3690 (2000).
- Kravtsov and Tsvelik (2000) V. Kravtsov and A. Tsvelik, Phys. Rev. B 62, 9888 (2000).
- Ponomarev and Silvestrov (1997) I. Ponomarev and P. Silvestrov, Phys. Rev. B 56, 3742 (1997).
- Cuevas (2004b) E. Cuevas, Phys. Stat. Sol. (b) 241, 2109 (2004b).
- Cuevas (2003) E. Cuevas, Phys. Rev. B 68, 184206 (2003).
- Varga and Braun (2000) I. Varga and D. Braun, Phys. Rev. B 61, 11859 (2000).
- Mehta (1991) M. Mehta, Random Matrices, 2nd ed. (Academic Press, 1991).
- Zharekeshev and Kramer (1997) I. Zharekeshev and B. Kramer, Phys. Rev. Lett. 79, 717 (1997).
- Bogomolny et al. (1999) E. Bogomolny, U. Gerland, and C. Schmit, Phys. Rev. E 59, 1315 (1999).
- Varga et al. (1995) I. Varga, E. Hofstetter, M. Schreiber, and J. Pipek, Phys. Rev. B 52, 7783 (1995).
- Braun and Montambaux (1995) D. Braun and G. Montambaux, Phys. Rev. B 52, 13903 (1995).