Light-induced structural transformations in a single gallium nanoparticulate
Abstract
In a single gallium nanoparticulate, self-assembled (from an atomic beam) in a nano-aperture at the tip of a tapered optical fiber, we have observed evidence for a sequence of reversible light-induced transformations between five different structural phases (), stimulated by optical excitation at nanowatt power levels.
pacs:
64.70.Nd, 78.67.BfIn this letter we report experimental evidence for a sequence of light-induced structural phase transformations involving five different phases in a single gallium nanoparticulate. Our results are consistent with predictions that phase transitions in nano-volumes of material are achieved through continuous and reversible surface-driven coexistences of different forms Berry and Smirnov (2000); Shirinyan and Wautelet (2004), and demonstrate that such transformations can be stimulated and controlled by extremely low power optical excitation. We have been able to induce and monitor transitions between phases that differ in free energy by only a fraction of an per atom and found that the nanoparticulate’s structural response to optical excitation settles within a few tens of microseconds. We observed that a particulate probed with low intensity cw laser light can be overcooled by more than before it returns to the low-temperature phase, but that under a regime of more intense pulsed optical excitation this overcooling hysteresis collapses.
With such techniques as confocal microscopy, ‘optical tweezers’ and scanning near-field imaging it is now possible to detect photoluminescence and Raman spectra and perform sophisticated transient spectroscopic measurements on single nanoparticles Prikulis et al. (2004); Lindfors et al. (2004); Peyser et al. (2001); Doering and Nie (2002) - essentially removing the inhomogeneous broadening characteristic of nanoparticle film spectroscopy. In nanoparticles, phase transition temperatures and optical absorption cross-sections depend strongly on particle size, so inhomogeneous broadening in nanoparticle films masks the characteristic changes in optical properties that accompany a transition. Studying transitions in a single nanoparticulate, as opposed to a nanoparticle film MacDonald et al. (2003); Pochon et al. (2004), leads to advantages similar to the resolution improvements achieved in the optical spectroscopy of single particles.
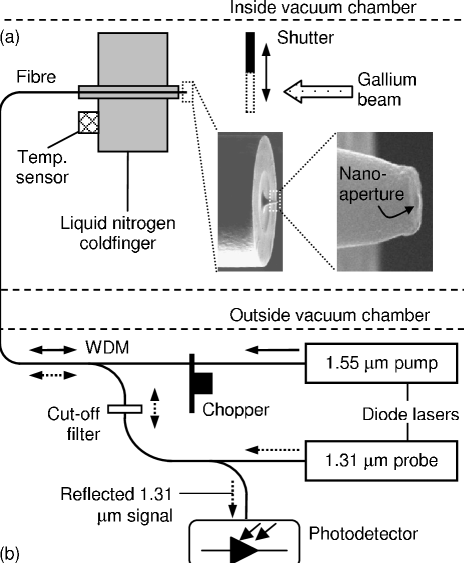
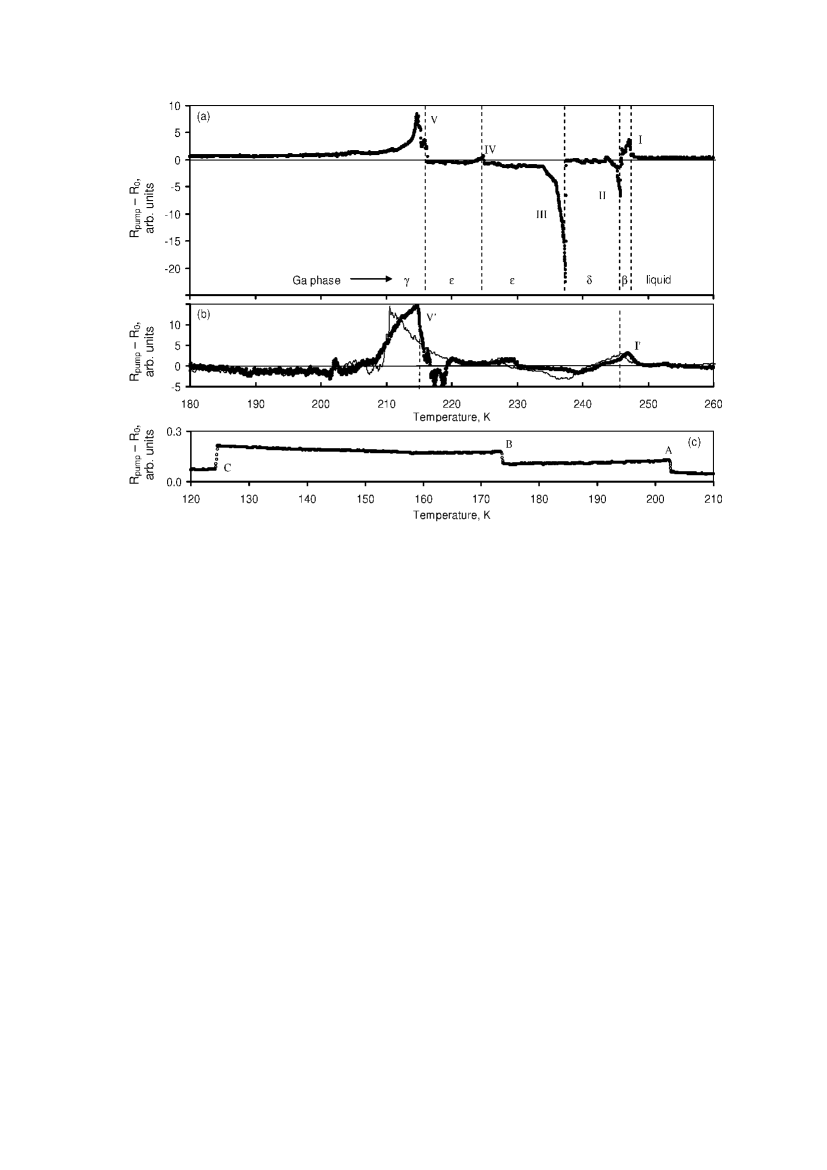
We studied a single nanoparticulate, grown from an atomic beam, at the tip of a tapered optical fiber with a nano-aperture at its end. This location allows for precise coupling of optical excitations to the particulate for the stimulation of phase transformations, and simultaneously for collection of a probe signal reflected by the particulate and used to monitor its state. We used a gold-coated silica single-mode fiber tapered to a aperture (see inset to Fig. 1a). It was attached to a liquid nitrogen cryostat cold-finger at inside a vacuum chamber evacuated to . To grow the nanoparticulate, a gallium atomic beam with a mass flux of was directed at the end of the fiber for (Fig. 1a). The formation of a particulate in the nano-aperture was indicated by a change in the reflectivity of the fiber tip during deposition (we assume that, at least on formation, the particulate fills the aperture and therefore has a diameter equal to that of the aperture, i.e. ). A cw diode laser operating at was used as a probe and another at , typically modulated at , was used as the pump. The reflected probe signal was monitored using an InGaAs photodetector and a digital lock-in amplifier (locked on the frequency ). A wavelength-division multiplexer (WDM) and bandpass filter prevented reflected pump light from reaching the photodetector (see Fig. 1b). Structural transformations were observed by monitoring pump-beam-induced changes in the reflectivity of the particulate as a function of temperature between and (varied at a rate of ) using pump and probe powers of and respectively at the nano-aperture. While increasing the temperature of the nanoparticulate we observe several narrow peaks in the induced-reflectivity-change signal at temperatures between and , as shown in Fig. 2a (no features are observed outside the range shown). Positive and negative peaks correspond to pump-induced increases and decreases in nanoparticulate reflectivity. When repeating the heating cycle the peaks appear at the same positions, although their relative heights may vary slightly.
Substantial changes in the optical properties of the nanoparticulate may occur when it undergoes a transition between two structural phases. Such changes are typically much more dramatic than temperature-dependent variations occurring within a single phase. Indeed, in the case of gallium, differences between the electronic density of states of its various phases Bernasconi et al. (1995) lead to pronounced differences between their optical dielectric coefficients. A phase change in a galluim nanoparticulate thus affects its optical absorption cross-section Fedotov et al. (2004), and in the present case will change the reflectivity of the nano-aperture hosting the particulate. One may thus detect phase transformations in a nanoparticulate by monitoring its optical properties. A peculiarity of confined solids is that their structural transformations take the form of a dynamic coexistence between different phases (as opposed to an abrupt transition) Berry and Smirnov (2000); Shirinyan and Wautelet (2004), with the surface of a particle (where atoms have fewer nearest neighbors than internal atoms) acting as a boundary at which transformations start Peters et al. (1997); Parravicini et al. (2003). In the presence of optical excitation, the phase equilibrium (and therefore in the present case the reflectivity of the particle) is determined by both temperature and the level of electronic excitation Wautelet (2004). In the current experiment, incident laser light leads to both electronic excitation and a local temperature increase, which simultaneously affect the phase equilibrium. To detail this process further, we may consider a nanoparticle consisting of a core in one structural phase covered by a shell of a different phase. With increasing temperature or level of excitation, the shell layer’s thickness increases and the optical properties of the particle change continuously from those of the core phase to those of the surface phase. If the temperature or level of optical excitation is reduced before the transformation to the new phase is complete, i.e. while a nucleus of the core phase is still present, the transformation is reversed, the skin layer shrinks to an appropriate equilibrium position and the reflectivity returns to its original level. However, when the core is fully consumed by the surface phase the particle becomes stable against a return to the core phase because this would require the creation of a nucleation center. At this point the applied excitation abruptly ceases to induce any significant change in the particle’s optical properties, until the temperature approaches the next phase transition point. This type of optical response, i.e. one based on reversible, excitation-induced structural transformations, has been observed previously at bulk gallium/glass interfaces Petropoulos et al. (2001) and in gallium nanoparticle films MacDonald et al. (2003); Pochon et al. (2004) but these experiments did not resolve the fine structure of transitions involving multiple phases.
The pump-induced reflectivity change signal observed during the cooling of the nanoparticulate (see Fig. 2c) is very different from that observed during heating. It is about two orders of magnitude smaller and instead of sharp peaks there are abrupt step-changes in the signal at certain temperatures. With the much smaller signal level, there are fewer discernable steps in the cooling part of the temperature cycle than peaks in the heating part, and they occur at temperatures different from those of any of the peaks. Some of these features can be explained by overcooling: with decreasing temperature the particulate remains in a given phase until its temperature is somewhat lower than the normal phase transition temperature and in these conditions pump excitation produces very little signal. When the overcooled particulate transforms abruptly into a lower energy phase the pump-induced probe modulation is again small because this change happens at a temperature far below the increasing-temperature signal peak for that phase. Thus, peak and step correspond respectively to transitions into and out of the highest temperature phase, implying that it overcools by ; and step and peak are associated with transitions into and out of the lowest temperature phase, which overcools by .
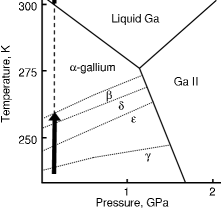
Peak can confidently be attributed to a transition from a solid state to the liquid. An X-ray diffraction study of gallium nanoparticles found that -gallium, the stable solid state of bulk gallium, is completely absent in small particles Cicco (1998) so it follows from Defrain’s analysis of the free energies of gallium’s metastable phases Defrain (1977) that the only possible sequence of structural transformations in gallium particles is ( all crystalline). This sequence is in agreement with the established phase diagram for gallium shown in Fig. 3 (the pressure inside the particulate may be estimated using the Laplace-Young equation where is the surface tension for the liquid phase, is the particle diameter, and is its height, giving ). Thus, peak , at in Fig. 2a, may be attributed to a transition from monoclinic -gallium to the melt, peak (at ) to a transition from rhombic -gallium to -gallium and peak (at ) to a transition from -gallium (of unknown point group) to -gallium. Assigning transitions to peak (at ) and the more structured peak (at ) is more difficult. We will assume that the phase, which is strongly represented in gallium nanoparticle X-ray spectra Cicco (1998), is the most likely candidate for the ground state (lowest temperature) phase of the particulate, in which case peak is probably associated with a transition from -gallium to -gallium. We believe that peak (the smallest of the five) corresponds to a change in the nanoparticulate’s shape rather than its phase: The optical cross-section of a nanoparticulate depends strongly on its shape so a particulate’s reflectivity may also change when its shape changes. This argument is supported by measurements of the retardation between pump and probe modulations, which relates to the non-instantaneous relaxation of the high-energy phase back into the low energy phase following withdrawal of the optical excitation. Small retardation changes (few degrees) are resolved in the vicinity of peaks and , and to a lesser extent around peaks and , indicating that the relaxation time increases by close to these peaks. For peak the retardation is at least an order of magnitude larger than for the other peaks - suggesting that the associated transition is different from the others. In the absence of any data on the dielectric constants of gallium’s metastable crystalline phases, no information on the phase transition sequence can be derived from the signs or relative magnitudes of the peaks in Fig. 2a.
Replacing the cw pump beam with a train of pulses (at the same wavelength) dramatically changes the phase transition pattern. Such data are presented in Fig. 2b, where the temperature scale has been shifted by to compensate for the strong heating effect induced by the short pulses and bring the peak pattern back into line with the cw-pump data in Fig. 1a. (Thermodynamic calculations confirm that the energy absorbed by the nanoparticulate cannot dissipate during the pulse and therefore rapidly increases its temperature.) For the pulsed regime of excitation, the optical changes associated with the phase transitions are very similar in both directions of temperature, the magnitude of induced reflectivity changes is much smaller than for cw excitation and there is very little overcooling. With increasing temperature, peaks and are still present but the large peak at position is replaced by a much smoother, broader feature. With decreasing temperature, the same major peaks are seen with overcooling of only for peak and for peak . Peaks and from the cw scan cannot be identified. The near-disappearance of overcooling may result from the fact that a short intense pump pulse may help a slightly overcooled nanoparticulate to change from the high temperature phase to the low temperature phase by rapidly providing sufficient energy for it to get through the potential barrier between the phases as in the ‘explosive crystallization’ effect where a localized energy input stimulates an abrupt transition from an overcooled liquid state to the solid state Kuzmenko et al. (1991).
The light-induced structural transitions are observed at very low levels of optical excitation. Such levels can be used because the differences between the free energies of some of the metastable phases involved are very small: for example, , Defrain (1977). Thus, the absorbtion of a ‘pump’ quantum with an energy of should be sufficient to convert about atoms from the phase to the phase, and about atoms from the phase to the phase. The light-induced transitions are likely to be driven primarily by thermal excitation (i.e. laser-induced heating) but there may also be a contribution from a temperature-independent, non-thermal mechanism where the phase change is caused by band-structure collapse and lattice instability resulting from electronic excitation Guo et al. (2000); Wautelet (2004).
To summarize, we have for the first time investigated light-induced structural transformations in a single gallium nanoparticulate and observed evidence for a sequence of reversible transformations between five different structural phases. The low energy requirements for such optically induced phase transitions, and the nanoparticulate’s phase stability on overcooling could provide a means of creating key logical and bistable memory elements for nanophotonic devices operating at extremely low power levels.
The authors would like to acknowledge the financial support of the EPSRC (UK) and Fundação para a Ciência e Tecnologia (Portugal).
References
- Berry and Smirnov (2000) R. S. Berry and B. M. Smirnov, J. Chem. Phys. 113, 728 (2000).
- Shirinyan and Wautelet (2004) A. S. Shirinyan and M. Wautelet, Nanotech. 15, 1720 (2004).
- Prikulis et al. (2004) J. Prikulis, F. Svedberg, M. K ll, J. Enger, K. Ramser, M. Goks r, and D. Hanstorp, Nano. Lett. 4, 115 (2004).
- Lindfors et al. (2004) K. Lindfors, P. Kalkbrenner, P. Stoller, and V. Sandoghdar, Phys. Rev. Lett. 93, 037401 (2004).
- Peyser et al. (2001) L. A. Peyser, A. E. Vinson, A. P. Bartko, and R. M. Dickson, Science 219, 103 (2001).
- Doering and Nie (2002) W. E. Doering and S. Nie, J. Phys. Chem. B 106, 311 (2002).
- MacDonald et al. (2003) K. F. MacDonald, V. A. Fedotov, and N. I. Zheludev, Appl. Phys. Lett. 82, 1087 (2003).
- Pochon et al. (2004) S. Pochon, K. F. MacDonald, R. J. Knize, and N. I. Zheludev, Phys. Rev. Lett. 92, 145702 (2004).
- Bernasconi et al. (1995) M. Bernasconi, G. L. Chiarotti, and E. Tosatti, Phys. Rev. B 52, 9988 (1995).
- Fedotov et al. (2004) V. A. Fedotov, V. I. Emel’yanov, K. F. MacDonald, and N. I. Zheludev, J. Opt. A: Pure Appl. Opt. 6, 155 (2004).
- Peters et al. (1997) K. F. Peters, Y.-W. Chung, and J. B. Cohen, Appl. Phys. Lett. 71, 2391 (1997).
- Parravicini et al. (2003) G. B. Parravicini, A. Stella, P. Tognini, P. G. Merli, A. Migliori, P. Cheyssac, and R. Kofman, Appl. Phys. Lett. 82, 1461 (2003).
- Wautelet (2004) M. Wautelet, J. Phys.: Condens. Matter 16, L163 (2004).
- Petropoulos et al. (2001) P. Petropoulos, H. S. Kim, D. J. Richardson, V. A. Fedotov, and N. I. Zheludev, Phys. Rev. B 64, 193312 (2001).
- Cicco (1998) A. D. Cicco, Phys. Rev. Lett. 81, 2942 (1998).
- Defrain (1977) A. Defrain, J. Chim. Phys. 74, 851 (1977).
- Bosio (1978) L. Bosio, J. Chem. Phys. 68, 1221 (1978).
- Kuzmenko et al. (1991) V. M. Kuzmenko, V. A. Shklovskij, and A. N. Vladychkin, J. Non-Cryst. Solids 130, 319 (1991).
- Guo et al. (2000) C. Guo, G. Rodriguez, A. Lobad, and A. J. Taylor, Phys. Rev. Lett. 84, 4493 (2000).