Absence of an isotope effect in the magnetic resonance in high- superconductors
Abstract
An inelastic neutron scattering experiment has been performed in the high-temperature superconductor to search for an oxygen-isotope shift of the well-known magnetic resonance mode at 41 meV. Contrary to a recent prediction (I. Eremin, et al., Phys. Rev. B 69, 094517 (2004)), a negligible shift (at best +0.2 meV) of the resonance energy is observed upon oxygen isotope substitution (16OO). This suggests a negligible spin-phonon interaction in the high- cuprates at optimal doping.
pacs:
PACS numbers: 74.25.Ha 74.72.Bk, 25.40.FqIn conventional superconductors, pairing between electrons is mediated by lattice vibrationsBCS . This has been demonstrated by an isotope effect on the superconducting (SC) transition temperature, . In high- copper oxides superconductors exhibits a weak shift at optimal doping upon isotope substitution franck which increases at lower doping. In particular, the oxygen-isotope shift (16OO) has been extensively studiedzhao ; pringle ; williams . At optimal doping, a small isotope-effect exponent is deduced much lower than the value expected from pure electron-phonon interaction, casting some doubt on a superconducting mechanism mediated by phonons. Further, the proximity of the antiferromagnetic (AF) insulating state and the unconventional -wave symmetry of the SC gap favored mechanisms for high Tc superconductivity where electron-electron (el-el) interactions predominate. However, there has been a revival of interest in electron-phonon coupling as several experiments point towards a non-negligible electron-phonon interactionlanzara ; keller ; gweon . In particular, the “kink” change of slope of electronic dispersion observed around 70 meV by angle-resolved photoemission spectroscopy (ARPES) along the nodal direction in various cuprates could be interpreted as an electronic coupling to a phonon mode lanzara . As a matter of fact, various physical properties such as penetration depthkeller or ARPES spectra gweon display relatively large isotope effects thus highlighting the open question: what can be the role of phonons in determining the superconducting properties of cuprates?
On the other hand, the spin excitation spectrum of the copper oxide superconductors is particularly rich. Above , magnetic fluctuations are mainly observed around the planar wavevector characteristic of antiferromagnetism (AF) in the undoped parent compounds rossat ; bourges ; fong00 ; dai01 . Below , a collective magnetic mode, referred to as the “resonance peak”, appears at a well-defined energyrossat ; fong95 ; bourges ; fong00 ; dai01 ; Sidis03 at and exhibits strong dispersions for wavevectors around Bourges-science ; Pailhes04 ; Reznik04 . This mode is now observed in all high- superconductors systems studied by inelastic neutron scattering (INS) experiments rossat ; fong99 ; he02 whose maximum reaches 90 K. Recently, an analogous feature has even been reported in the single-layer material as welljmt04 . Depending, or not, whether the magnetic fluctuations are observed in the normal state, the resonance peak either corresponds to a modification of magnetic spectrum in both momentum and energy (in underdoped cuprates) bourges ; fong00 ; dai01 or simply emerges from the magnetic electron-hole continuum (in optimally doped and overdoped cuprates) Sidis03 ; Reznik04 ; Pailhes03 .
This mode is typically assigned to an excitonic bound state in the superconductivity-induced gap in the spectrum of electron-hole spin-flip Stoner excitations vdM ; Liu95 ; Millis96 ; chubukov ; Onufrieva02 ; norman ; abanov ; Eremin ; Eremin04 . Within that framework, the resonant mode is a direct consequence of unconventional superconductivity of -wave symmetry occurring in the high- copper oxides. This approach is particularly suited for optimally doped superconductors where normal-state magnetic fluctuations are consistent with a broad magnetic electron-hole continuum. Further, the most recent neutron developments Pailhes04 allow ”silent bands” (where the magnetic collective mode is overdamped) to be related to the detailed momentum shape of the Stoner continuum expected from the Fermi surface topology and the -wave superconducting order parameter. This connection has been explicitly assigned in ref. Eremin04 . This spin exciton mode can be derived from an effective Hamiltonian Onufrieva02 ; Eremin . Within that model, an interesting proposal has been made Eremin that magnetic properties could display significant isotopic effects if both the hopping integral, , and the superexchange interaction between neighboring spins, , are renormalized by phonons. By changing the oxygen isotope 16O by 18O, they predict a change of the resonance peak position of a few meV, mostly due to a re-normalization of the hopping integral.
Thus, by measuring the isotope dependence of the position of the resonance peak, INS could provide direct evidence for the presence of the electron-phonon coupling in cuprates. In contrast, we here report the probable absence of an isotope effect in the magnetic resonance peak in (YBCO).
The inelastic neutron experiment was performed on the 1T spectrometer at Laboratoire Léon Brillouin (LLB) in Saclay. The spectrometer used a vertically and horizontally focusing monochromator and analyzer, comprising Cu (111) crystals and pyrolytic graphite (PG002) crystals, respectively. The measurements were performed with a fixed final neutron energy of 30.5 meV. A filter was inserted into the scattered beam in order to eliminate higher order contamination. The crystals were oriented such that momentum transfers of the form were accessible. We use a notation in which is indexed in units of the tetragonal reciprocal lattice vectors Å-1 and Å-1.
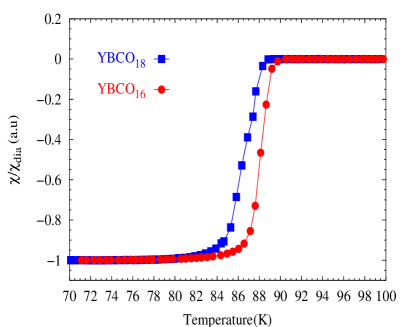
High-quality single crystals of , of typical mass 0.1-0.2 g, were prepared. They have been separated in two distinct sets of similar total mass ( 0.6 g). The two batches of samples were mounted in a furnace in separate quartz tubes side by side to ensure identical thermal history. One tube was charged with high purity 16O oxygen gas while the other was charged with 99% 18O enriched oxygen. After annealing for 24 hours at 830 ∘C the pair of tubes was removed, evacuated, recharged and reannealed for a total of 10 exchanges to ensure maximal isotope exchange. Both sample sets were then slow cooled over 48 hours to 550 ∘C then annealed there for 10 days to ensure the same uniform oxygenation of the chains. The samples were lightly underdoped as confirmed by thermoelectric power measurementsObertelli . Based on previous annealing experience for YBCO ceramics and crystalsjeff we expect the samples to have an oxygen content of 6.89 and an underdoped hole concentration of 0.145. The magnetic susceptibility for each individual sample has been measured by a SQUID ( superconducting quantum interference device) magnetometer. The crystals for each individual sample were then aligned on two distinct arrays (referred hereafter as S16 and S18) of similar volume, each array being made of about four single crystals. The magnetic susceptibility measurements of each sample mounting are shown on Fig. 1: one can identify the onset of the superconducting transition at 90 K for S16 and 88.8 K for S18. A difference in of -1.2 K is then observed between both samples. It is actually larger than the reduction expected from the usual isotope effect which is about -0.77 0.2 K for similarly-doped YBCO pringle . The slight excess in isotopic shift in is possibly significant and may suggest a slightly lower oxygen content and doping state for the 18O sample, despite the attempt to ensure identical thermal histories. To address this issue, we further determined the -lattice parameter of both samples. Accurate measurements using the triple axis 4F1 spectrometer installed on a cold source at LLB yield = 11.674 Å 0.004 for S16 and = 11.678 Å 0.004 for S18. These -lattice parameters are consistent with an oxygen content of about =0.89jorgensen ; cava , and given the slope Åjorgensen ; cava , indicates that the 18O sample has a possible lower oxygen content by . Thus, it is in agreement with the possibility that part of the difference in for each sample is related to a slight difference in doping. Using the relationship between oxygen content and the hole dopingjeff , this would correspond to a difference of =0.004 0.006 in doping.
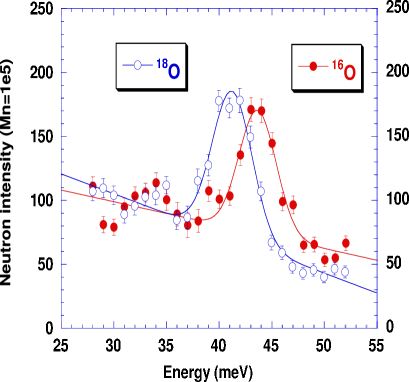
In order to check the isotope exchange process, we performed Raman scattering at room temperature as well as INS measurements of a particular oxygen phonon mode. The three oxygen modes observed in Raman scattering, namely the -axis vibration of the apical oxygen and the in-phase and out-of-phase oxygen vibrations in the CuO2 plane, revealed isotopic shifts to lower energy in 18O sample with respect to the 16O sample. Assuming that they are pure oxygen modes, the fraction of exchanged oxygen is y. Being a surface-sensitive technique, Raman scattering does not indicate if the isotope exchange occurred within the bulk of the samples. This might be problematic as oxygen diffusion is very slow. We then measured with inelastic neutron scattering a particular phonon mode whose eigenvector is predominantly related to a vibration along the c axis of the oxygens of the CuO2 planefong95 . This phonon mode, measured at =(-0.5,-0.5,10.3) where its structure factor is larger, is found at 43.6 0.1 meV in S16 and 41.3 0.1 meV in S18 (Fig. 2). Again assuming that the phonon is a pure oxygen mode, this corresponds to an isotope exchange of =0.92 0.08. In fact, the eigenvector for that specific mode corresponds to about 90 % weighting by the oxygen atoms. Therefore, the energy shift of the phonon measured in INS is fully consistent with the nearly full oxygen exchange deduced from the Raman data. The oxygen exchange thus occurred throughout the bulk of the material thus confirming the sample homogeneity.
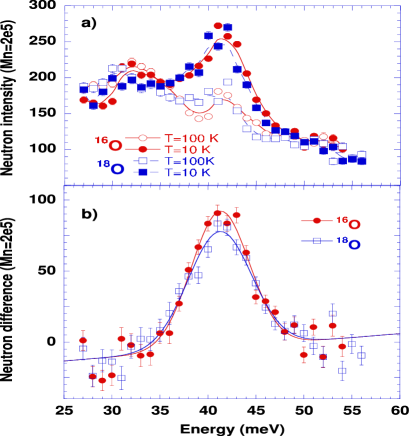
We now turn to the central result of this report. Following previous studies fong95 ; bourges ; Pailhes04 ; Reznik04 , we identify the resonant magnetic mode by constructing, for each sample, the difference between constant- scans measured at 12 K () and 100 K () and at the wave vector =(-0.5,-0.5,5.1). The magnetic resonant mode in both samples is shown in Fig. 3.b as well as the raw energy scans for both samples in Fig. 3.a. At T=100 K, the background, which displays the same phonon mode as the mode shown in Fig. 2 but with much weaker intensityfong95 , is also shifted upon the isotope substitution. This phonon is known to exhibit no temperature dependence across . Further, the phonon scattering structure factor for the chosen wavevector with =5.1 is reduced enough that the background subtraction procedure in the determination of the resonance peak energy, its broadening and its amplitude does not affect significantly the observed difference of Fig. 3.b. The resonance peak energy is found at 0.12 meV in S16 and 0.12 meV in S18. The two energies are therefore not distinguishable within errors. The two peaks exhibit a slight difference in amplitude as well as in width (7.1 0.3 meV for S16 and and 7.8 0.3 meV for S18). In principle, the observed width is not intrinsic but is controlled by the convolution product of dispersive excitations around with the spectrometer resolution Bourges-science ; Pailhes04 . The product of the peak amplitude by its width in Fig. 3.b, representing the magnetic resonant spectral weight at , is similar in both samples within errors. Using the spectral weight of the phonon presented in Fig. 2, one can calibrate the absolute magnetic intensity of the resonance peakfong95 ; fong00 . For both samples, we deduce an energy-integrated magnetic spectral weight of 2.60.4 at the wavevector, or 0.060.01 for energy- and q-integrated magnetic spectral weight in agreement with a previous report for a similar doping levelfong00 .
We then basically observe no isotope effect of the magnetic resonance peak: . To be complete, there is however the possibility of a slight difference in doping between the two samples which might induce a slight change in the resonance energy if the resonance energy is proportional to , as it is typically observed bourges ; fong00 . (To what accuracy this proportionality strictly applies is still an open question). According to this empiric relation, the resonance peak energy could be renormalized by about 0.5% in the 18O sample as compared with the 16O sample, i.e. an energy shift of -0.18 meV. In such a case, an isotope effect can be estimated of +0.23, yielding an isotope exponent of . Therefore, the isotope shift of the resonance peak energy can be at most 0.23 meV 0.2 meV. The deduced isotope-effect on the resonance peak is then very small and actually similar in magnitude to the small isotope effect of the superconducting transition for optimally doped cuprates, franck , although with an opposite sign. It should be noticed that the overall effect might be simply overshoot by the difference in doping between both samples.
The absence of an isotope effect on the resonance energy is actually quite surprising as, in the spin exciton model, the bound state energy is very sensitive to both band structure, via the hopping integrals ,…, and the interactions, . Within a random-phase approximation (RPA) scheme, the resonance energy at the AF wavevector is usually defined as the pole of the interacting susceptibility, Liu95 ; Millis96 ; chubukov ; Onufrieva02 ; norman ; abanov ; Eremin ; Eremin04 , where is the bare spin susceptibility of a -wave superconductor. The interaction can be either the superexchange interactionsLiu95 ; Millis96 ; norman ; Onufrieva02 ; Eremin , at , or some spin-fermion coupling abanov ; chubukov ; Eremin04 . Looking in more detail at the pole condition, one clearly sees that a shift in and in have opposite effects on the resonance energy : if the interaction is reduced, the resonance energy will increase whereas if the band hopping integral is reduced the resonance energy will decrease. Using such a model, Eremin et alEremin expected a shift of about -2 meV of the resonance peak from 16O to 18O, corresponding to . That was because the band structure hopping integral is thought to be the quantity strongly dependent on the electron-phonon coupling. As the observed has an opposite sign (if any) of the theoretical prediction Eremin , it is doubtful that the electron-phonon coupling is renormalizing the band structure hopping integral. Within that model, one can nevertheless explain the observed positive sign of by a small renormalization of the interaction rather than . Our maximum estimate of meV would typically yield - 0.4 %, in agreement with the expected impact of the interactions termEremin . More specifically, if the interaction is assigned to the AF superexchange, we obtained an isotopic change of compatible with the one, - 0.6 % zhao , deduced from the Néel temperature in undoped cuprates. Finally, this simple analysis of the tiny shift (if any) of the resonance peak energy in term of the spin-exciton model shows that the various microscopic terms entering in its expression do not exhibit a strong isotope effect, thus placing a severe limit on the role of electron-phonon coupling in high- cuprates.
In conclusion, using inelastic neutron scattering experiments, we observe no significant shift of the magnetic resonance peak energy in YBCO upon substitution of oxygen 16O by its isotope 18O. In contrast to previous claims, this suggests that the spin-phonon coupling is negligible in high- cuprates near optimal doping. The absence of a measurable effect on the INS resonance mode does not however exclude the possibility that isotope substitution can have a noticeable effect on the magnetic properties at much lower doping.
We thank Ilya Eremin and M.V. Eremin for stimulating discussions, alerting us to possible isotope effects in the resonance energy.
References
- (1)
- (2) [∗] To whom correspondence should be addressed; E-mail: bourges@llb.saclay.cea.fr
- (3) J. Barden, L.N. Cooper and J.R. Schrieffer, Phys. Rev. 108, 1175 (1957).
- (4) J.P. Franck et al., in Physical Properties of High Temperature Superconductors IV (ed. D.M. Ginsberg), 189, (World Scientific, Singapore, 1994).
- (5) G.-M. Zhao, K.K. Singh, and D.E. Morris, Phys. Rev. B 50, 4112 (1994); G.-M. Zhao et al., J. Phys.: Condens. Matter 13, 569, (2001); G.-M. Zhao et al., Nature 385, 236 (1997).
- (6) D.J. Pringle, G. V. M. Williams, and J. L. Tallon, Phys. Rev. B 62, 12527 (2000).
- (7) G. V. M. Williams, J. L. Tallon, J. W. Quilty, H. J. Trodahl, and N. E. Flower, Phys. Rev. Lett. 80, 377 (1998).
- (8) A. Lanzara et al., Nature 412, 510, (2001).
- (9) R. Khasanov, D.G. Eshchenko, H. Luetkens, E. Morenzoni, T. Prokscha, A. Suter, N. Garifianov, M. Mali, J. Roos, K. Conder, and H. Keller, J. Phys.: Condens. Matter 15, L17 (2003).
- (10) G.-H. Gweon et al., Nature 430, 187, (2004).
- (11) J. Rossat-Mignod et al., Physica C 185-189, 86 (1991); H.A. Mook et al., Phys. Rev. Lett. 70, 3490 (1993).
- (12) P. Bourges, inThe Gap Symmetry and Fluctuations in High Temperature Superconductor s, (eds. by J. Bok, G. Deutscher, D. Pavuna, and S. A. Wolf), 349, (Plenum Press, New York, 1998), (cond-mat/9901333).
- (13) H.F. Fong, P. Bourges, Y. Sidis, L.P. Regnault, J. Bossy, A.S. Ivanov, D.L. Milius, I.A. Aksay, and B. Keimer, Phys. Rev. B 61, 14773 (2000).
- (14) P. Dai et al., Phys. Rev. B 63, 054525 (2001).
- (15) H.F. Fong et al., Phys. Rev. B 54, 6708 (1996).
- (16) For a recent review: Y. Sidis et al., Phys. Stat. Sol. (b) 241, 1204, (2004) (cond-mat/0401328).
- (17) P. Bourges, Y. Sidis, H.F. Fong, L.P. Regnault, J. Bossy, A.S. Ivanov, and B. Keimer, Science 288, 1234 (2000).
- (18) S. Pailhès et al., Phys. Rev. Lett. 93, 167001 (2004).
- (19) D. Reznik et al., Phys. Rev. Lett. 93, 207003 (2004).
- (20) H.F. Fong, P. Bourges, Y. Sidis, L.P. Regnault, A.S. Ivanov, G.D. Gu, N. Koshizuka and B. Keimer, Nature 398, 588 (1999).
- (21) H.F. He et al., Science 295, 1045 (2002).
- (22) J.M. Tranquada et al., Phys. Rev. B 69, 174507 (2004).
- (23) S. Pailhès et al., Phys. Rev. Lett. 91, 237002 (2003).
- (24) D. van der Marel, Phys. Rev. B 51, 1147 (1995).
- (25) D. Z. Liu, Y. Zha, and K. Levin, Phys. Rev. Lett. 75, 4130 (1995).
- (26) A.J. Millis, H. Monien, Phys. Rev. B 54, 16172 (1996).
- (27) A. Abanov, and A.V. Chubukov, Phys. Rev. Lett. 83, 1652 (1999).
- (28) F. Onufrieva, P. Pfeuty, Phys. Rev. B 65, 054515 (2002).
- (29) Ar Abanov, A. V. Chubukov, M. Eschrig, M. R. Norman, and J. Schmalian, Phys. Rev. Lett. 89, 177002 (2002).
- (30) M. Eschrig, M.R. Norman, Phys. Rev. Lett. 89, 277005 (2002).
- (31) I. Eremin, O. Kamaev and M. V. Eremin, Phys. Rev. B 69, 094517 (2004).
- (32) I. Eremin, D. K. Morr, A. V. Chubukov, K. H. Bennemann, and M. R. Norman, Phys. Rev. Lett. 94, 147001 (2005).
- (33) S.D. Obertelli, J.R. Cooper and J.L. Tallon, Phys. Rev. B 46, 14928 (1992).
- (34) J.D. Jorgensen, B.W. Veal, A.P. Paulikas, L.J. Nowicki, G.W. Crabtree, H. Claus, and W.K. Kwok, Phys. Rev. B 41, 1863 (1990).
- (35) R.J. Cava, A. W. Hewat, E. A. Hewat, B. Batlogg, M. Marezio, K. M. Rabe, J. J. Krajewski, Physica C 165 419 (1990).
- (36) J.L. Tallon, C. Bernhard, H. Shaked, R. L. Hitterman, and J. D. Jorgensen, Phys. Rev B. 51, 12911 (1995).