Infinite average lifetime of an unstable bright state
in the green fluorescent protein
Abstract
The time evolution of the fluorescence intensity emitted by well-defined ensembles of Green Fluorescent Proteins has been studied by using a standard confocal microscope. In contrast with previous results obtained in single molecule experiments, the photo-bleaching of the ensemble is well described by a model based on Lévy statistics. Moreover, this simple theoretical model allows us to obtain information about the energy-scales involved in the aging process.
pacs:
05.40.Fb, 87.15.Mi, 02.50.Ey, 33.15.HpSince the beginning of the 90’s, single molecule experiments have opened the way to the study of the optical properties of a single emitter Moerner et al. (1999). In particular, these experiments have evidenced that an aging mechanism affects fluorescent objects: each marker performs only a finite number of absorption/spontaneous emission cycles before definitely reaching a permanent photo-bleached dark state Dickson et al. (1997). Before being irreversibly photo-bleached, single emitters often display a ”blinking” behavior: as the time goes on the system undergoes transitions between a bright state (ON state in which it stays a time ) and a reversible dark state (OFF state in which it stays a time )Nirmal et al. (1996). In a single molecule experiment one can measure the light emitted by a single marker as a function of time and then characterize the blinking and photo-bleaching behaviors. The study of a multitude of single systems gives access to the probability distribution associated to their emission properties, for instance the statistical distribution of emission spectra Barkai et al. (2000, 2003) or the probability distribution associated to and Brokmann et al. (2003); Margolin et al. (2005). In this way it is possible to obtain more complete information with respect to an ensemble measurement. Such a strategy works well in the case of inorganic emitters (i.e. semiconductor quantum dots). In this case the observation time of a single object (limited by photo-bleaching) is long enough to obtain a large number of measurements and therefore meaningful histograms. Moreover, such systems allow the implementation of parallel measurements on some hundreds of single emitters (wide field microscopy) opening the way to study the ergodicity of such systems Brokmann et al. (2003); Margolin et al. (2005). Several experiments show that the and are distributed according to broad laws Shimizu et al. (2001); Brokmann et al. (2003). Let us stress that a long observation time is crucial for a complete characterization of such broad distributions, due to the intrinsic large dispersion of the measured data. In the case of single organic molecules, the observation time is strongly reduced by quenching phenomena. This fast photo-bleaching is a limiting factor for the obtention of reliable statistical distributions except in special cases of well controlled environment Pfab et al. (2004). A particularly interesting case of organic markers is that of fluorescent proteins such as the Green Fluorescent Protein (GFP) which is one of the most popular marker for in vivo imaging in cell biology Tsien (1998). Single molecule room temperature studies on GFP show results that are compatible with an aging mechanism governed by narrow statistical laws (exponential or bi-exponential). With this assumption it is possible to determine average values such as , and the characteristic time associated with the irreversible transition between the fluorescent and the dark state (the average photo-bleaching time) Peterman et al. (1999). Reported average photo-bleaching times for fluorescent proteins are of the order of some hundreds of millisecond, depending on excitation intensity Harms et al. (2001). Therefore single molecule experiments seem to evidence a fundamental difference between inorganic and organic emitters: the times associated to aging are distributed according to broad versus narrow laws. However, the presence of Lévy statistics cannot be excluded if we consider the poor quality of the histograms obtained in the case of proteins.
The question that we address in this letter is : Can one find signatures of Lévy statistics in ensemble measurements in the case of fluorescent proteins? The analysis of the time evolution of the fluorescence intensity emitted by a well defined ensemble of GFP under c.-w. excitation shows that this is the case. Starting from ensemble measurements, we evidence that the GFP aging process is governed by Lévy statistics. Moreover, information about the potential barriers involved in the aging phenomenon is extracted from the experiment, thanks to a theoretical model that takes into account an irreversible photo-conversion between a fluorescent and a permanent dark state. One of the main results of this study is that the unstable bright state has an infinite mean lifetime.
In the experiment, conceptually very simple, we have recorded the time evolution of the fluorescence intensity emitted by a well-defined ensemble of a GFP mutant (uv mutant : GFPuv Crameri et al. (1995)) under continuous excitation. The sample is obtained by dispersing a recombinant GFPuv solution (125 M in a pH=8 buffer solution) in a polyacrylamid matrix footnote1 . To avoid denaturation, the protein solution is added after polymerization. The final concentration in the anhydrous samples is around molecules per m3. The sample is placed on a slide-holder of a home-built confocal microscope illuminated by an Ar-ion laser (=457 nm, 0.01intensity 2 MW/cm2). A microscope objective of numerical aperture 0.65 (x40) leads to a theoretical lateral resolution of approximately 300 nm. The detection pin-hole has a radius of 10 m. Our ensemble is then defined by the 200000 immobile molecules present in a detection volume of 0.5 . The emitted fluorescence is detected by a photo-multiplier in current mode coupled to a lock-in amplifier. Let us stress that, in order to have reliable results, the ensemble of excited molecules must not be renewed during the whole observation time. We have tested the long-term mechanical stability of our setup and verified that it is of the order of the lateral resolution of the microscope.
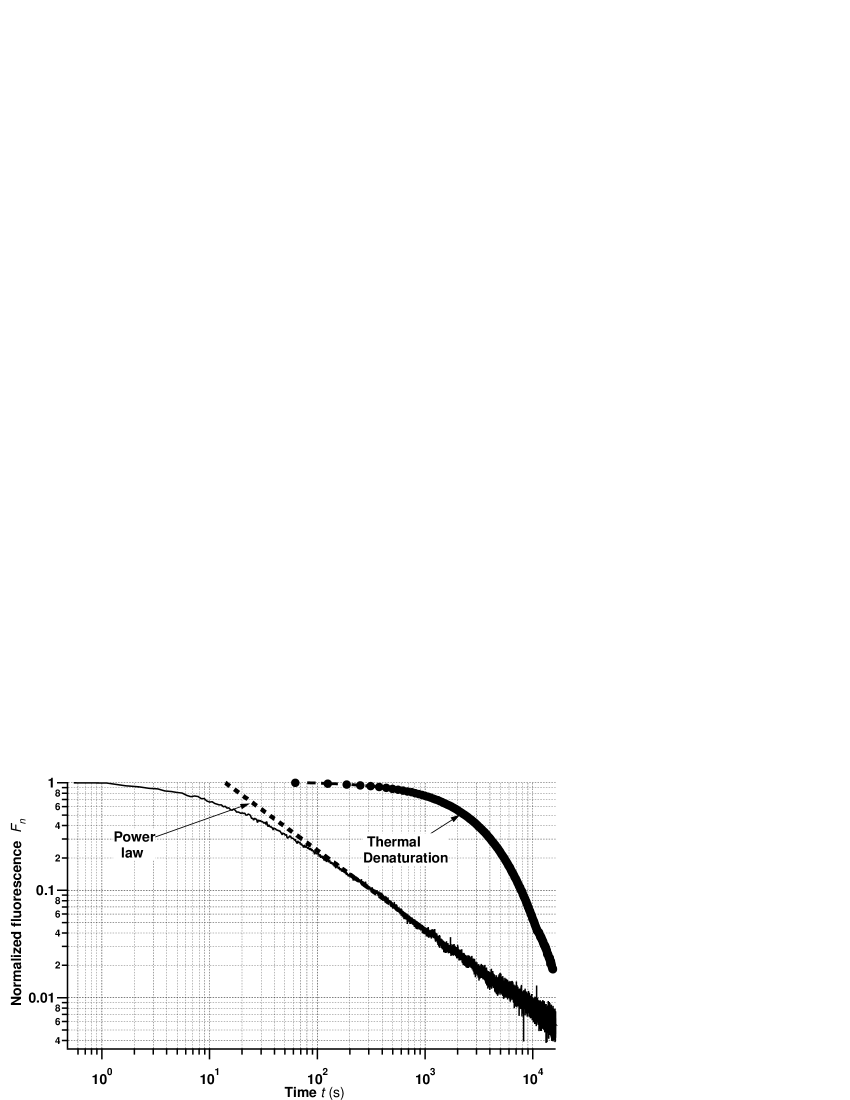
In Fig. 1 we present the observed time evolution of as a function of the total illumination time . All the ensembles that we have studied under different illumination conditions display a time evolution of with a long-time tail well described by a power law characterized by an exponent . Let us stress that in order to unambiguously identify the asymptotical power law behavior of it is compulsory to scan several decades in time with a good detector dynamics. The aging described by the curve appears to be an irreversible phenomenon that depends on the illumination history of the ensemble. To investigate this phenomenon, we switched-off the illumination at time and kept the sample in the dark during a time . By switching-on again the illumination, recovered its value at for up to 24 hours. We conclude that the unique relevant parameter for the description of the aging curves is the total illumination time . These observations show that the transition between the fluorescent and the permanent dark state takes place in the electronic excited state of the protein. One may argue that the observed aging curve is the consequence of the thermal denaturation of the protein induced by laser-heating Penna et al. (2003). We have excluded this hypothesis by performing several measurements of thermal denaturation in a temperature-controlled cuvette under low intensity illumination (uv lamp in a fluorimeter). A significant thermal denaturation of GFPuv is clearly observed for temperatures higher than 340 K, but this phenomenon induces a purely exponential loss of the fluorescence as a function of time (see Fig. 1).
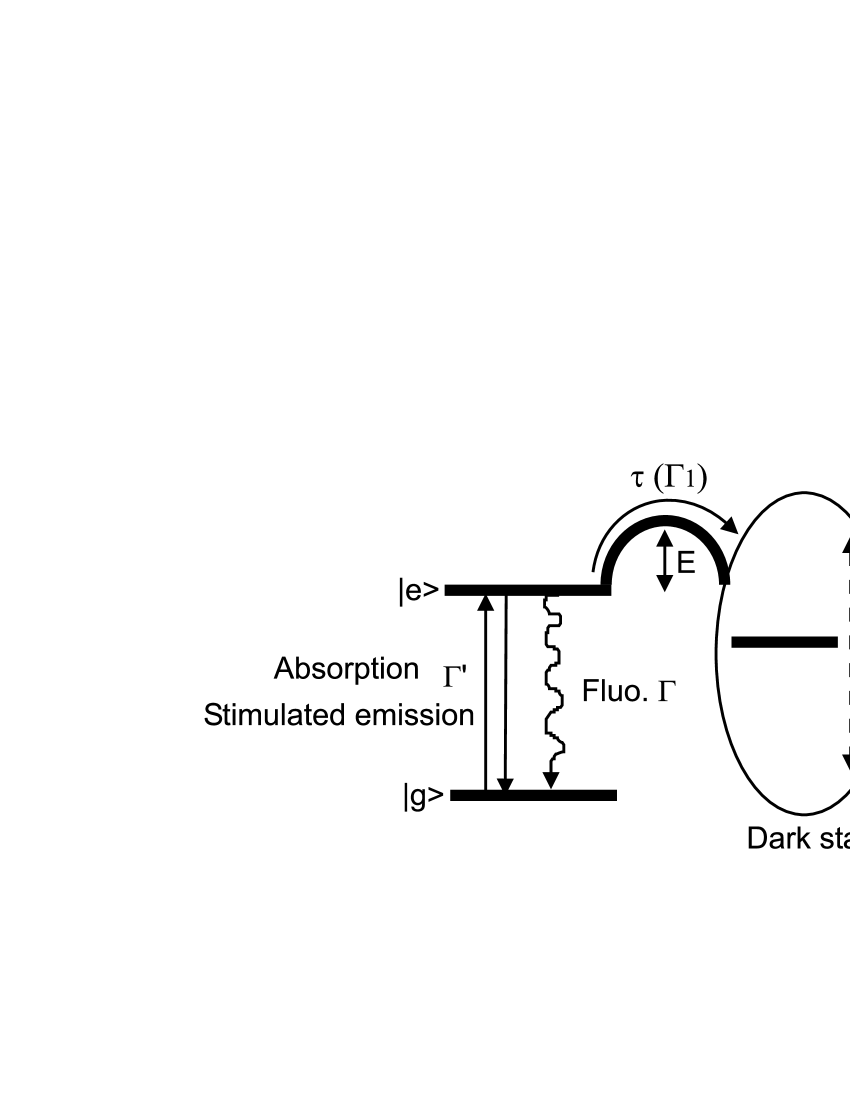
In order to describe the experimental results, we propose a model that postulates the presence of Lévy statistics in the irreversible transition between the fluorescent and the dark state of the protein. Within this model, photobleaching is the consequence of the thermally activated crossing of a barrier in the electronic excited state of the protein (see scheme in Fig. 2).
We make the hypothesis that the heights of the barriers in a sample are distributed according to an exponential law , where is the characteristic height of the barriers. The time associated to the crossing of the barrier of height is then given by the Arrhenius law , where is a characteristic time, the Boltzmann constant and the temperature. By considering that , it is easy to show that, for ,
| (1) |
with Bardou et al. (2002). With these assumptions, the asymptotic fluorescence at time is simply proportional to the number of proteins that have a bright state lifetime (time spent by the protein performing absorption/spontaneous emission cycles) greater than the time . The fluorescence is thus proportional to the survival probability of the molecules in the fluorescent state: . At long times we expect that , which exactly corresponds to the experimental observations. Within this model, the fact that the observed coefficient is lower than 1 has a fundamental consequence: the existence of an unstable bright state with infinite mean lifetime. The bright state is unstable in that, at long times, each molecule ends up in a permanent dark state with a probability tending to one. The mean lifetime is infinite in that the ensemble average of the time (time of jump to the dark state or photobleaching time) is infinite.
Let us develop now the model more in detail. The three relevant states (scheme in Fig. 2) are coupled by the absorption and the stimulated emission (rate ), the spontaneous emission (rate ), and the bleaching process which ends in the dark state (rate ). By fixing the excitation intensity ( ) and the rate , we can solve a system of coupled differential rate equations that gives us the time-dependent population in the state. As long as we are not interested in the short-time behavior (fast equilibration of electronic populations) we obtain, for , the simplified expression:
| (2) |
In order to compare the model with the experiments, two fundamental ingredients have to be added to it: the spatial distribution of the excitation intensity (typically a gaussian laser spot with characteristic dimension ) and the stochasticity associated to the rate .
The first aspect has been discussed by A. J. Berglund in a theoretical paper Berglund (2004) that addresses the case of the samples illuminated by intensity profiles which span an infinite object plane. In this case, a gaussian laser spot and a simple model for the photobleaching (e.g. rate constant) lead to a time evolution of with a long time tail that decays according to the power law Berglund (2004). At first sight, this result seems to apply to our experimental observations. However in our experiment (and, more generally, in the experiments performed in a confocal geometry) the detection volume is limited by the pin-hole aperture: the pertinent intensity distribution is therefore a truncated gaussian. The consequence of this truncation is that, for distributed according to a narrow distribution law, displays an asymptotic exponential behavior. We have checked by numerical integration of equation (2) that, for realistic sizes of detection pin-holes (i.e. , the spatial distribution of the excitation intensity can only influence the details of the curve at intermediate times but not its asymptotic behavior.
The properties of the statistical distribution of seem therefore to be the key element to understand the observed behavior. In order to introduce this stochasticity, we have to consider the ensemble average of (2): . By introducing the power-law distribution (1) we obtain:
where is the lower incomplete gamma function. For this expression becomes:
| (3) |
where is the gamma function. Therefore, with the assumption of a power law distribution (1) for the bleaching time , the fluorescence emitted by a well-defined ensemble of proteins decays asymptotically according to a power law (). As mentioned before, this behavior can be understood by considering that at time the term represents the survival probability of the system in the fluorescent state. This same argument of survival probability allows us to obtain, from the measured signal , precious information about the distribution function of the barriers without the explicit hypothesis of an exponential law. Let us write in terms of an ensemble average of the conditional probability to have a lifetime with a barrier of height :
| (4) |
(we note for ). The expression (4) can be analytically evaluated if we replace the Poisson process associated to the Arrhenius law with a deterministic process footnote2 . In this case with noting the Heaviside function, and (4) becomes
| (5) |
This expression can be easily inverted:
| (6) |
where, again, is such that .
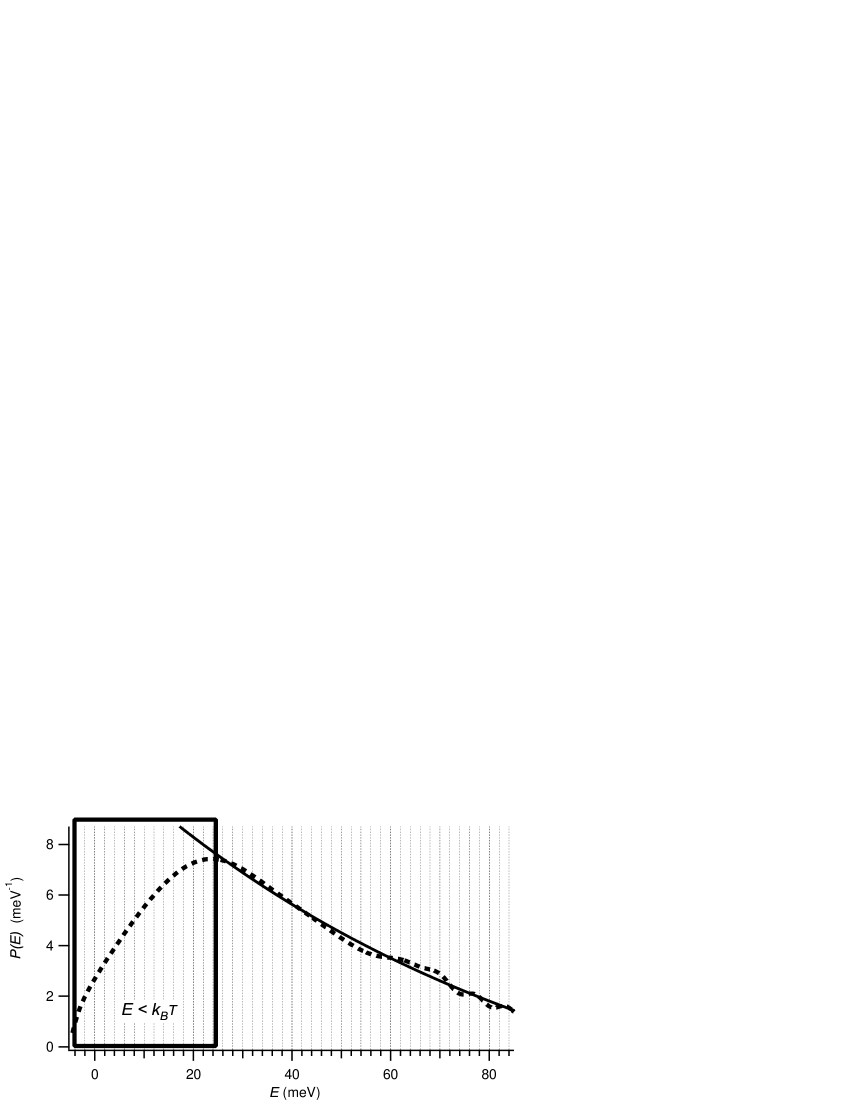
We can apply such a mathematical transformation to the experimental data of Fig. 1 and the result is represented in Fig. 3. For energies , the distribution deduced from the signal (dotted line) is well approximated by an exponential law (continuous line). This result strengthens the hypothesis of an exponential distribution of the barrier heights which was previously introduced as a postulate. For energies the retrieved distribution does not follow an exponential law. This behavior is not surprising because the Arrhenius law is no more valid for (i.e. for ). Let us stress that the horizontal energy scale in Fig. 3 is obtained in the absence of free parameters. Moreover, the order of magnitude that we obtain for the energy barrier heights is in the typical range expected for conformational changes of biomolecules.
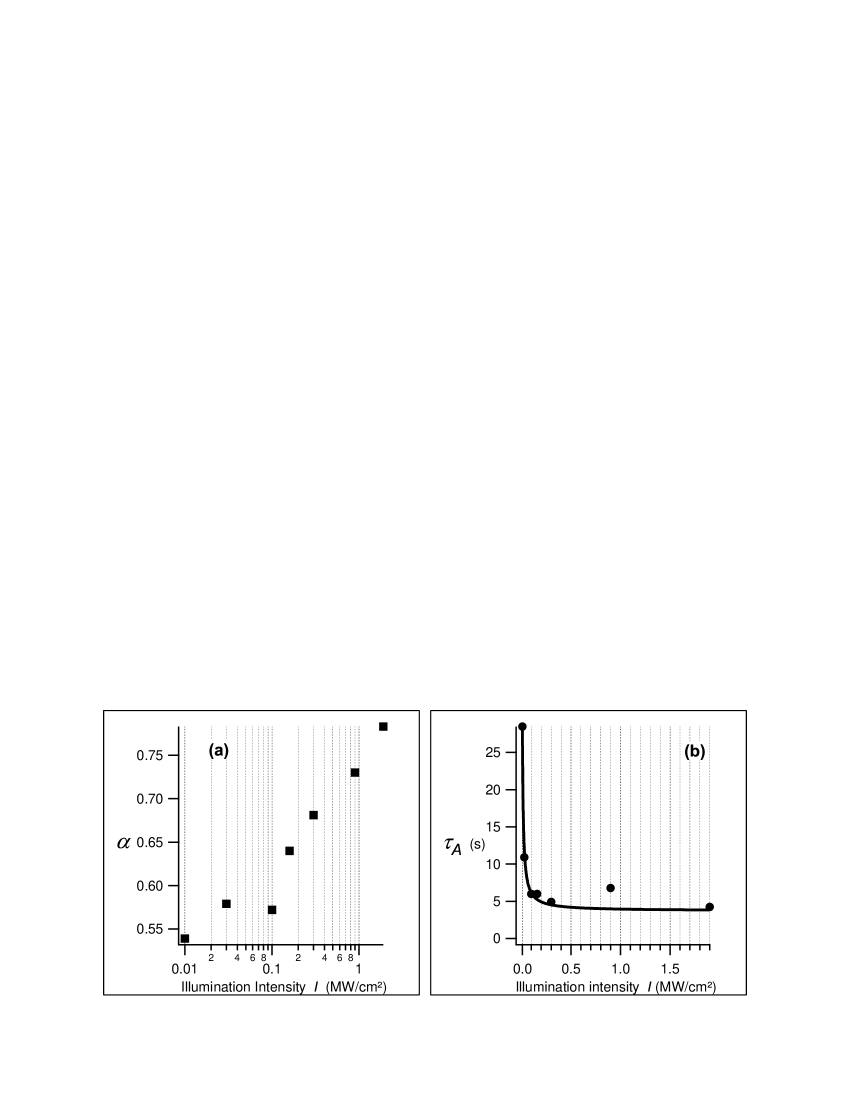
Let us finally analyze the experimental results obtained for several excitation intensities with different ensembles of proteins. In order to eliminate the possible local fluctuations of GFP concentration, we consider the normalized quantity . As previously mentioned, for each the asymptotic time evolution of is well described by an empirical law . The parameters and , measured as a function of , are reported in Fig. 4. The exponent increases slightly (with a logarithmic law) with (Fig. 4a). The pre-factor (filled circles in Fig. 4b) follows an inverse saturation law (the continuous line in Fig. 4b is the best fit to this law). The logarithmic behavior of is not explained by our model in which only depends on the temperature. On the contrary, the expression (3) accounts for the observed dependency of the pre-factor . Indeed, by considering the normalized excited state population , we obtain from expression (3) that . By considering that , we obtain the empirical law that we used in Fig. 4b to fit the experimental data.
In conclusion, we have found experimental evidence of the fact that the photobleaching of a well-defined ensemble of Green Fluorescent Proteins is governed by Lévy statistics. The model that we have developed is based on an irreversible thermally-activated conversion between an excited electronic state and a dark state. This model allows us to explain the observed temporal decay of the fluorescence. Moreover, it gives us quantitative information about the probability distribution of the barrier heights involved in the aging mechanism. Within this simple model the exponent should only depend on temperature. Further experiments, beyond the scope of this paper, will investigate this dependence and the observed logarithmic dependence of the coefficient.
Acknowledgements.
We thanks C. Brochon, F. Linker and E. Weiss for their help in samples preparation; J.-Y. Bigot and O. Crégut for useful discussions; M. Albrecht for technical support.References
- Moerner et al. (1999) W. E. Moerner, and M. Orrit, Science 283, 1670 (1999).
- Dickson et al. (1997) R. M. Dickson, A. B. Cubitt, R. Y. Tsien, and W. E. Moerner, Nature 388, 355 (1997).
- Nirmal et al. (1996) M. Nirmal et al., Nature 383, 802 (1996).
- Barkai et al. (2000) E. Barkai, R. Silbey, and G. Zumofen, Phys. Rev. Lett. 84, 235339 (2000).
- Barkai et al. (2003) E. Barkai et al., Phys. Rev. Lett. 91, 075502 (2003).
- Brokmann et al. (2003) X. Brockmann et al., Phys. Rev. Lett. 90, 120601 (2003).
- Margolin et al. (2005) G. Margolin, and E. Barkai, Phys. Rev. Lett. 94, 080601 (2005).
- Shimizu et al. (2001) K. T. Shimizu et al., Phys. Rev. B 63, 205316 (2001).
- Pfab et al. (2004) R. J. Pfab et al., Chem. Phys. Lett. 387, 490 (2004).
- Tsien (1998) R. Y. Tsien, Ann. Rev. Biochem. 67, 509 (1998).
- Peterman et al. (1999) E. J. G. Peterman, S. Brasselet, and W. E. Moerner, J. Phys. Chem. A 103, 10553 (1999).
- Harms et al. (2001) G. S. Harms et al., Biophys. J. 80, 2396 (2001).
- Crameri et al. (1995) A. Crameri, E. A. Whitehorn, E. Tate, and W. P. C. Stemmer, Nat. Biotech. 14, 315 (1995).
- (14) For details concerning protein expression and purification see P. Didier et al., Chem. Phys. Lett. 364, 503 (2001).
- Bardou et al. (2002) F. Bardou, J.-P. Bouchaud, A. Aspect, and C. Cohen-Tannoudji, in Lévy Statistics and Laser Cooling: How Rare Events Bring Atoms to Rest (Cambridge University Press, 2002).
- Penna et al. (2003) T. C. Vessoni Penna, M. Ishii, O. Cholewa, and L. C. de Souza, Appl. Microbio. 38, 135 (2003).
- Berglund (2004) A. J. Berglund, J. Phys. Chem. 121, 2899 (2004).
- (18) Without this hypothesis, Eq. 4 can be expressed in terms of a truncated Laplace Transform.