One-band tight-binding model parametrization of the high- cuprates, including the effect of -dispersion
Abstract
We discuss the effects of interlayer hopping and the resulting -dispersion in the cuprates within the framework of the one-band tight binding (TB) model Hamiltonian. Specific forms of the dispersion relations in terms of the in-plane hopping parameters , , and and the effective interlayer hopping in La2-xSrxCuO4 (LSCO) and Nd2-xCexCuO4 (NCCO) and the added intracell hopping between the CuO2 bilayers in Bi2Sr2CaCu2O8 (Bi2212) are presented. The values of the ‘bare’ parameters are obtained via fits with the first principles LDA-based band structures in LSCO, NCCO and Bi2212. The corresponding ‘dressed’ parameter sets which account for correlation effects beyond the LDA are derived by fitting experimental FS maps and dispersions near the Fermi energy in optimally doped and overdoped systems. The interlayer couplings and are found generally to be a substantial fraction of the in-plane hopping , although the value of in NCCO is anomalously small, reflecting absence of apical O atoms in the crystal structure. Our results provide some insight into the issues of the determination of doping from experimental FS maps in Bi2212, the role of intercell coupling in -axis transport, and the possible correlations between the doping dependencies of the binding energies of the Van Hove singularities (VHSs) and various prominent features observed in the angle-resolved photoemission (ARPES) and tunneling spectra of the cuprates.
I Introduction
A good deal of the existing literature on the cuprates invokes the one-band tight binding (TB) model Hamiltonian based essentially on the properties of a single CuO2-layer. Such a two-dimensional (2D) treatment ignores intercell coupling in a single layer material such as La2-xSrxCuO4 (LSCO) or Nd2-xCexCuO4 (NCCO) and the additional intracell couplings in multi-layer materials like Bi2Sr2CaCu2O8 (Bi2212). The interlayer hopping however is responsible for inducing finite dispersion of energy bands with and for splitting the two CuO2 bands in Bi2212 into bonding and antibonding combinations whose existence has become widely accepted in the high- community in the last few yearsBogdanov01 ; chuang01 ; asensio03 . Moreover, it has been shown recently that the angle-resolved photoemission (ARPES) spectra from a quasi 2D material differ fundamentally from the three-dimensional (3D) case due to the loss of selectivityMatti1 . The ARPES peaks as a result display an irreducible width which does not have its origin in any scattering mechanism. Such -dispersion-induced linewidths possess characteristic dependencies and have been shown to be quite significant in LSCOSeppo1 and Bi2212Matti1 , complicating the interpretation of spectroscopic data.
It is clear with this backdrop that it is important to incorporate interlayer couplings and the associated -dispersion effects in modeling the cuprates. This article represents the first such comprehensive attempt by considering the examples of the single layer LSCO and NCCO and the double layer Bi2212 systems. For this purpose, the framework of the standard dispersion relation, , is generalized to include an additional term . Our focus is on the form of in LSCO, NCCO and Bi2212 in terms of the effective intercell, interlayer hopping parameter and in the case of Bi2212 the added intracell hopping , although forms in LSCO and NCCO involving additional intercell hopping terms are also presented. The values of various TB parameters are obtained via fits to the first principles local density approximation (LDA) based band structures as well as to the experimental Fermi surfaces (FSs) and dispersions near the Fermi energy () in the optimally doped and overdoped systems. In particular, we derive estimates of the interlayer hopping parameters in terms of the bilayer splitting and the characteristic -dependent broadenings of the FS features observed in FS maps obtained via ARPES experiments. Similarities and differences between the in-plane and out-of-plane hopping parameters so determined in LSCO, NCCO and Bi2212 are delineated. These results are used to gain some insight into a number of issues of current interest such as the determination of doping from the experimental FS maps in Bi2212, the role of intercell coupling in -axis transport, and the possible correlations between the doping dependencies of the binding energies of the Van Hove singularities (VHSs) and various prominent features observed in ARPES and tunneling spectra of the cuprates.
It should be noted that our analysis implicitly assumes the presence of large FSs and an LDA-type electronic spectrum, albeit with some renormalization, and it is limited therefore generally to the description of the optimally doped and overdoped cuprates. The situation with underdoping becomes more complicated, especially in LSCO and NCCO, as a lower Hubbard band with an increasing spectral weight develops, which is not accounted for by the LDA or the present TB model fits. However, the hopping parameters of the sort obtained here based on the “uncorrelated” LDA-type spectrum form the traditional starting point for investigating the effects of strong correlations and are thus of considerable value in exploring the physics of the cuprates more generally.
An outline of this article is as follows. Section II presents relevant forms of energy band dispersions within the framework of the one band model as applied to LSCO, NCCO and Bi2212. Section III briefly describes the procedure used to obtain fitted TB parameters. Section IV considers the ‘bare’ parameters which fit the LDA-based band structures near the Fermi energy and the quality of the resulting fits. Section V addresses modifications needed to fit experimental FSs and dispersions and the associated renormalized or ‘dressed’ parameters. Section VI summarizes various bare and dressed parameter sets and comments on other such datasets available in the literature. Section VII briefly discusses a few illustrative examples of applications of our results. Finally, Section VIII presents a summary and makes a few concluding remarks.
II Model Dispersions
In developing model dispersions for various compounds within a one band (single orbital on Cu) TB scheme, we begin by recalling that in general the three-dimensional energy bands for the TB Hamiltonian can be expressed as (assuming a lattice without a basis):
| (1) |
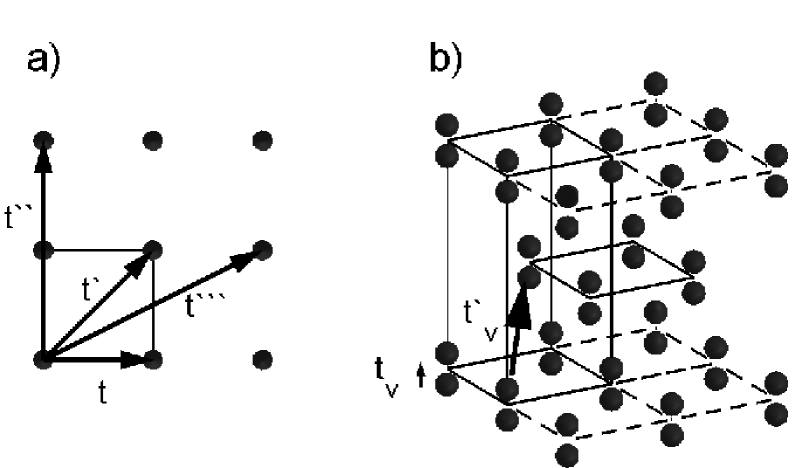
where denotes a lattice vector and is the hopping parameter associated with the site. Since our focus is on one-band models, we highlight the arrangement of the Cu atoms within the CuO2 planes as well as between different CuO2 planes in Fig. 1, where various intraplane and interplane hoppings are identified.
In order to emphasize the effect of -dispersion, we write
| (2) |
Here, and respectively denote the in-plane and out-of-plane components of . is the model dispersion associated with a single CuO2 plane if the effects of -dispersion are totally neglected. The term accounts for the effect of coupling between different CuO2 planes, and possesses a very different form in a single layer cuprate such as LSCO or NCCO than when a CuO2 bilayer is present as in Bi2212. We now discuss the two terms on the right hand side of Eq. 2 in turn.
II.1 In-plane term
is straightforwardly expressed via the hoppings , , and of Fig. 1(a) as
| (3) |
where
| (4) |
and is an integer (or half-integer). The shorthand notation of Eq. 4 is convenient as well as transparent since factors of occur frequently in describing hoppings between lattice sites separated by different distances . Only values of 1 and 2 occur in Eq. 4 because hopping up to a maximum of two lattice sites in the and/or direction is included as seen from Fig. 1(a).
II.2 Interlayer term
The form of the interlayer component depends sensitively on the stacking of the layers. Consider an isolated bilayer first. From Fig. 1(b), the simplest vertical hop is straight up via . Such a term however in Eq. 2 will be independent of . Realistic band computations show that this is not the case and that the bilayer split bands in Bi2212 display considerable dispersion with . In particular, Ref. PWA, adduced
| (5) |
It should be emphasized that here is an effective parameter for hopping within a single bilayer. By expanding the right side of Eq. 5 as
| (6) |
it is easily seen that in fact involves the sum of three different contributions and that its dependence is the result of various in-plane hoppings via the factors of and . [The first term of unity represents the vertical hop, , which is independent of .] Ref. OKA, shows how form 2 for the bilayer splitting arises in the band structure of Bi2212 through hopping from Cu to Cu via the planar oxygen orbitals, with Cu states playing a dominant role.
II.2.1 LSCO
In LSCO, the dominant intercell hopping has a form similar to that of Eq. 5, modified by the body-centered tetragonal structure, which leads to an offset of successive CuO2 planes by half a unit cell in the diagonal in-plane direction as seen in Fig. 1(b), resulting in
| (7) |
where denotes the lattice constant along the -axis, and
| (8) |
accounts for the presence of the aforementioned layer offsetOKA2 . The term arises because we have an infinite number of stacked layers, whereas the expression of Eq. 5 refers to the case of an isolated pair of layers. Note that vanishes for in-plane momenta along , leading to a lack of -dispersion along this high symmetry line, which is consistent with the observed dispersion in LSCO.
II.2.2 NCCO
In NCCO, the term similar to Eq. 7 is anomalously small, due presumably to the absence of the apical oxygens. Therefore, a number of other competing terms come into play. We empirically found that the following form approximates the first-principles band structure results:
| (9) |
where
| (10) |
which is similar to the definition of in Eq. 4.
II.2.3 Bi2212
Bi2212 involves two independent interlayer hopping parameters: which controls the intracell bilayer splitting, and , which involves intercell hopping. The associated dispersion can be written as
| (11) |
where
| (12) |
plus (minus) sign refers to the bonding (antibonding) solution and
| (13) |
Note that the term leads to absence of -dispersion along the line, and particularly at . The introduction of the additional, ‘vertical’ hopping parameter, allows for the presence of a splitting at .
III Fitting Procedure
We first fit the first principles band sructures in various compounds with the TB forms of Eqs. 3- 13 to obtain what may be referred to as the ‘bare’ hopping parameters. For this purpose, self-consistent band structure calculations were carried out within the LDA using the well-established Green’s function methodologybansil99_1 . The fitting process starts by considering the in-plane dispersion and can be illustrated with the example of the monolayer system. Specifically, the in-plane dispersion is analyzed in terms of Eq. 3 by fixing and using the LDA energies at a set of high symmetry points. The zero of energy is set for convenience at the energy of the VHS given by the point, i.e.,
| (14) |
The energies at four other symmetry points from Eq. 3 then are (with respect to )
| (15) |
| (16) |
| (17) |
| (18) |
Eqs. 15- 18 can be inverted straightforwardly to obtain the four unknowns, and in terms of the four LDA energies . In terms of the bandwidth
| (19) |
we have
| (20) |
| (21) |
| (22) |
and
| (23) |
The resulting dispersions do not completely agree with the LDA, indicating that more distant hops are significant. Instead of including these, we have adjusted the parameters slightly to optimize the overall fit. In Bi2212 we apply the above procedure to the average of the two bilayer split bands. Once the in-plane parameters are determined, the out-of-plane () dispersion is fitted along similar lines using Eqs. 7- 13 to obtain the interlayer hopping parameters.
It should be noted that the bottom of the valence band in the cuprates usually overlaps with other bands derived from planar and apical O-atoms. This makes it difficult to locate the position of the band bottom in LDA band structures. For this reason, we have used an average value of LDA levels in the vicinity of the band bottom to define used in Eq. 15.
The measured FSs and band dispersions in the cuprates in general do not agree with the LDA results, indicating the presence of electron correlation effects beyong the LDA. The bare TB parameters discussed so far can be modified or ‘dressed’ to fit the experimental data in optimally doped and overdoped systems which exhibit large hole-like FSs. The details of the fitting procedure vary somewhat for the different compounds considered and are discussed below. While the values of the dressed and bare parameters differ significantly, the main effect appears to be a renormalization (decrease) of the bandwidth by a multiplicative factor , with little effect on the shape of the FS.
IV Bare Parameters
In this section we discuss the bare parameters and the extent to which they reproduce the LDA band structures and FSs.
IV.1 LSCO
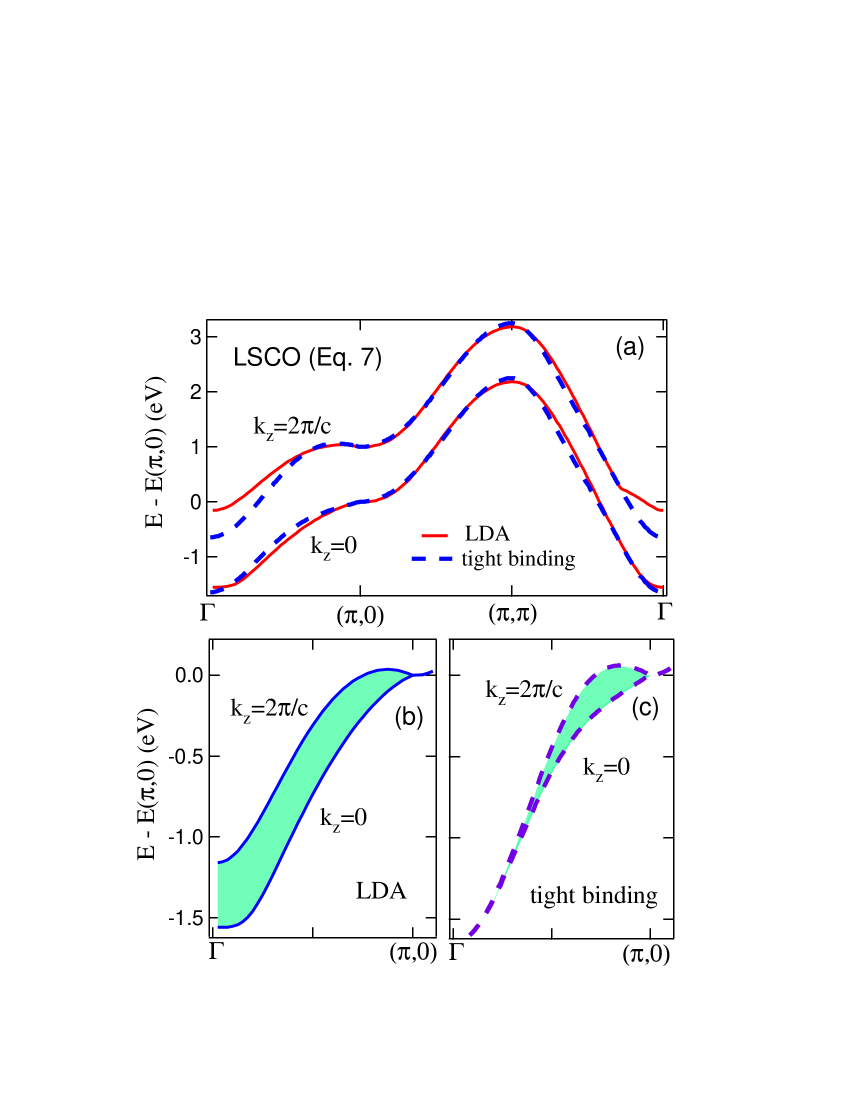
The fits in LSCO based on Eqs. 3 and 7 yield: eV, , , and . The interlayer hopping is a significant fraction of the in-plane nearest neighbor (NN) hopping and the size of is comparable to the values of in-plane second and higher neighbor terms. Fig. 2 considers the quality of the TB fit. The LDA and TB bands as a function of at as well as at are seen from Fig. 2(a) to be in good accord near the region of the VHS (defined as energy zero), which is the region of greatest interest in delineating near-FS physics. The dependence of the dispersion and how it differs between the TB and the LDA is better seen by comparing (b) and (c), where the shaded regions give the energy range over which the band wanders as a function of .
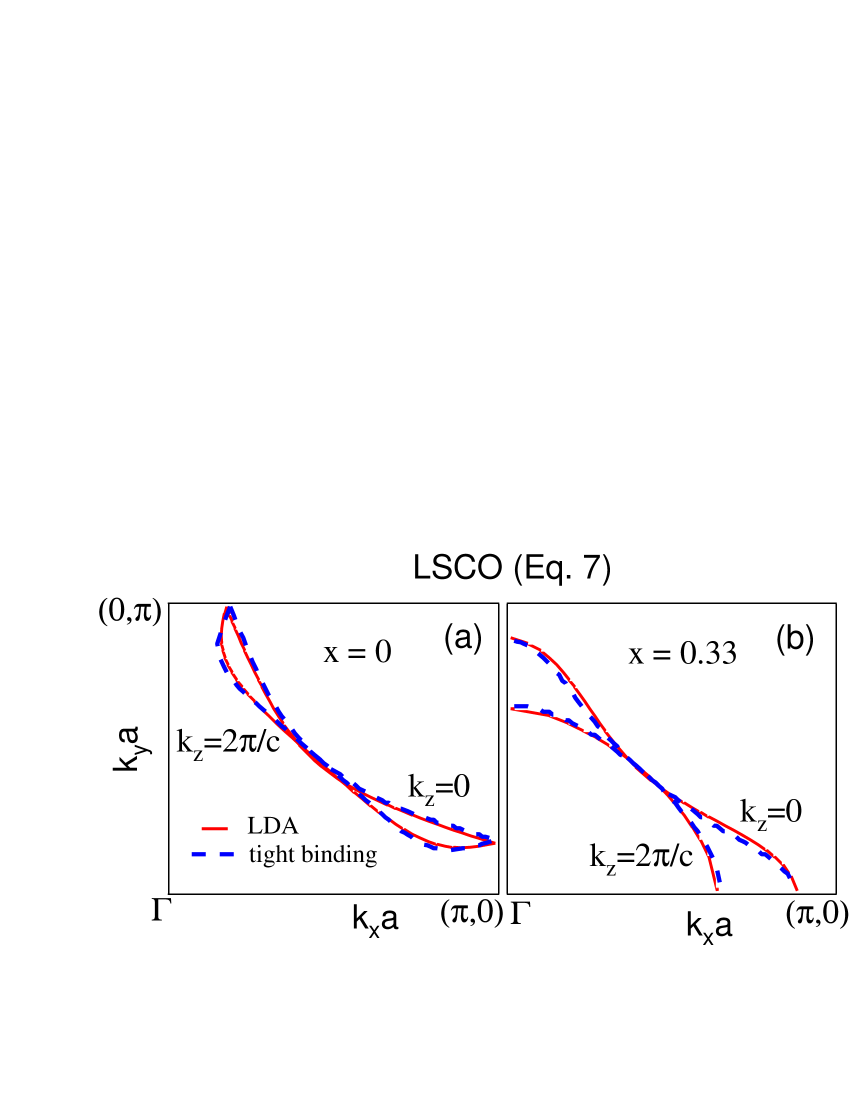
Fig. 3 considers FS maps. Given the good fit to the LDA bands near the VHS noted above, the agreement between the TB and LDA FSs is to be expected. The TB fit correctly reproduces the cuts through the FS at and as well as changes in the shape of the FS as one goes from the undoped case in (a) to the highly doped case of in (b).
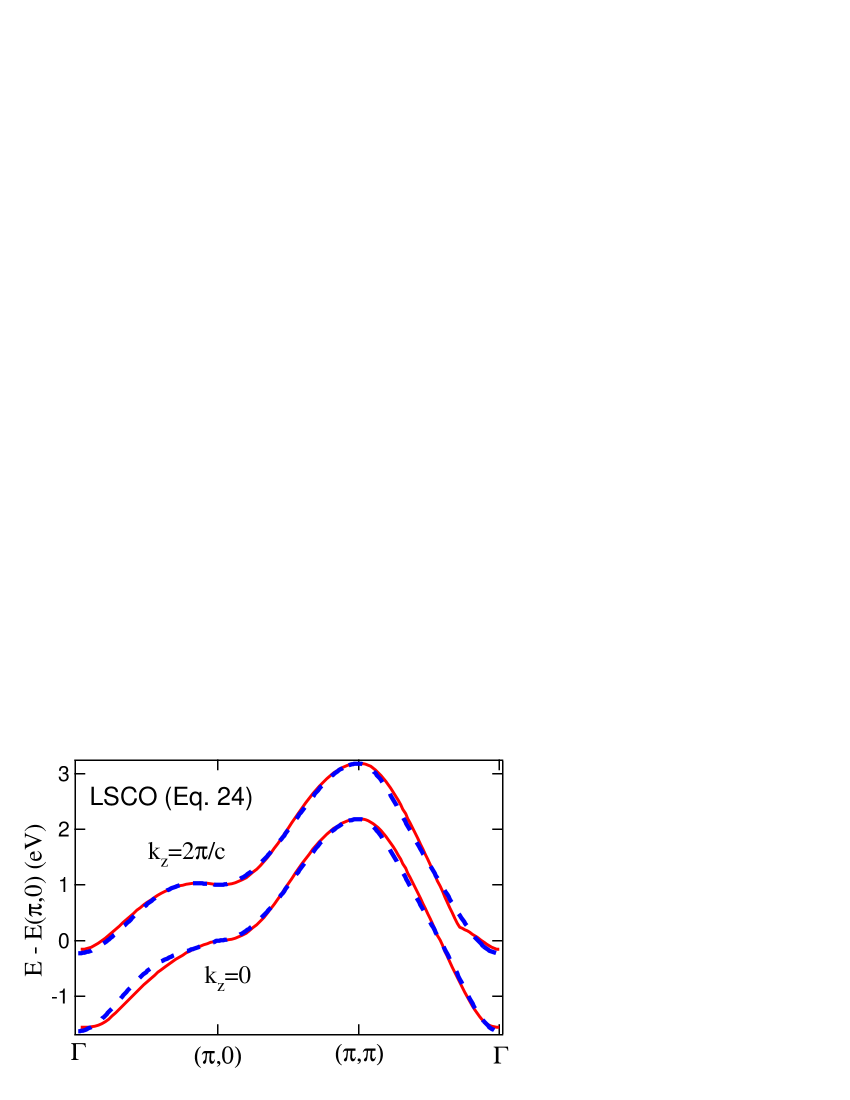
Notably, the TB fit in Fig. 2 deviates significantly from the LDA bands around for . This is not surprising since, as already pointed out, the band bottom overlaps with other Cu-derived bands. Therefore, a proper solution to this problem requires the use of a multi-band TB model. Nevertheless, we have empirically found that the following form within the single band model gives a reasonably good fit.
| (24) |
where an additional hopping parameter has been introduced together with the constant ; other quantities here have been defined earlier. The fit based on Eqs. 3 and 24 gives: eV, , , , , , and . By comparing these values with those given above based on Eqs. 3 and 7, we see that the in-plane parameters are quite similar in the two sets of fits and are thus quite robust. Fig. 4 shows that the fit based on Eq. 24 corrects the discrepency seen in Fig. 2 near the point.
Although Eq. 24 provides a better fit to the LDA bands, we should keep in mind that there is no clear evidence for the presence of an array of bands around a binding energy of eV in the cuprates. It is possible that electron correlation effects lift the band above the complex of Cu- and O-related bands. If so, Eq. 7 may be better suited than Eq. 24 for describing the physical system.LSCOms
IV.2 NCCO
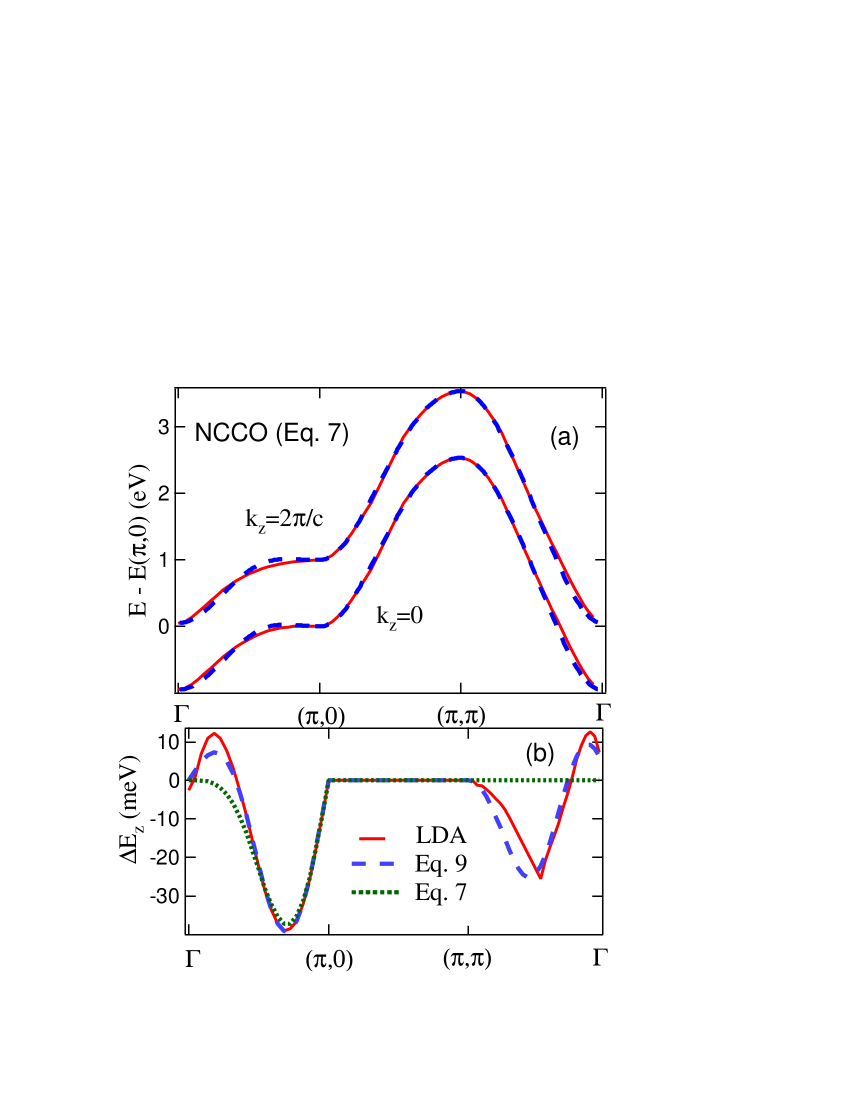
In NCCO, fits were made by using Eq. 7 as well as the more complicated Eq. 9 for . The resulting in-plane parameters are: eV, , , and . For interlayer parameters, for both fits, and the additional parameters of Eq. 9 are: and . The interlayer coupling is much smaller than in LSCO, reflecting the absence of apical O-atoms, as already noted. Figure 5(a) shows that the TB fit to the LDA bands is quite good. The differences between the TB and the LDA bands are at the meV level and are displayed in the plot of in Fig. 5(b). The simple form of interlayer hopping in Eq. 7 (dotted line in Fig. 5(b)) explains only part of the -dispersion, and the added terms in Eq. 9 (dashed line) improve the fit. The fitted FSs based on either Eq. 7 or Eq. 9 are in very good accord with the LDA and are not shown in the interest of brevity.
IV.3 Bi2212
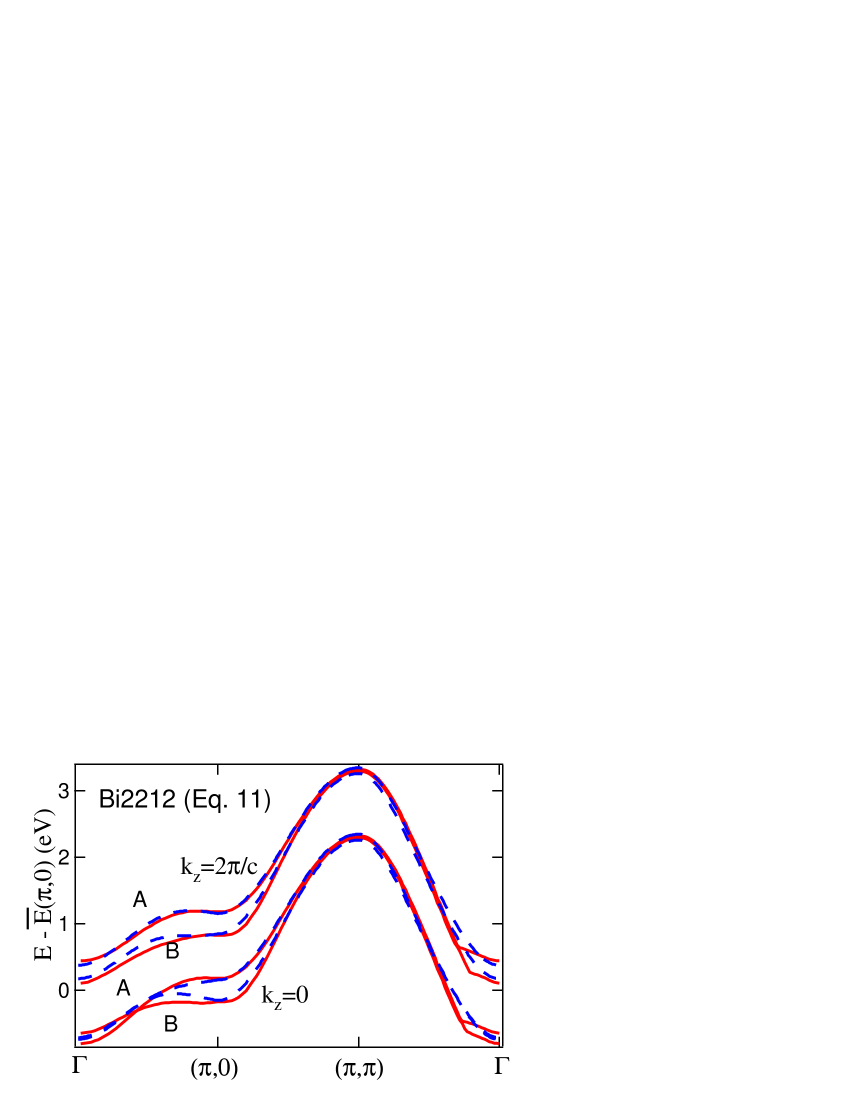
The fits on Bi2212 are based on Eq. 11 and the derived parameters are eV, , , , , , and . The coupling within a bilayer and the intercell coupling are both quite substantial as are the in-plane hopping terms beyond the NN term. Figure 6 shows that the TB fit reasonably reproduces the bilayer split LDA bands despite some discrepancies. The fits for the FS (not shown) are also quite good.
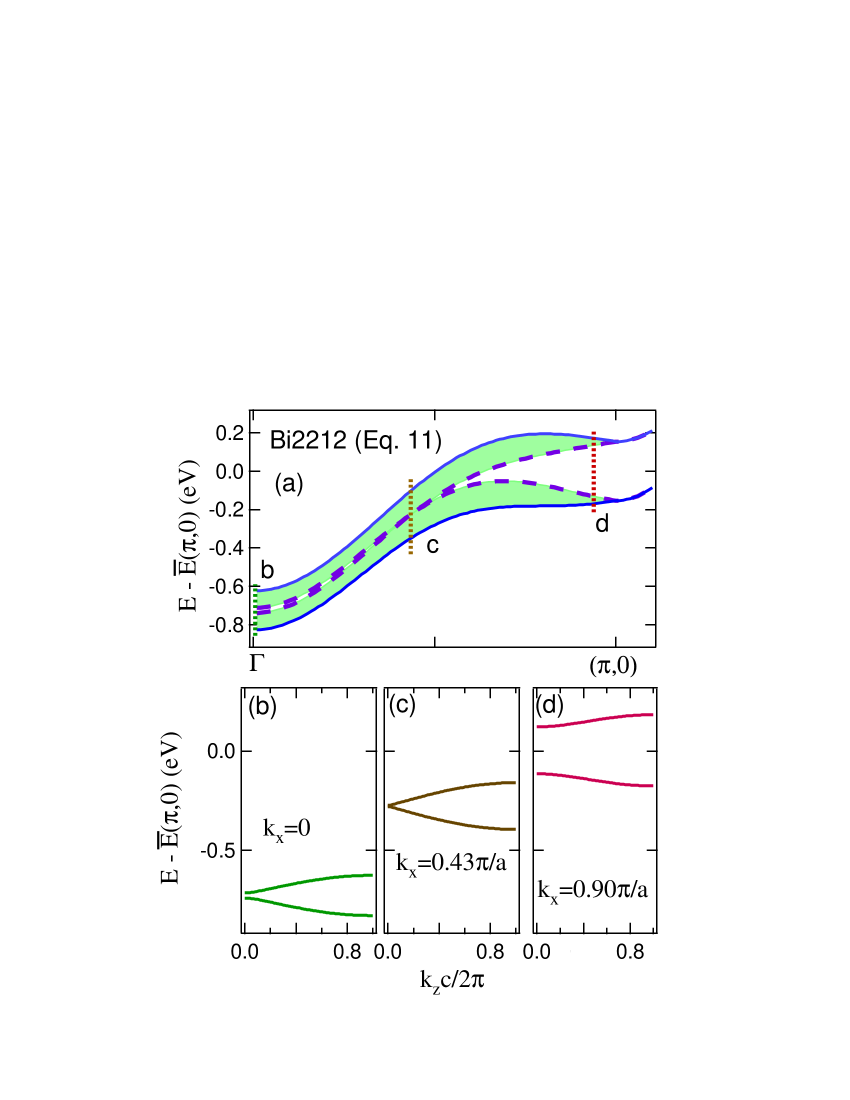
The lower pair of bilayer split LDA as well as TB bands in Fig. 6 for show an interesting level crossing between the B (bonding) and A (antibonding) bands around . This level crossing is associated with an anomalous -dispersion, which is highlighted in Fig. 7: the TB bands are drawn on an expanded scale along the line in (a), while the -dispersion at three illustrative values is shown in (b)-(d). The shape changes from being described approximately by the form for , to at , and finally back to for .
V Dressed Parameters
In this section we discuss modified or ‘dressed’ TB parameters needed for describing the measured FSs and dispersions. As already pointed out in the Introduction above, our analysis here implicitly assumes the presence of large LDA-type FSs, and it is thus limited generally to the optimally doped and overdoped systems.
We emphasize that comparisons between the measured and computed FS maps only yield information on the relative sizes of the hopping parameters, e.g. the ratios for various ’s in terms of the NN hopping , and that dispersions are additionally needed to derive the energy scale . Unfortunately, experimental ARPES data on dispersions are typically available only over a limited binding energy range of about 1 eV, leading to inherent uncertainty in any fitting process. Our procedure for obtaining the dressed parameters starts by comparing the experimental FSs with the ones computed by using the bare parameters of the previous section. In this connection, we compute FS imprints in the -plane for and , in order to identify the momentum region over which the ARPES intensity is allowed due to the effect of -dispersion along the lines of Refs. Matti1, and Seppo1, . In this way, the interlayer coupling parameters can be estimated. All parameters are then adjusted to obtain a good fit. Fig. 8 gives insight into these results and the quality of the final FS fits in the three systems considered. Finally, the measured dispersions are fitted to determine the average value of the renormalization factor . Further relevant specifics in the individual cases of LSCO, NCCO and Bi2212 are given in the Subsections V A-C below. In the interest of brevity, the final values of all dressed parameters are listed in Table II below.
V.1 LSCO
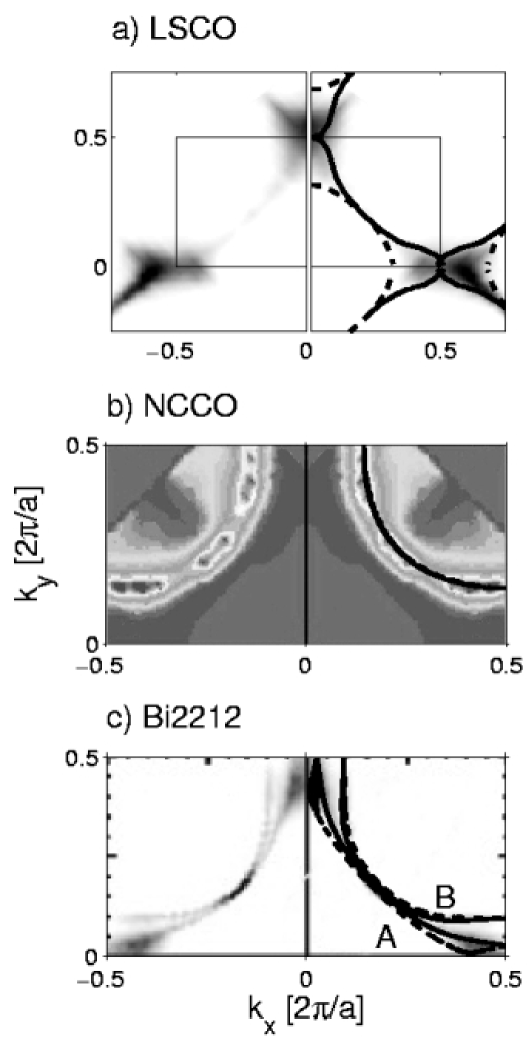
In LSCO, the experimental FS maps are in good overall accord with the first principles ARPES computationsSeppo1 over an extended doping range of , where in the underdoped regime, this agreement suggests that a remnant of the LDA-type quasiparticles with a reduced spectral weight continues to persist in the presence of strong correlations. In this work, we have specifically chosen to fine tune the bare TB parameters to fit the measured FS mapzhou01 ; zhouprivate at using Eq. 7. Fig. 8(a) is relevant in this regard. The left hand side shows the measured ARPES intensity from the FS for reference. The right hand side shows the same intensity, except that we have overlaid the FS cross sections in the -plane for (solid thick lines) and (dashed thick lines) obtained by using the final values of the dressed parameters (see Table II below). The parameter ratios are the same as in the LDA fit, except for a larger . The experimental intensity is seen to be reasonably well contained within the boundaries defined by these FS imprints given by the thick solid and dashed lines. [The ARPES intensity in this region of allowed transitions is not expected to be uniform as it gets modulated considerably in general by the ARPES matrix element.] In particular, the value of the dressed parameter used reproduces the characteristic shape of the experimental FS map. Our estimate of the so obtained should be considered an upper bound since the effects of experimental resolution and various possible scattering mechanisms not accounted for in our model will serve to further broaden the theoretical FS imprint. Finally, we have fitted the measured dispersionino02 , to adduce an average renormalization factor of . The individual renormalization factors are = = = =0.6, and .
V.2 NCCO
In NCCO, the ARPES experimentsnparm ; nparm2 ; nparm3 ; expdata seem to be dominated by the presence of upper and lower Hubbard bands, which gradually collapse with dopingKLBM . Near optimal doping the splitting between the upper and lower Hubbard bands is small and the resulting FS map resembles the LDA results. Accordingly, we have used the dataset shown in Fig. 8(b) in the fitting process based on Eq. 7. However, the size of the measured FS is best described if the doping is taken in the computations to be , and therefore, this slightly modified value of doping is used in the present fits. Also, the observed FS curvature is better fitted by reversing the sign of the bare (see Tables I and II below). Its effect is to move the FS closer to the magnetic zone boundary given by the zone diagonal, and thus this sign change may be related to the presence of some residual anti-ferromagnetic order in the system. Aside from this change, the fitted in-plane parameter ratios are the same as the corresponding LDA ratios.
In discussing the bare parameters in Section IV B above, we have already pointed out that the interlayer coupling in NCCO is quite small. As a result, changes in the cross section of the FS with are also quite small and for this reason the two FS imprints are not resolved on the right hand side of Fig. 8(b) (thick solid line). The situation is in sharp contrast with the case of LSCO in Fig. 8(a) where the and FS cross-sections are well separated. These remarks will make it clear that it is difficult to determine the dressed value of in NCCO with any accuracy via comparisons of the measured and computed FSs, and therefore, no value for is given in Table II below.
The TB fit to the FS is seen from Fig. 8(b) to be quite good overall. The experimentally observed linewidths in ARPES spectra in NCCO are generally larger than the linewidths that can be associated with the effect of -dispersion. This suggests that various scattering mechanisms are at play especially around the ‘hot spots’ where the LDA FS crosses the zone diagonal, allowing for the opening of pseudogaps which are not accounted for in the LDA or the present TB fits. As in the case of LSCO, the final values of the dressed parameters in NCCO also are more or less uniformly renormalized with respect to the bare values with a renormalization for all parameters, except as noted above.
V.3 Bi2212
The right hand side of Figure 8(c) shows the TB fit based on Eq. 11 to the experimental normal state FS map of an overdoped K Bi2212 sample, for which the bilayer splitting is clearly resolvedBogdanov02 ; expdata . For the antibonding FS sheet, the experimental intensity is seen to fall quite well within the and slices of the computed FS, especially near the antinodal region. On the other hand, the bonding FS sheet displays little width associated with -dispersion, which is also consistent with the character of the measured spectra. The fit in Fig. 8(c) was used to determine the dressed parameter ratios, while the overall renormalization factor was found by fitting the dispersion near gromko03 ; chuang03 . The renormalization factors for various parameters are found to be: , , , , , and . The renormalization of the hopping parameters is thus seen to be quite substantial with an average value of . which is responsible for the bilayer splitting is reduced to about 27% of its bare value. Notably, the experimental FS is ‘pinched’ near , with the nodal point lying closer to the point than in the LDA calculation.
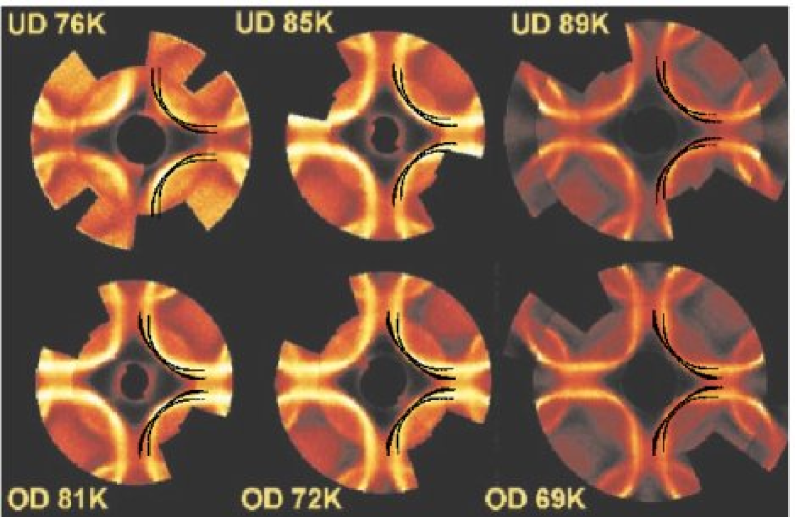
Using our dressed TB parameters for Bi2212, we have attempted to model the doping dependence of the FS of Bi2212 by adjusting the Fermi energy as a function of doping. [See Section VII A below for the specifics of the Fermi energy values used.] The results are shown in Fig. 9, where the TB FS maps (broadened to reflect the effect of -dispersion) are superposed on the experimental data of Ref. Kord, for a series of dopings from under- to the overdoped samples. Since the data were taken at room temperature, the bilayer splitting is not clearly resolved in the experimental plots. However, the TB fits are seen to reproduce the overall changes in the shape and size of the FS in Bi2212 with doping reasonably well.
VI Summary of Tight-binding Parameters
| Parameter | LSCO | NCCO | Bi2212 |
|---|---|---|---|
| 430 meV | 420 meV | 360 meV | |
| -40 | -100 | -100 | |
| 30 | 65 | 35 | |
| 70 | 15 | 20 | |
| 50 | -8 | 36 | |
| — | — | 110 |
We collect various TB parameter sets in this section for ease of reference and intercomparisons between the results for LSCO, NCCO and Bi2212. Table I lists bare values, while the dressed values are given in Table II. The LSCO datasets in Tables I and II refer to fits based on Eq. 7, although a fit using Eq. 24 was also discussed in Section IV A above. Table III lists a few other parameter sets in these compounds available in the literature.
| Parameter | LSCO | NCCO | Bi2212 |
|---|---|---|---|
| 250 meV | 230 meV | 126 meV | |
| -25 | -55 | -36 | |
| 20 | 35 | 15 | |
| 55 | -30 | 3 | |
| 30 | — | 5 | |
| — | — | 30 | |
| 0.64 | 0.55 | 0.28 |
| LSCO | Bi2212 | general | ||||
| Param. | Ref. OKA2, | Ref. OKA2, | Ref. Norm, | Ref. Norm2, | Ref. Hoog, | Ref. Kim, |
| 420 meV | 420 meV | 150 meV | 150 meV | 390 meV | 350 meV | |
| -73 | -110 | -40 | -24 | -82 | -120 | |
| 36 | 55 | 13 | 33 | 39 | 80 | |
| – | – | 28 | 13 | – | – | |
| – | – | -13 | -24 | – | – | |
| – | – | – | – | 90 | – | |
Some comments concerning the bare parameters in LSCO, NCCO and Bi2212 as well the corresponding dressed values have already been made in Sections IV and V above and need not be repeated. Here we make a few further observations as follows. In the single layer systems LSCO and NCCO the dressed values are in excellent agreement with the bare values, differing only by an overall renormalization except for the most distant neighbor . For Bi2212 bare and dressed parameters have larger differences (associated with the bilayer splitting) and the average renormalization factor is smaller, suggestive of stronger correlation effects. Given this general similarity, we restrict our further remarks mainly to the bare parameter values.
Comparing monolayer LSCO and NCCO, the bare values of the in-plane NN hopping are similar ( eV), but other in-plane hoppings, and are about twice as large in NCCO compared to LSCO. For hole-doped cuprates, an increasing value of has been correlated with increasing superconducting transition temperatureOKA2 ; TanZX , and our results for LSCO and Bi2212 are consistent with that trend. The larger in NCCO suggests that the trend does not hold for electron-doped cuprates, but that might be expected since in electron-doped cuprates is very far from the VHS. No clear trends emerge for and , except that they are comparable in magnitude to , and hence should be retained in detailed analyses.
One may estimate the strength of strong coupling corrections from the renormalization factors via the relation, , where is a measure of the combined strength of electron-electron and electron-phonon coupling. This yields values of 0.6, 0.8 and 2.6 in LSCO, NCCO and Bi2212, respectively, suggesting much stronger correlations in Bi2212, which has the highest . These values of should be used with caution, since ARPES tends to underestimate dispersion, even in simple metalsARooPS , and a more careful evaluation is needed to properly account for ‘kink’ physicsLanzara .
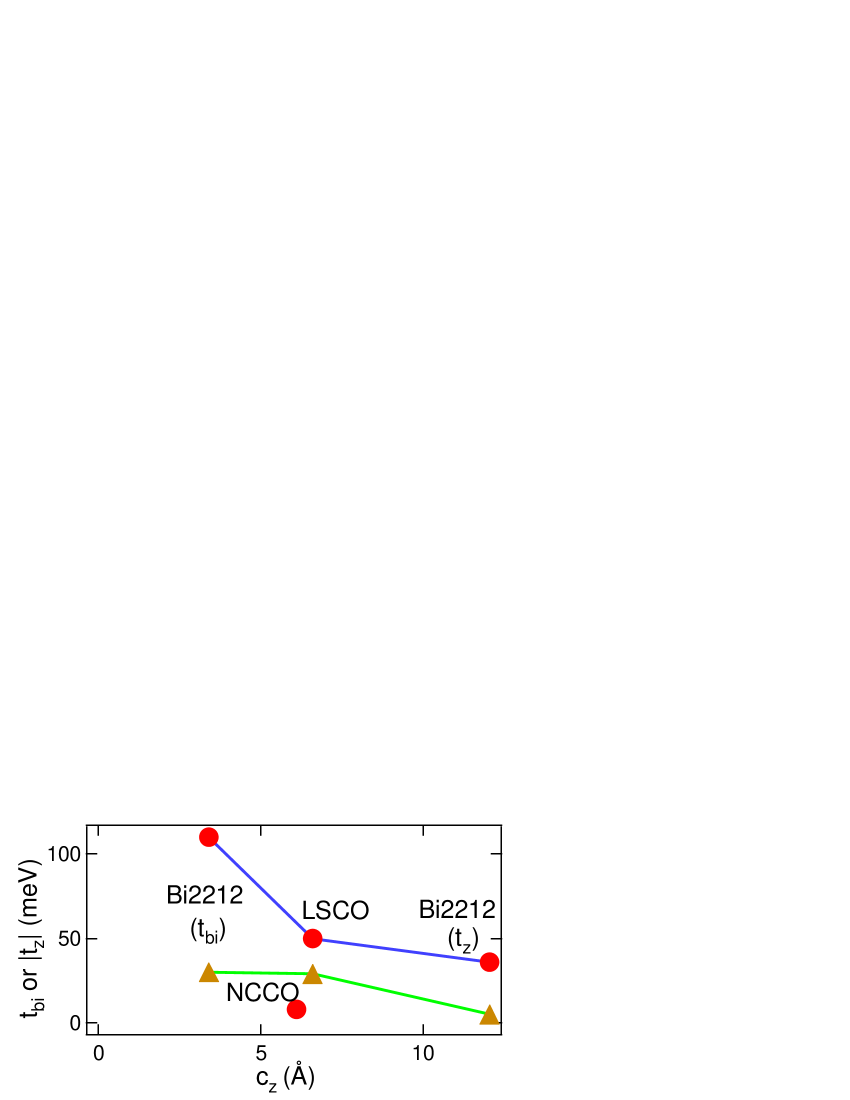
Turning to the nature of interlayer coupling, the values of the bare and dressed and are plotted in Figure 10 as a function of the separation between CuO2 planes. It is interesting that this coupling shows a systematic decrease with increasing separation between the CuO2 layers in Bi2212 and LSCO, but that NCCO which has a different relative arrangement of Cu and O atoms in different layers falls outside this pattern. The effect is more pronounced for the bare parameters (circles) compared to the dressed ones (triangles).
With regard to other parameter sets for the cuprates in the literature, note that Table III is essentially limited to in-plane couplings since little attention has been paid to the importance of interlayer coupling in the past. The data of Table III are generally similar to the results of Tables I and II depending on the type and details of fit invoked by various authors. More specifically, Ref. OKA2, (first two columns of Table III) adduces eV for a large variety of cuprates, and that ; the former result is in agreement with Table I for LSCO, while a somewhat smaller value is found for Bi2212. For Bi2212, Refs. Norm, and Norm2, provide two parameter sets, which involve more distant neighbors than we have included, although no values for bilayer or other related dispersion are included. [The term reflects a contribution to in-plane dispersion.] These parameter values in Table III are seen to be quite close to our dressed values in Table II for Bi2212. The parameters found by Ref. Hoog, are strikingly different, although the parameter ratios are more similar. It may be that these parameters refer to the total dispersion, while our evaluation (Table II) is limited to the region close to the FS. It is known that is larger in the near-FS regimeLanzara . The last column of Table III, marked general, lists the parameters reported in Ref. Kim, as providing a generalized fit to the experimental ARPES data on a variety of cuprates and it is difficult to assess their accuracy in the context of the individual compounds considered in this work.
VII Illustrative Applications
VII.1 Doping Dependence of in Bi2212
The doping level in a given single crystal of Bi2212 can in principle be determined by measuring the FS and the associated volume and hence the hole count via an ARPES experiment.Eis In practice however the imprint of the FS in ARPES becomes broadened due to -dispersion and other effects, adding uncertainty to such a determination of the FS volume in terms of models where the interlayer coupling is essentially ignored as is the case in much of the existing literature. Here we attempt to address this issue anew by using our more complete modeling of the FS in which the effects of -dispersion and bilayer splitting in Bi2212 are explicitly included.
Our procedure for analyzing the ARPES data in any specific Bi2212 sample is as follows. Using the dressed TB parameters listed in Table II, we compute the expected FS imprints for a range of values of , including the effect of broadening of the FS due to -dispersion. [Note that is the only free parameter in the computation.] The theoretical FS imprint is then overlaid on the experimental one to obtain the value of which provides the best fit to the experimental data. Once is fixed in this way, the FS volume and the hole doping is uniquely determined.
| Ref. No. | Doping | x | ||
|---|---|---|---|---|
| Bogdanov02, | OD | 70 K | -160 meV | 0.29 |
| chuang03, | OD | 55 | -160 | 0.29 |
| chuang03, | OP | 91 | -130 | 0.17 |
| chuang03, | UD | 78 | -120 | 0.135 |
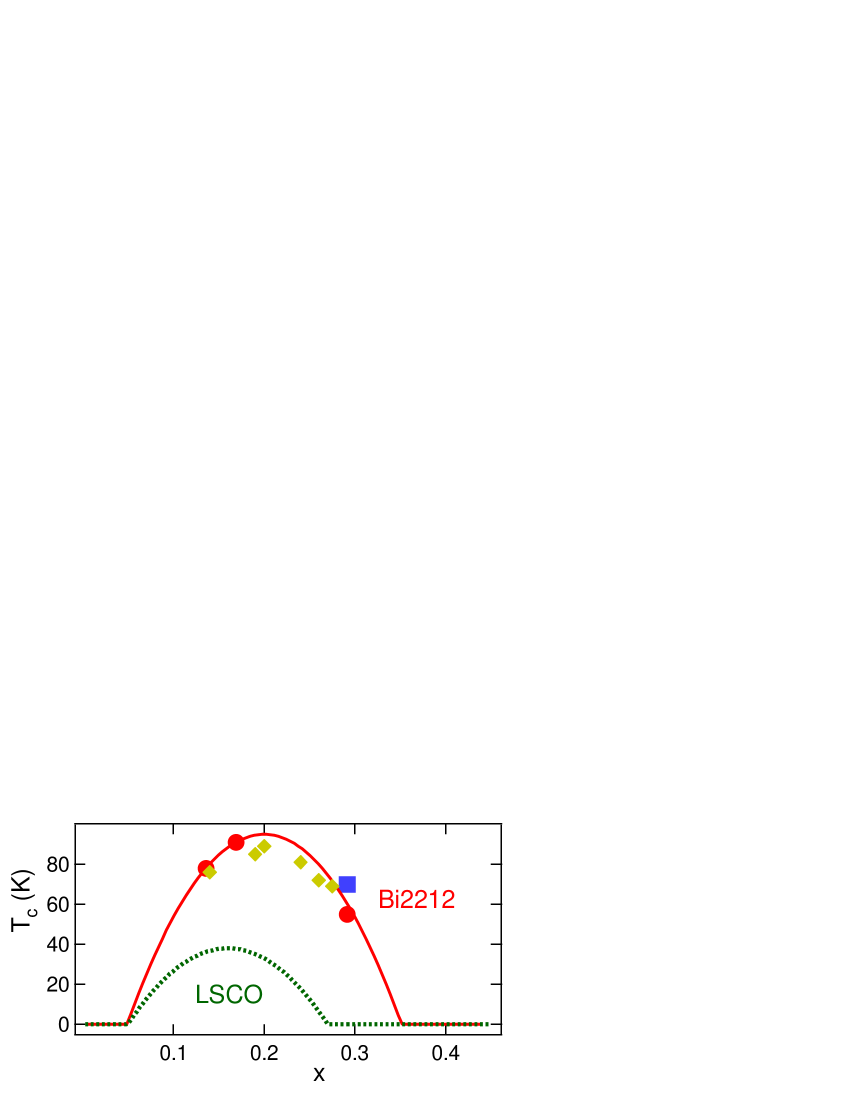
Using the preceding approach, we have analyzed the experimental datasets of Refs. Bogdanov02, and chuang03, . The results of the doping values obtained for different samples are summarized in Table IV. The best fit to is also listed in each case. Note that the data cover a substantial doping range and involve underdoped (UD), optimally doped (OP) as well as overdoped (OD) samples. The vs values of Table IV are plotted in Fig. 11 and fall rather nicely on a parabola.
In their room temperature measurements, Kordyuk, et al.Kord were unable to resolve the bilayer splitting. The doping they estimated from the area of the single FS was too small, leading them to hypothesize that they could account for the effect of bilayer splitting by rigidly shifting the data by a constant . In Fig. 11, we show that their data when shifted by line up reasonably well with other results. These shifted values of in turn give the theoretical FSs plotted in Fig. 9 above as broadened black lines. The residual differences may indicate subtle differences in the samplesEis or that the actual doping is not exactly described by a rigid shift. These differences also show up in the theoretical FS maps in Figs. 8(c) and 9.
The solid line in Fig. 11 gives the parabolic fit through all the data points and can be expressed as
| (25) |
with K being the maximum , is the optimal doping, and is the width of the parabola. This result should allow the conversion of data to actual doping values in Bi2212 more generally (as long as it is known whether the sample is over- or underdoped).
Figure 11 also compares the superconducting dome of Bi2212, with that of LSCOTal0 , which is given by Eq. 25 with , , and K. Both formulas give an onset of superconductivity at , while the doping at optimal in Bi2212 of is somewhat higher. Honma, et al.HoHo have recently reported an even higher optimal doping for Bi2212, . The similarity with the UemuraUem plot is striking, and may give insight into why the Uemura plot peaks at different dopings for different cupratesMG .
VII.2 -Axis Conductivity and Intercell Coupling
Whether the -axis conductivity in the cuprates is coherent or not is currently a subject of considerable controversy. However, for a strongly correlated system, one would expect that increasing the interlayer hopping should increase , whether this conductivity is coherent or not. For instance, in a fluctuating stripe model, interlayer conductivity would be sensitive to whether charged stripes in different layers are in registry, but the actual hopping will be controlled by . Also, in the interlayer pairing model, single particle interlayer hopping is frustrated by strong correlation effects, but the unfrustrated pair hopping still depends on the bare .
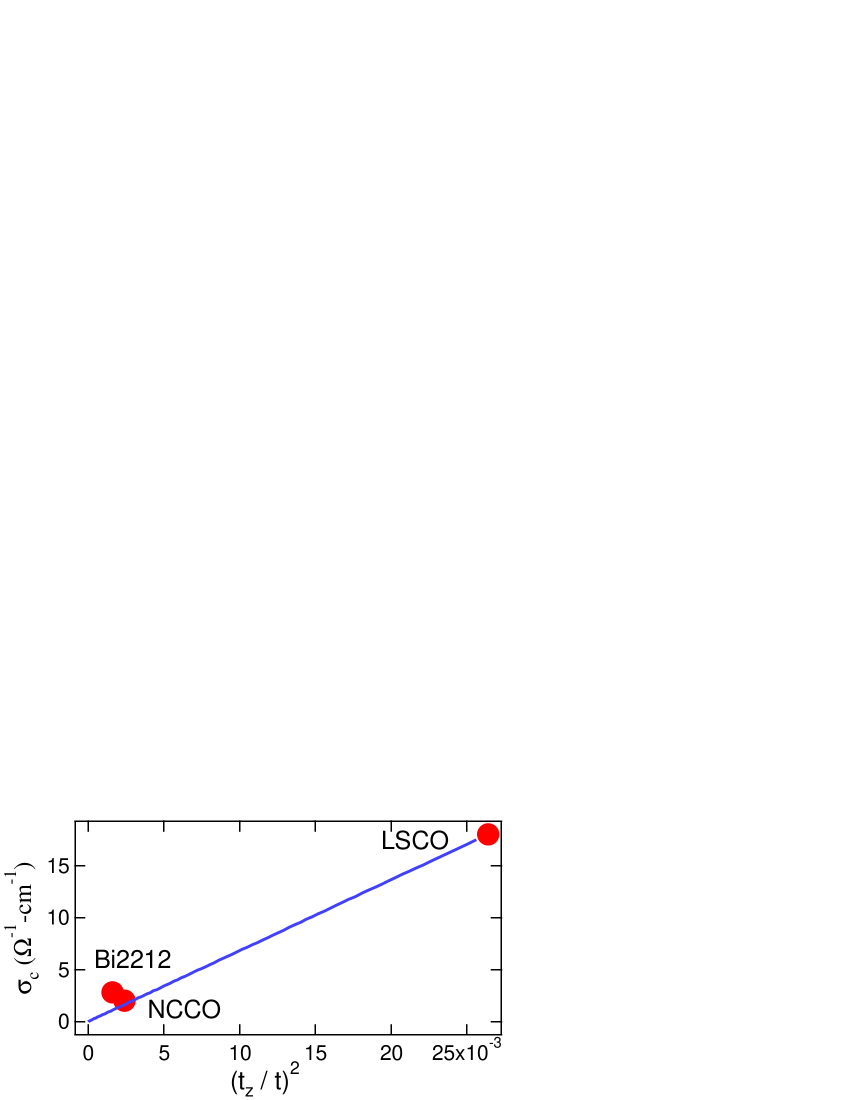
Our purpose here is only to ascertain whether our values of are consistent with the observed material variations of the -axis conductivity in the cuprates. In particular, Ref. MKII, argues that at fixed doping should scale approximately as . Figure 12 shows that the plot of experimentalDord vs is nearly linearBibi , indicating that our values are at least not obviously inconsistent with experiment in LSCO, NCCO and Bi2212. Note that we have taken the values in Fig. 12 for the optimally doped samples where the -axis conductivity is likely to be more coherent.
VII.3 Effect of Dispersion on Van Hove Singularities
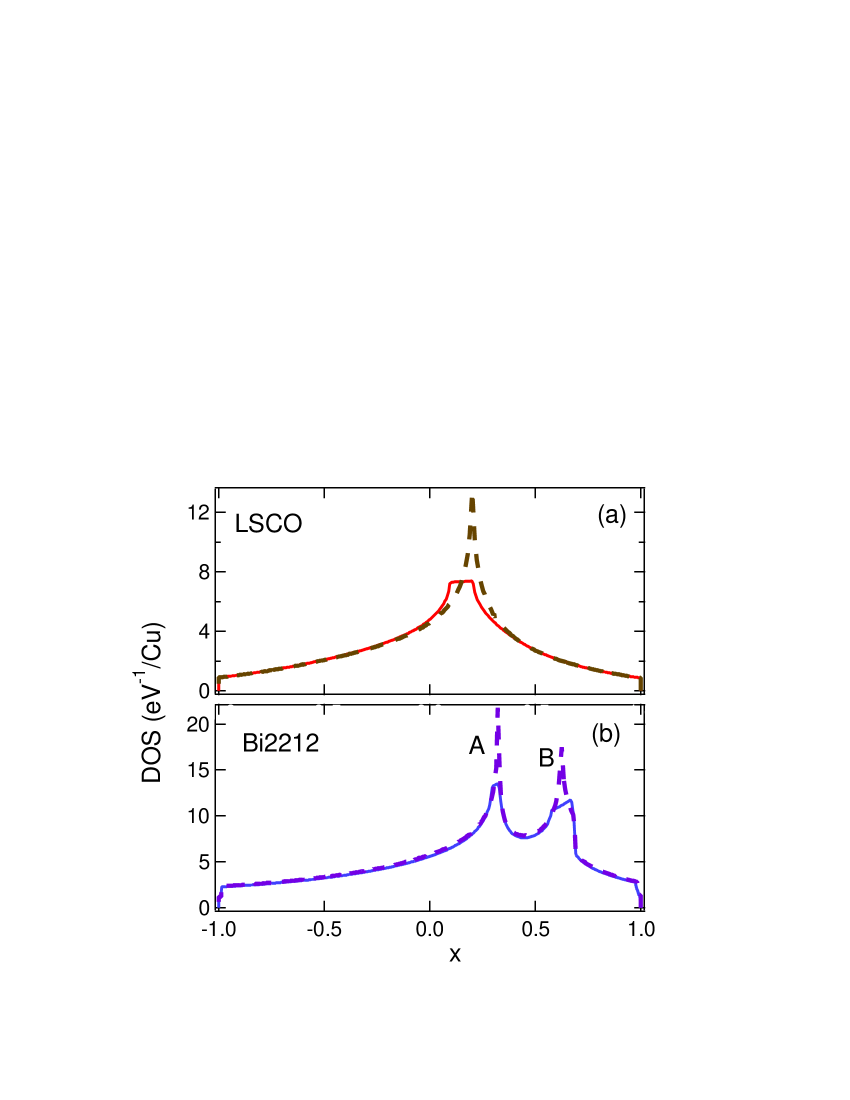
Van Hove singularities in the electronic density of states (DOS) have been implicated for playing an important role in determining various properties of the cuprates. If the interlayer coupling is neglected, i.e. the system is assumed to be strictly 2D, the VHS occurs as a sharp feature at a single energy in the DOS of a monolayer system and at two different energies (corresponding to the bilayer split bands) in a double layer system. Fig. 13 shows this effect with the examples of LSCO and Bi2212. Here the horizontal axis is given in terms of the doping , which can be obtained straightforwardly for any given value of the Fermi energy by counting the number of holes in the band, allowing the energy scale in the DOS to be converted to the doping scale. The single sharp VHS peak for LSCO in Fig. 13(a) at in the 2D case (dashed line) is replaced by a flat region of high DOS spread over when the effect of -dispersion is included (solid line). A similar effect is seen in Fig. 13(b) for Bi2212, except that here we have two peaks related to the bonding and antibonding bilayer bands. The antibonding VHS (A, lower peak around ) displays a smaller width compared to the bonding VHS (B, around ), reflecting differences in the extent to which A and B bands are spread in energy through the coupling . By comparing Figs. 13(b) and 11, it can be seen that in Bi2212 the optimal corresponds to a doping close to but less that the doping at which the antibonding VHS crosses the Fermi level.
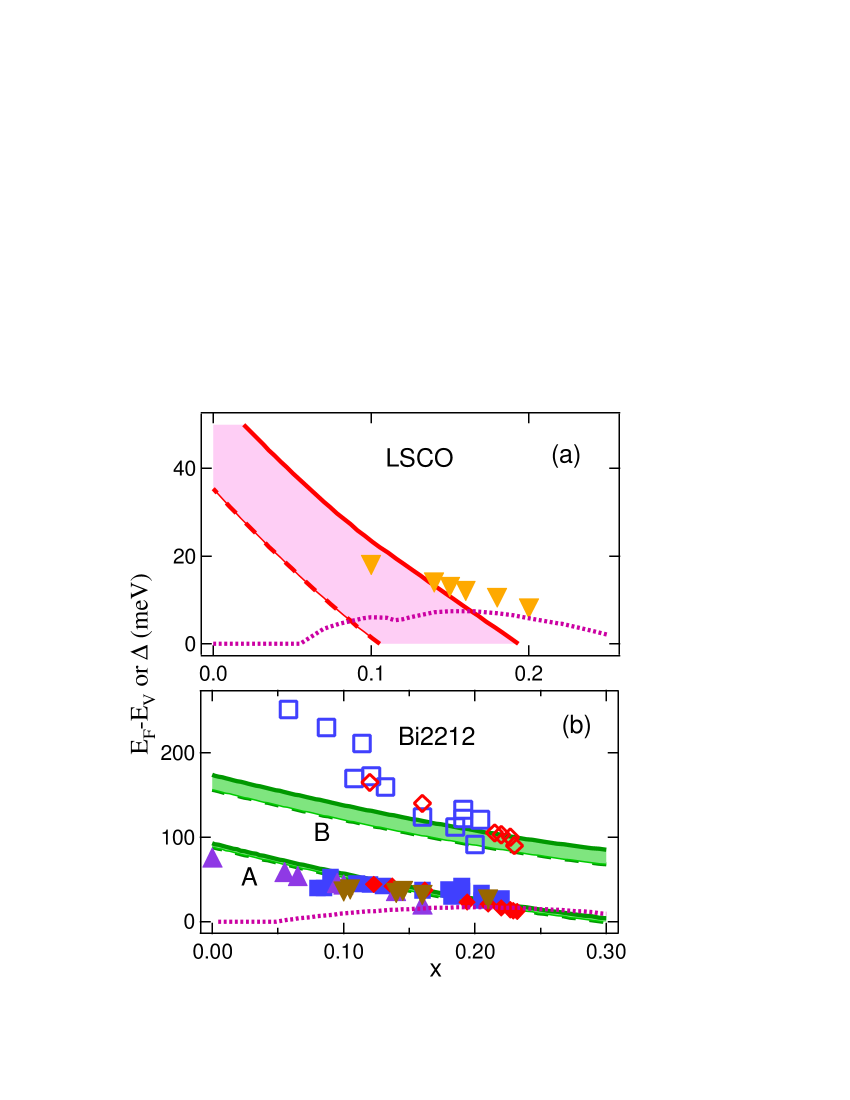
The doping dependence of the positions of the VHSs and their possible correlation with superconducting properties is briefly explored in Fig. 14. In order to help orient the reader, we consider Fig. 14(a) for LSCO first. The thick solid curve (upper boundary of the shaded region) gives the position of the leading edge of the VHS, which is seen from Fig. 13(a) to lie at the Fermi energy for , and to move to higher binding energies with decreasing doping. The dashed thick curve similarly gives the binding energy of the trailing edge of the VHS. Also shown are the gap parameter , defined via , for the superconducting dome (dotted line) and the value of the pseudogap from tunneling experimentsOda (triangles). In the same vein, Fig. 14(b) which refers to Bi2212, gives variations in the binding energies of the leading and trailing edges of the VHSs for the bonding and antibonding bands, together with the gap parameter for the superconducting dome and various features in the tunneling and ARPES spectraMarsh ; Camp ; Cuk as detailed in the figure caption.
Fig. 13(a) shows that the effect of -dispersion is quite substantial on LSCO in that it spreads the VHS over a large portion of the superconducting dome. In Bi2212 on the other hand the effect is smaller and the bonding and antibonding VHSs remain distinct. One of the experimentally observed features in ARPES and tunneling (the lower binding energy datasets in Fig. 14(b)) seems to track the antibonding VHS in Bi2212 over a fairly large doping range, but this correlation for the higher binding energy feature is limited to optimal and overdoped regimes. In LSCO, the tunneling feature shown correlates with the leading edge of the VHS and is well separated from the behavior of the trailing edge. However, the connection between the tunneling pseudogap (which is approximately symmetrical about ) and the VHS (which is not) is nontrivial, and a more detailed analysis is considered beyond the scope of this paper.
VIII Summary and Conclusions
We discuss tight-binding parameterization of electronic states near the Fermi energy in LSCO, NCCO and Bi2212 where the effect of -dispersion is included in a comprehensive manner for the first time. Our analysis proceeds within the framework of the one-band model and incorporates available ARPES data and the results of first principles band structure computations on these cuprates. The in-plane coupling is treated in terms of the hoppings , , , and between the nearest and farther out neighbors, while the coupling between different CuO2 layers is considered mainly through an effective intercell hopping , with an added hopping to account for the intracell interaction involving the CuO2 bilayer in Bi2212. In each compound we obtain the specific tight-binding form for describing the dispersion and the associated ‘bare’ parameter sets, which fit the 3D band structures based on the LDA, as well as ‘dressed’ parameters which account for correlation effects beyond the LDA on the experimental FSs and near-FS dispersions in optimally doped and overdoped regimes.
In LSCO, the bare interlayer hopping eV is found to be a substantial fraction of the in-plane NN hopping with , and the size of is comparable to the values of in-plane second and higher neighbor terms. In NCCO, the interlayer coupling is anomalously small with , reflecting lack of apical O-atoms in the crystal structure; we delineate how in this case other smaller terms become important and modify the dependence of the dispersion. In Bi2212, the bilayer coupling and the interlayer coupling are both quite substantial, with and , as are the in-plane terms beyond the NN term; a level degeneracy between the bonding and antibonding bands around induces an anomaly in dispersion. Correlation effects beyond the LDA reduce the band dispersions as expected, so that values of the dressed parameters are smaller than the corresponding bare values. Renormalization factors for the hopping parameters vary substantially with average values of = 0.64, 0.55, and 0.28 in LSCO, NCCO and Bi2212, respectively.
It should be noted that any fitting procedure involving a limited basis set – a one band model here – possesses inherent uncertainty tied to the binding energy used in obtaining the fit. In the cuprates, the present framework of the one band model would need to be modified when one moves to higher binding energies and bands derived from other Cu - and O -orbitals come into play. Also, the experimental values of the interlayer couplings and adduced in this work should be viewed as upper bounds since these are based on model computations which only include the broadening effect of -dispersion and do not take into account the effects of various scattering mechanisms and experimental resolution.
Our modeling of the -dispersion effects provides insight into a number of issues of current interest and we briefly illustrate this aspect with three examples. (i) We show that the inclusion of -dispersion in modeling FS imprints yields doping levels for various published ARPES datasets in Bi2212, which when plotted against related ’s, fall remarkably well on a parabola. This parametrization of the superconducting dome may help the determination of doping levels of Bi2212 single crystals via ARPES experiments more generally. (ii) By using the values derived in this work, we show that the intercell hopping controlled by is consistent with -axis transport, at least in optimally doped samples, with the -axis conductivity scaling approximately as . (iii) Logarithmic Van Hove singularities (VHSs) in the 2D case are spread over energy when -dispersion is included. We compare the binding energies of the leading and trailing edges of the VHSs with those of various prominent features observed in ARPES and tunneling experiments in LSCO and Bi2212. The antibonding VHS in Bi2212 tracks some experimental features quite well over a wide doping range, but this is the case for the bonding VHS in Bi2212 and the leading edge of the VHS in LSCO mostly in the optimally doped regime. Although specific implications of these results require further analysis, they suggest that attention should be given to the induced width of the VHSs when making comparisons with experimental features.
We conclude that the simple tight-binding parametrization of LSCO, NCCO and Bi2212 presented in this article constitute a useful starting point for exploring the effects of -dispersion on the electronic properties of the cuprates.
Acknowledgements.
This work is supported by the US Department of Energy contract DE-AC03-76SF00098 and benefited from the allocation of supercomputer time at NERSC and Northeastern University’s Advanced Scientific Computation Center (ASCC).References
- (1) P.V. Bogdanov, A. Lanzara, X.J. Zhou, S.A. Kellar, D.L. Feng, E.D. Lu, H. Eisaki, J.-I. Shimoyama, K. Kishio, Z. Hussain, and Z.X. Shen, Phys. Rev. B 64, 180505(R) (2001).
- (2) Y.-D. Chuang, A.D. Gromko, A. Fedorov, Y. Aiura, K. Oka, Y. Ando, H. Eisaki, S.I. Uchida, and D.S. Dessau, Phys. Rev. Lett. 87, 117002 (2001).
- (3) M.C. Asensio, J. Avila, L. Roca, A. Tejeda, G.D. Gu, M. Lindroos, R.S. Markiewicz, and A. Bansil, Phys. Rev. B 67, 014519 (2003).
- (4) A. Bansil, M. Lindroos, S. Sahrakorpi, and R.S. Markiewicz, Phys. Rev. B. 71, 012503 (2005).
- (5) S. Sahrakorpi, M. Lindroos, R.S. Markiewicz, and A. Bansil, cond-mat/0501500, unpublished.
- (6) S. Chakravarty, A. Sudbø, P.W. Anderson, and S. Strong, Science 261, 337 (1993).
- (7) O.K. Andersen, A.I. Liechtenstein, O. Jepsen, and F. Paulsen, J. Phys. Chem. Solids 56, 1573 (1995).
- (8) E. Pavarini, I. Dasgupta, T. Saha-Dasgupta, O. Jepsen, and O.K. Andersen, Phys. Rev. Lett. 87, 047003 (2001).
- (9) See, e.g., A. Bansil, S. Kaprzyk, P.E. Mijnarends, and J. Tobola, Phys. Rev. B 60, 13396 (1999), and references therein.
- (10) Ref. Seppo1, describes a TB fit in LSCO based on unrenormalized LDA bands close to the Fermi energy with a somewhat different parameter set.
- (11) X.J. Zhou, T. Yoshida, S.A. Kellar, P.V. Bogdanov, E.D. Lu, A. Lanzara, M. Nakamura, T. Noda, T. Kakeshita, H. Eisaki, S. Uchida, A. Fujimori, Z. Hussain, and Z.-X. Shen, Phys. Rev. Lett. 86, 5578 (2001).
- (12) We thank X.J. Zhou, T. Yoshida, A. Fujimori, Z. Hussain, and Z.X. Shen, for providing us with the original experimental data of Ref. zhou01, so that it could be shown in the gray scale scheme of Fig. 8(a).
- (13) A. Ino, C. Kim, M. Nakamura, T. Yoshida, T. Mizokawa, A. Fujimori, Z.-X. Shen, T. Kakeshita, H. Eisaki, and S. Uchida, Phys. Rev. B 65, 094504 (2002).
- (14) N.P. Armitage, F. Ronning, D.H. Lu, C. Kim, A. Damascelli, K.M. Shen, D.L. Feng, H. Eisaki, Z.-X. Shen, P.K. Mang, N. Kaneko, M. Greven, Y. Onose, Y. Taguchi, and Y. Tokura, Phys. Rev. Lett. 88, 257001 (2002).
- (15) N.P. Armitage, D.H. Lu, C. Kim, A. Damascelli, K.M. Shen, F. Ronning, D.L. Feng, P. Bogdanov, Z.-X. Shen, Y. Onose, Y. Taguchi, Y. Tokura, P.K. Mang, N. Kaneko, and M. Greven Phys. Rev. Lett. 87, 147003 (2001).
- (16) N.P. Armitage, D.H. Lu, C. Kim, A. Damascelli, K.M. Shen, F. Ronning, D.L. Feng, P. Bogdanov, X.J. Zhou, W.L. Yang, Z. Hussain, P.K. Mang, N. Kaneko, M. Greven, Y. Onose, Y. Taguchi, Y. Tokura, and Z.-X. Shen, Phys. Rev. B 68, 064517 (2003).
- (17) The experimental data in Fig. 8(b) and (c) has been extracted from the figures in Refs. nparm2, and Bogdanov02, , respectively, and presented here in gray scale.
- (18) C. Kusko, R.S. Markiewicz, M. Lindroos, and A. Bansil, Phys. Rev. B 66, 140513(R) (2002).
- (19) P.V. Bogdanov, A. Lanzara, X.J. Zhou, W.L. Yang, H. Eisaki, Z. Hussain, and Z.X. Shen, Phys. Rev. Lett. 89, 167002 (2002)
- (20) A.D. Gromko, A.V. Fedorov, Y.-D. Chuang, J.D. Koralek, Y. Aiura, Y. Yamaguchi, K. Oka, Y. Ando, and D.S. Dessau, Phys. Rev. B 68, 174520 (2003).
- (21) Y.-D. Chuang, A.D. Gromko, A.V. Fedorov, Y. Aiura, K. Oka, Y. Ando, M. Lindroos, R.S. Markiewicz, A. Bansil, and D.S. Dessau, Phys. Rev. B 69, 094515 (2004).
- (22) A.A. Kordyuk, S.V. Borisenko, M.S. Golden, S. Legner, K.A. Nenkov, M. Knupfer, J. Fink, H. Berger, L. Forro, and R. Follath, Phys. Rev. B 66, 014502 (2002).
- (23) K. Tanaka, T. Yoshida, A. Fujimori, D.H. Lu, Z.-X. Shen, X.-J. Zhou, H. Eisaki, Z. Hussain, S. Uchida, Y. Aiura, K. Ono, T. Sugaya, T. Mizuno, and I. Terasaki, Phys. Rev. B 70, 092503 (2004).
- (24) S. Hüfner, “Photoelectron Spectroscopy: Principles and Applications”, Third Edition (Berlin, Springer, 2003), Table 4.5.
- (25) A. Lanzara, P.V. Bogdanov, X.J. Zhou, S.A. Kellar, D.L. Feng, E.D. Lu, T. Yoshida, H. Eisaki, A. Fujimori, K. Kishio, J.-I. Shimoyama, T. Noda, S. Uchida, Z. Hussain, and Z.-X. Shen, Nature 412, 510 (2001).
- (26) M.R. Norman, M. Randeria, H. Ding, and J.C. Campuzano, Phys. Rev. B 52, 615 (1995).
- (27) M. Eschrig and M.R. Norman, Phys. Rev. Lett. 85, 3261 (2000).
- (28) B.W. Hoogenboom, C. Berthod, M. Peter, Ø. Fischer, and A.A. Kordyuk, Phys. Rev. B 67, 224502 (2003).
- (29) C. Kim, P.J. White, Z.-X. Shen, T. Tohyama, Y. Shibata, S. Maekawa, B.O. Wells, Y.J. Kim, R.J. Birgeneau, and M.A. Kastner, Phys. Rev. Lett. 80, 4245 (1998).
- (30) There may be some uncertainty due to variations resulting from sample preparation techniques. See discussion in H. Eisaki, N. Kaneko, D.L. Feng, A. Damascelli, P.K. Mang, K.M. Shen, Z.-X. Shen, and M. Greven, Phys. Rev. B 69, 064512 (2004).
- (31) J.L. Tallon, Physica C 168, 85 (1990).
- (32) T. Honma, P.H. Hor, H.H. Hsieh, and M. Tanimoto, Phys. Rev. B 70, 214517 (2004).
- (33) Y.J. Uemura, L.P. Le, G.M. Luke, B.J. Sternlieb, W.D. Wu, J.H. Brewer, T.M. Riseman, C.L. Seaman, M.B. Maple, M. Ishikawa, D.G. Hinks, J.D. Jorgensen, G. Saito, and H. Yamochi, Phys. Rev. Lett. 66, 2665 (1991); J.L. Tallon, J.W. Loram, J.R. Cooper, C. Panagopoulos, and C. Bernhard, Phys. Rev. B 68, 180501(R) (2003).
- (34) R.S. Markiewicz and B.C. Giessen, Physica C 160, 497 (1989).
- (35) R.S. Markiewicz, Phys. Rev. B 70, 174518 (2004).
- (36) S. V. Dordevic, E. J. Singley, J. H. Kim, M. B. Maple, Seiki Komiya, S. Ono, Y. Ando, T. Room, Ruxing Liang, D. A. Bonn, W. N. Hardy, J. P. Carbotte, C. C. Homes, M. Strongin, and D. N. Basov, Phys. Rev. B 69, 094511 (2004).
- (37) In Bi2212, the relevant parameter is and not , where the latter is related to intracell hopping within a bilayer.
- (38) M. Oda, T. Matsuzaki, N. Momono, and M. Ido, Physica C 341-348, 847 (2000).
- (39) D.S. Marshall, D.S. Dessau, A.G. Loeser, C-H. Park, A.Y. Matsuura, J.N. Eckstein, I. Bozovic, P. Fournier, A. Kapitulnik, W.E. Spicer, and Z.-X. Shen, Phys. Rev. Lett. 76, 4841 (1996).
- (40) J.C. Campuzano, H. Ding, M.R. Norman, H.M. Fretwell, M. Randeria, A. Kaminski, J. Mesot, T. Takeuchi, T. Sato, T. Yokoya, T. Takahashi, T. Mochiku, K. Kadowaki, P. Guptasarma, D.G. Hinks, Z. Konstantinovic, Z.Z. Li, and H. Raffy, Phys. Rev. Lett. 83, 3709 (1999).
- (41) T. Cuk, Z.-X. Shen, A.D. Gromko, Zhe Sun, and D.S. Dessau, Nature 432, 1 (2004).