Transport and magnetic properties of GdBaCo2O5+x single crystals: A cobalt oxide with square-lattice CoO2 planes over a wide range of electron and hole doping
Abstract
Single crystals of the layered perovskite GdBaCo2O5+x (GBCO) have been grown by the floating-zone method, and their transport, magnetic, and structural properties have been studied in detail over a wide range of oxygen contents, . The obtained data are used to establish a rich phase diagram centered at the “parent” compound GdBaCo2O5.5 – an insulator with Co ions in the 3+ state. An attractive feature of GdBaCo2O5+x is that it allows a precise and continuous doping of CoO2 planes with either electrons or holes, spanning a wide range from the charge-ordered insulator at 50% electron doping () to the undoped band insulator (), and further towards the heavily hole-doped metallic state. This continuous doping is clearly manifested in the behavior of thermoelectric power which exhibits a spectacular divergence with approaching =0.5, where it reaches large absolute values ( V/K) and abruptly changes its sign. At low temperatures, the homogeneous distribution of doped carriers in GBCO becomes unstable, as is often the case with strongly correlated systems, and both the magnetic and transport properties point to an intriguing nanoscopic phase separation into two insulating phases (for electron-doped region) or an insulating and a metallic phases (for hole-doped region). We also find that throughout the composition range the magnetic behavior in GBCO is governed by a delicate balance between ferromagnetic (FM) and antiferromagnetic (AF) interactions, which can be easily affected by temperature, doping, or magnetic field, bringing about FM-AF transitions and a giant magnetoresistance (MR) phenomenon. What distinguishes GBCO from the colossal-MR manganites is an exceptionally strong uniaxial anisotropy of the Co spins, which dramatically simplifies the possible spin arrangements. This spin anisotropy together with the possibility of continuous ambipolar doping turn GdBaCo2O5+x into a model system for studying the competing magnetic interactions, nanoscopic phase separation and accompanying magnetoresistance phenomena.
pacs:
72.80.Ga, 72.20.Pa, 75.30.Kz, 75.47.DeI INTRODUCTION
Since the discovery of the high- superconductivity (HTSC) in cuprates and shortly after of the colossal magnetoresistance (CMR) in manganites, a great deal of experimental and theoretical efforts have been made to clarify the nature of these phenomena. The research has soon revealed that the unusual behavior of cuprates and manganites is not limited to HTSC and CMR: These compounds based on seemingly simple metal-oxygen planes turn out to possess very rich phase diagrams, originating from strong electron correlations and involving spin, charge, orbital, and lattice degrees of freedom.Imada ; CMR_rev ; Kivelson In particular, the strong electron correlations, which prevent the electrons in partially filled bands from forming conventional itinerant Bloch states, make these systems prone to nanoscopic phase separation and self-organization of electrons into various superstructures. The role of this electron self-organization still remains controversial. It is often argued, for example, that the HTSC and CMR would never be possible in a homogeneous system, and it is the nanoscopic mixture of phases that stays behind these novel phenomena.CMR_rev ; Kivelson
Ironically, the complexity of manganese and copper oxides that brings about all the fascinating physics also makes these compounds very difficult for understanding. The research thus naturally expanded towards other transition-metal oxides, both because the comparison of different systems could give a clue to the behavior of cuprates and manganites, and because those less studied systems might be interesting in their own right. Such exploration has indeed been proven to be very fruitful, resulting, for instance, in the discovery of unconventional superconductivity in a layered-perovskite ruthenium oxideSr2RuO4 and recently in a layered cobalt oxide.SC A study of nickel and cobalt oxides has also revealed the spin/charge ordering phenomenaLaNiO ; CO_Co214 ; Vogt ; Suard and nanoscopic phase separationcubic_Co ; BiCo2201 closely resembling those in cuprates and manganites; these observations confirm that the charge ordering is indeed a generic feature of strongly correlated electrons. By now, probably the most rich and intriguing behavior has been found in cobalt oxides, which ranges from giant MRMartin ; Troy1 ; Troy2 ; Maignan ; Respaud ; GBC_PRL and large thermoelectric power attributed to strong electron correlationsNaCoO ; S_book ; Koshibae ; Ando_specific_heat to unconventional superconductivity.SC Apparently, the cobalt oxides, which are still much less studied than cuprates or manganites, are meant to become the next primary field in investigations of the strongly correlated electron systems.
Unlike cuprates and manganites, the layered cobalt oxides have two substantially different crystallographic types: the layered perovskites derived from square-lattice CoO2 planes, similar to HTSC and CMR compounds, and compounds like NaxCoO2 derived from triangular-lattice CoO2 planes. In both cases, the CoO2 planes can be doped with charge carriers over a remarkably wide range so that the effective valence of Co ions varies from Co2+ to Co4+.Imada In other words, the doping level ranges from one electron to one hole per Co ion, if the Co3+ state with even number of electrons is taken as the “parent” state. Empirically, the square-lattice and triangular-lattice systems behave quite differently. For example, the square-lattice cobalt oxides, such as La2-xSrxCoO4, Bi2Sr2CoO6+δ, and RBaCo2O5+x (where R is a rare earth element), are usually reported to be non-metallic,Co_214 ; BiCo2201 ; Martin ; Troy1 ; Troy2 ; Maignan ; Respaud ; GBC_PRL ; Vogt ; Moritomo ; Moritomo2 ; OpticalSm with the exception of heavily hole-doped cubic perovskites La1-xSrxCoO3.cubic_Co In contrast, the triangular-lattice cobaltites often appear to be fairly good metals,NaCoO ; misfitRc ; misfit with the hydrated NaxCoO2 being even a superconductor.SC This difference in behavior may come in part from a disparity in the doping level, given that the latter compounds were usually studied in a more highly hole-doped region. Nevertheless, the surprisingly robust non-metallic state in the square-lattice cobalt oxides Co_214 ; BiCo2201 clearly points to a more fundamental source, which is presumably a very strong tendency to charge ordering. In the triangular-lattice compounds such tendency might be considerably weaker. Indeed, the charge ordering usually gains support from the antiferromagnetic (AF) exchange, while in a triangular lattice the AF spin interactions should inevitably be frustrated. Thus far, however, non of these systems has been systematically investigated over the entire doping range to reveal a coherent picture of doped cobalt-oxygen planes.
In this work, we undertake a systematic study of magnetic and transport properties of a square-lattice cobalt oxide over a wide doping range. For this purpose, we have selected the RBaCo2O5+x compounds (where R is a rare earth element), which have already attracted a lot of attention owing to such fascinating features as the spin-state and metal-insulator transitions, charge and orbital ordering phenomena, and giant magnetoresistance (GMR).Martin ; Maignan ; Troy1 ; Troy2 ; OpticalSm ; Suard ; Vogt ; Moritomo ; Akahoshi ; Kusuya ; Respaud ; GBC_PRL ; Moritomo2 ; Frontera The RBaCo2O5+x compounds possess a layered crystal structure which consists of square-lattice layers [CoO2]-[BaO]-[CoO2]-[ROx] stacked consecutively along the axis (Fig. 1) – a so-called “112”-type structure.Martin This structure is derived from a simple cubic perovskite R1-xBaxMO3 (where M is a transition metal), but in contrast to the latter, the rare-earth and alkali-earth ions are located in their individual layers instead of being randomly mixed.
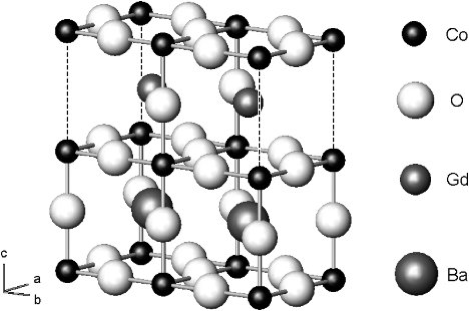
What makes RBaCo2O5+x compounds particularly attractive for our study is a large variability of the oxygen content: By changing the annealing conditions, one can modify the oxygen concentration in the rare-earth [ROx] planes (Fig. 1) in a wide range, ( depends also on the size of R3+ ion).Martin ; Akahoshi In turn, the oxygen content controls the nominal valence of Co ions, which varies from 2.5+ to 3.5+, passing through (“parent” state) at . Ordinarily, experimental investigations of the phase diagrams of solids are very time consuming, because they require to grow many single crystals of different compositions. In contrast, the composition of already grown RBaCo2O5+x crystals can be modified by annealing at various temperatures and oxygen partial pressures, which may allow one to span the entire phase diagram using one and the same single crystal. Furthermore, by varying the oxygen content one can tune the doping level very smoothly, which gives a great advantage in studying the critical regions of the phase diagram.
Upon choosing a compound from the RBaCo2O5+x group, one would prefer to have a non-magnetic R ion, such as Y, La, or Lu, to avoid additional complication coming from the rare-earth magnetism. Unfortunately, the growth of single crystals with these non-magnetic elements turns out to be virtually impossible.YLaLu Therefore, we have selected the GdBaCo2O5+x compound: Gd3+, being a 4f7 ion with zero orbital moment, is known to show rather simple magnetic behavior in transition-metal compounds, making predominantly paramagnetic contribution, which can be easily subtracted from the overall magnetization. Also, owing to the intermediate size of Gd ion in the series of rare-earth elements, GdBaCo2O5+x allows a fairly wide range of available oxygen concentration. Recently, we succeeded in growing high-quality GdBaCo2O5+x single crystals using the floating-zone (FZ) technique, and studied the magnetic and transport properties of the parent, , composition.GBC_PRL
Here, we present a systematic data on the evolution of transport, magnetic, and thermoelectric properties of well-characterized GdBaCo2O5+x single crystals over the entire doping range available for this compound, namely, . This layered cobalt oxide turns out to be a really fascinating filling-control system which allows a continuous ambipolar doping: We have developed a technique that provides an easy and precise tuning of the oxygen content in GdBaCo2O5+x single crystals and ceramics, and succeeded in doping the parent semiconductor () with electrons () or holes () with steps that could be as small as 0.001 per Co ion (). As a result, we could observe spectacular singularities in the transport properties upon approaching the undoped state, could compare the motion of doped holes and electrons, and study the impact of a small amount of doped carriers on the competition between the ferromagnetic and antiferromagnetic spin ordering in this compound. Our study has revealed a rich phase diagram for this layered cobalt oxide, which is found to include regions of an intriguing nanoscopic phase separation over virtually the entire doping range.
This paper is organized as follows. In Section II, we describe the growth of high-quality GdBaCo2O5+x single crystals by the floating-zone technique, the method of modifying their oxygen content, and the detwinning technique used to obtain single-domain orthorhombic crystals. The details of magnetic and transport measurements are also presented in Section II. Section III starts with a brief summary of the crystal structure of GdBaCo2O5+x over the oxygen-concentration range , which is followed with the experimental results on transport, thermoelectric, and magnetic properties of GdBaCo2O5+x, studied in this wide range of oxygen concentrations. The obtained data are used to establish an empirical phase diagram presented at the end of this section. The implications of our observations are discussed in Section IV. Based on the obtained experimental results, first we propose a magnetic and electronic structure of the parent GdBaCo2O5.50 compound, giving our explanation of its transport behavior and the origin of GMR; then we discuss the effects of doping in GdBaCo2O5+x; and, finally, suggest an overall electronic phase diagram for this compound. Section V summarizes our findings.
II EXPERIMENTAL DETAILS
II.1 Growth of GdBaCo2O5+x crystals
We have grown high-quality GdBaCo2O5+x single crystals by the floating-zone technique, using an infrared image furnace with two halogen lamps and double ellipsoidal mirrors (NEC Machinery SC E-15HD). A polycrystalline feed rod for the crystal growth was prepared by the solid-state reaction of Gd2O3, BaCO3, and CoO dried powders: The mixture was successively calcined at C, C, C, and C, each time for 20 hours, with careful regrinding after each sintering. Then the obtained homogeneous single-phase GdBaCo2O5+x powder was isostatically pressed (at MPa) to form a rod with typical dimensions of 7 mm 100 mm. Finally, the feed rod was annealed at C in air to make it dense and hard.
The crystal growth was performed in a flow of dried air, at a constant rate of 0.5 mm/h. We found that such rather slow growth rate was essential for obtaining the ordered “112” crystal structure, and for reducing the number of domains in the resulting crystalline rod; higher rates inevitably caused multi-domain crystal growth. Using optical microscopy and Laue x-ray back-reflection control, we selected single-domain parts of the grown crystal rod and cut them into parallelepiped samples suitable for structural, transport and magnetization measurements. All the samples’ faces were carefully polished and adjusted to the crystallographic planes with a 1∘ accuracy.

The homogeneity and stoichiometry of the obtained GdBaCo2O5+x crystals were analyzed by the electron-probe microanalysis (EPMA) and inductively-coupled plasma (ICP) spectroscopy which confirmed that the actual cation composition was uniform, corresponding to the nominal 1:1:2 ratio within the experimental accuracy. Another important issue is whether Gd and Ba are well ordered in the lattice; in fact, we found that large rare-earth ions, such as La and Pr, easily mixed with Ba, resulting in a disordered cubic phase R0.5Ba0.5CoO3-δ. In the case of GdBaCo2O5+x crystals, however, the x-ray diffraction data demonstrate that Gd and Ba are indeed well ordered into consecutive (001) layers, which results in the doubling of the unit cell along the axis (Fig. 2). Moreover, for the oxygen concentration , the oxygen ions are found to form alternating filled and empty chains running along the axis; this brings about the doubling of the unit cell along the axis (Fig. 2). Apparently, such long-range oxygen ordering would hardly be possible if considerable amount of Ba were substituting Gd in GdOx layers. Figure 2 shows also a typical x-ray rocking curve (040) for GdBaCo2O5.5, which has a full-width-at-half-maximum (FWHM) of less than 0.1∘, indicating that our crystals have few macroscopic defects. An additional evidence for the macroscopic crystallographic perfection is the ease with which the crystals could be cleaved, especially along the {001} planes, exposing perfectly flat, shiny surfaces.
II.2 Tuning the oxygen content in GdBaCo2O5+x
II.2.1 Equilibrium oxygen concentration as a function of temperature and oxygen partial pressure
Owing to the layered “112” crystal structure, the oxygen content in RBaCo2O5+x can be varied within a wide range , where the oxygen vacancies are located predominantly in the rare-earth ROx planes.Maignan The most convenient way to modify the oxygen stoichiometry is the high-temperature annealing, yet it requires a detailed knowledge of how the equilibrium oxygen content depends on the temperature and oxygen partial pressure. Besides, one needs to know the kinetics of the oxygen exchange: The annealing temperature should be carefully chosen so that the oxygen exchange is quick enough for the equilibrium state to be reached in a reasonable time, but still slow enough to avoid unwanted oxygen absorption during the subsequent cooling of the sample.
In order to establish such dependences, we have performed special sets of annealings, systematically varying temperature, oxygen partial pressure , and annealing time, as exemplified by the data shown in Fig. 3. By measuring the weight change of -g polycrystalline samples, as well as large single crystals, with a 0.1-g resolution, we could evaluate the change in the oxygen content with an accuracy better than 0.001. Although all the relative oxygen variations are measured very accurately, there would still be a large uncertainty in the absolute values of , unless we pin this relative scale to the absolute oxygen content at least at one point. Fortunately, in GdBaCo2O5+x there are two peculiar oxygen concentrations that allow the absolute scale to be establish unambiguously. First, in GdBaCo2O5+x crystals, similar to other RBaCo2O5+x compounds with small rare-earth ions, Suard ; Akahoshi ; Vogt the oxygen content can be reduced down to by annealing in vacuum, or inert atmosphere. One can naturally expect the composition to be stable over rather broad range of parameters, since in this phase all the weakly-bound oxygen is removed from GdOx layers, while the strongly-bound oxygen in BaO and CoO2 layers is still intact. Indeed, we observed that saturates, approaching some lowest level [see Fig. 3(b)] as the oxygen partial pressure is reduced and the annealing temperature is increased, and we attributed this saturation value to . Much more sensitive calibration can be done at the point, which turns out to be critical for GdBaCo2O5+x: Upon crossing this point, the mixed valence composition of Co2+/Co3+ ions turns into the Co3+/Co4+ one, and consequently the type of charge carriers switches abruptly. As we will show below, several physical properties of GdBaCo2O5+x exhibit a very sharp singularity in their dependences near , changing remarkably with a minute (by merely 0.001) modification of . The calibrations that used the and points gave the same results, which allows us to be confident in absolute values of in our samples.
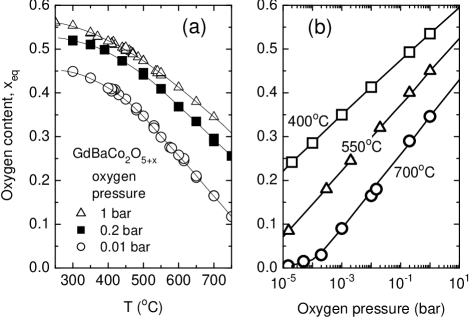
Temperature dependences of the equilibrium oxygen content in GdBaCo2O5+x for different oxygen partial pressures are shown in Fig. 3(a), which demonstrates that a large variation of can be achieved by relatively simple means: by annealing in a flow of oxygen and argon mixed in different proportions. Note that the shown data correspond to the equilibrium state, and that all the changes in oxygen concentration are therefore completely reversible. Our measurements have shown that the equilibrium value at a given temperature is roughly proportional to the logarithm of the oxygen partial pressure, as long as is not too close to zero [Fig. 3(b)]. Therefore, in order to obtain the lowest oxygen concentration we annealed samples in a flow of argon or helium, and used strongly diluted (down to 10 ppm) oxygen-argon mixtures to access the low- range, although precise tuning of in this case becomes technically more difficult. In the opposite limit, the samples with oxygen concentrations up to were prepared by annealing in oxygen at high pressures (up to 70 MPa).
II.2.2 Oxygen intercalation kinetics
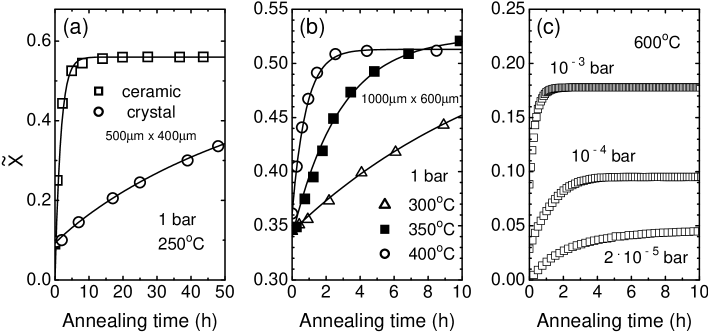
As we have mentioned above, there is one more point to be concerned about, upon choosing the proper annealing conditions, besides the equilibrium value: it is the oxygen-intercalation kinetics. If the oxygen diffusion is too slow, one will inevitably end up with a crystal having a large composition gradient; if, in contrast, the oxygen uptake is too fast, it will be difficult to preserve the achieved state even by very fast cooling. By measuring how the sample’s mass evolves with time , we have determined the time dependences of the average oxygen content for different annealing conditions, as shown in Fig. 4. Apparently, the proper duration of the heat treatment necessary to obtain a homogeneous oxygen distribution should be several times longer than the characteristic time of the oxygen exchange process at a given temperature and an oxygen partial pressure. We have found that for ceramic samples the kinetics of oxygen intercalation in the entire studied ranges of temperature and follows a simple exponential law,
| (1) |
where and are the initial and the equilibrium oxygen contents, is a time constant that depends on temperature and . Such simple exponential dependence can be naturally attributed to the oxygen exchange limited by a surface energy barrier. The time constant turns out to be less than 3 hours at temperatures down to C (at 1 bar oxygen pressure), so that the equilibrium state in ceramic samples can be easily achieved by one-day annealing [Fig. 4(a)].
In the case of single crystals, however, the oxygen intercalation deviates from the simple exponential behavior, and goes at a noticeably slower rate, as illustrated in Fig. 4(a). We have found that for m sized crystals, two days of annealing at C is far from being enough to reach the equilibrium oxygen concentration [Fig. 4(a)]; such annealing turns out to be insufficient even for m samples. This difference in the kinetics of oxygen absorption is apparently caused by an additional limitation imposed by the bulk oxygen diffusion: While the crystal surface layer is readily filled with oxygen, it takes much more time for oxygen to diffuse towards the inner part of the crystal. For rectangular-shape crystals the oxygen exchange kinetics has an analytical solution,Lane ; Yasuda which depends on the surface exchange coefficient , characterizing the oxygen exchange at the interface between the gas and the solid, and the chemical diffusion coefficient , besides the sample size. These parameters can be extracted by fitting theoretical curves to experimental data, as exemplified in Figs. 4(a) and 4(b). For example, the data shown in Fig. 4(a) provide the diffusion-coefficient value of cms at C.cond-mat With increasing temperature, the diffusion coefficient grows rapidly and so does the rate of the oxygen uptake, making it possible to achieve a homogeneous oxygen distribution in mm sized crystal already after several hours annealing at C [Fig. 4(b)]. Note that the oxygen kinetics does not show any detectable difference upon varying the sample size along the axis, implying an essentially 2D character of the oxygen diffusion typical for layered oxides.YBCO
We should note that the diffusion coefficient found in GdBaCo2O5+x is remarkable in its own right, being unusually large for such low temperatures; the oxygen diffusivity appears to be comparable with that in best superionic conductors.cond-mat One additional implication of the high oxygen mobility, which is important to the present study, is that the oxygen ions may be capable of rearranging even at room temperature or below, and one should expect the oxygen to form ordered superstructures or to participate in mesoscopic phase separation.
After the homogeneous oxygen distribution in a crystal is reached, an important issue to be concern about is the cooling procedure, which must be as fast as possible to avoid any further oxygen uptake. To obtain the most homogeneous samples we used the following rules upon selecting the annealing conditions. The annealing temperature and the partial oxygen pressure were selected so that: i) they provided the required oxygen content in the crystal, and ii) the annealing time necessary to reach the equilibrium oxygen distribution was in the range from several hours to several days. After the annealing was completed, the samples were quickly quenched to room temperature without changing the atmosphere. Upon quenching, the crystal temperature dropped by C in several seconds, guaranteeing the blocking of any further oxygen exchange. The huge difference in the time scales – hours and days for modifying the oxygen concentration and seconds for quenching – ensured us that the unwanted oxygen uptake could affect no more than a fraction of percent of the crystal’s volume. An important point to be specially emphasized is that the oxygen exchange at the interface between the gas and the solid is strongly suppressed at low oxygen partial pressures. As illustrated in Fig. 4(c), by reducing the oxygen partial pressure one can arrange a slow oxygen uptake in a ceramic sample even at C. This feature turns out to be very useful in obtaining homogeneous samples within the low oxygen concentration range.
II.3 Detwinning of crystals
The oxygen ordering is indeed observed in GdBaCo2O5+x at , where the oxygen ions in GdOx planes order into alternating filled and empty chains, causing a tetragonal-to-orthorhombic (T-O) transition and doubling of the unit cell along the axis (Fig. 2). Usually, this T-O transition is accompanied by heavy twinning of crystals that mixes the and orthorhombic axes; one therefore needs to perform a detwinning procedure to get a single-domain orthorhombic crystal for studying the in-plane anisotropy. To detwin crystals, we slowly cooled them under a uniaxial pressure of GPa from C, using a polarized-light optical microscope to control the twin removing. twins We should note, however, that the GdBaCo2O5+x crystals are very fragile, and it was virtually impossible to complete the detwinning procedure without having them cleaved into two or more pieces. These pieces were fairly well detwinned (according to x-ray measurements, the remaining fraction of misoriented domains usually did not exceed 4-5%) and suitable for magnetization measurements. Thus far, however, we have not succeeded in detwinning the crystals with already prepared electrical contacts (see below), which are necessary for transport measurements.
II.4 Details of measurements
To characterize the physical properties of GdBaCo2O5+x, we have carried out resistivity, magnetoresistance (MR), Hall, thermopower, and magnetization measurements within the 2-400 K temperature range.
The in-plane () and out-of-plane () resistivity was measured using a standard ac four-probe method. Good electric contacts were obtained by drawing with a gold paint on polished crystal surfaces, and subsequent heat treatment. For current contacts, the whole area of two opposing side faces was painted with gold to ensure a uniform current flow through the sample. In turn, the voltage contacts were made narrow ( m) in order to minimize the uncertainty in absolute values of the resistivity. It is important to note that the gold contacts were prepared before all the heat treatments that were used to vary the oxygen content. After the required oxygen concentration was set by annealing, thin gold wires were attached to the contact pads using a room-temperature-drying silver paste (DuPont 4922), which electrically and mechanically bound the wire to the sample. As the measurements were completed, the wires were removed and the crystal was reannealed to get the next value.
The MR measurements were done either by sweeping the magnetic field between 14 T at fixed temperatures stabilized by a capacitance sensor with an accuracy of 1 mK,MR_accur or by sweeping the temperature at a fixed magnetic field. Both and have been measured for and .
The Hall resistivity was measured using a standard six-probe technique by sweeping the magnetic field to both plus and minus polarities at fixed temperatures; the electric current was always along the -plane. After the symmetric (MR) contribution coming from a slight misplacement of the contacts was subtracted from the raw data, the Hall resistivity appeared to be perfectly linear in magnetic field for all measured temperatures, implying that the anomalous Hall effect was negligible.
In order to determine the thermoelectric power (Seebeck coefficient) , we generated a slowly oscillating thermal gradient along the sample (within K), and measured an induced periodic voltage. This allowed us to get rid of thermoelectric contributions generated in the remaining circuit. A chromel-constantan thermocouple employed for measuring the thermal gradient was attached to the heat source and to the heat sink, which were fixed to the sample by a silver paste. To obtain the absolute value of the thermoelectric power, a contribution from the gold wires ( V/K) used as output leads was subtracted. Thermopower measurements were mostly performed on long ( mm) samples by applying a temperature gradient along the or the axis.
Magnetization measurements were carried out using a SQUID magnetometer at fields up to 7 T applied along one of the crystallographic axis. Measurement modes included taking data upon heating the sample after it was cooled down to 2 K in zero field (ZFC), upon cooling the sample in magnetic field from 400 K (FC), and upon sweeping the field at fixed temperatures. Throughout this paper, the magnetization coming from Co ions is determined by subtracting the contribution of Gd ions, assuming their ideal paramagnetic (PM) behavior with total spin ; the latter is a good approximation since no ordering of Gd3+ moments in any of the samples is detected down to 1.7 K.
III RESULTS
III.1 Crystal structure
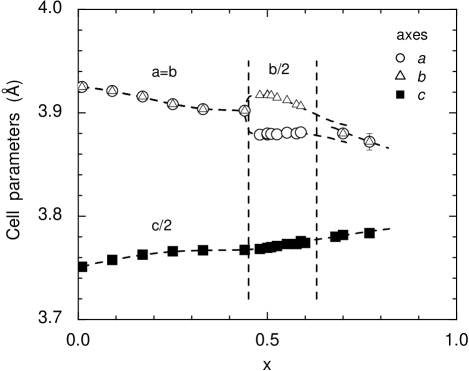
Figure 5 shows the evolution of the GdBaCo2O5+x crystal structure as a function of the oxygen concentration . We can clearly distinguish three different composition regions:
-
•
, the system keeps a macroscopically tetragonal structure, where the unit cell smoothly expands in the direction and shrinks in the in-plane directions with increasing ;
-
•
, the oxygen ions order into alternating filled and empty chains running along the axis, which results in the orthorhombic structure and in the doubling of the unit cell along the axis (see Fig. 2);
-
•
, the system evolves towards a macroscopically tetragonal symmetry, though in quite a complicated way. For crystals located at the lower edge of this composition range, we observed at the same time the x-ray diffraction peaks corresponding to the orthorhombic structure with the unit cell doubling, and those related to the tetragonal structure. This two-phase state is clearly intrinsic and unrelated to a macroscopic oxygen-concentration gradient that would emerge if crystals were improperly annealed. Indeed, the signs of the two-phase state were reproducibly observed only in a quite narrow range of and disappeared as the oxygen content was further increased. At the highest achieved oxygen concentration, we could distinguish only the tetragonal, albeit somewhat broadened, diffraction peaks.
We should keep in mind, however, that this dividing is based only on the macroscopic symmetry, and thus it should not be taken too literally; the behavior of the local structure may in fact be much more tricky. For example, it is quite likely that oxygen ordering or mesoscopic phase separation takes place at small values as well, but the ordered domains are too small to be discernible by conventional x-ray diffraction. The same is also true for high oxygen contents where one may expect fairly ordered phases at , as well as various mesoscopic phase mixtures.
III.2 Resistivity
In perovskite compounds, the electron-band filling can be modified by a partial substitution of cations with elements having a different valence, as in the case of the La1-xSrxO3 compounds ( is a transition metal), and by introducing cation or anion vacancies and interstitials as in V2-yO3, LaTiO3+δ, and YBa2Cu3O6+x. Imada At integer filling (integer number of electrons per unit cell) these compounds are usually band or Mott insulators, yet a metallic state often emerges upon changing the filling level, that is, when electron or holes are doped into the parent insulator.
In GdBaCo2O5+x, it is obviously the composition that is the parent compound, where all the Co ions are nominally in the 3+ state. The limiting phases and should correspond to the 1:1 mixtures Co2+/Co3+ and Co3+/Co4+, respectively, or in other words to the doping levels of 0.5 electrons and 0.5 holes per Co ion. It would not be surprising, therefore, if the composition were insulating, and a metallic behavior were emerging when the oxygen content deviates from towards lower or higher values. The actual behavior of GdBaCo2O5+x, however, turns out to be more complicated: In contrast to the naive expectations, it never becomes a true metal (Fig. 6), even though we change the doping level in a very broad range from 0.5 electrons per Co () up to 0.27 holes per Co ().oxygen At low temperatures, the in-plane resistivity exhibits an insulating behavior throughout the whole accessible range of . Moreover, by looking at the low-temperature region ( K) in Fig. 6, one may easily find out that the resistivity even increases as the oxygen content is reduced below 0.5 (“electron doping”); clearly, the observed evolution differs remarkably from what one usually expects to see upon doping an insulator.
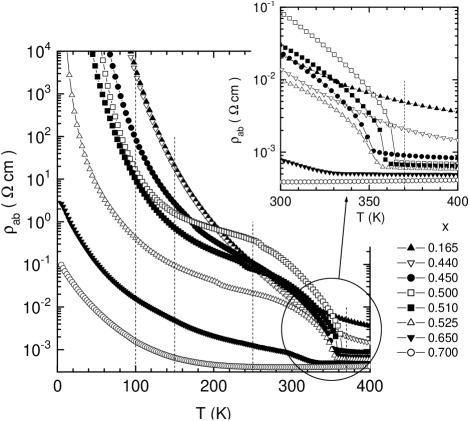
Although GdBaCo2O5+x never behaves as a normal metal, the temperature dependence of its resistivity does not follow that of a simple insulator or semiconductor either. As the temperature increases above K, the in-plane resistivity shows a gradual crossover (for ) or a sharp transition at K (for close to 0.5) into a metal-like state, see inset of Fig. 6. This sharp “metal-insulator” transition (MIT) at is similar to what has been reported for air-sintered RBaCo2O5+x ceramics. Martin ; Maignan ; Troy1 ; Troy2 Although the resistivity cm on the metal side of the MIT is still relatively large, in transition-metal oxides such resistivity values are actually more consistent with a metallic, rather than a hopping transport.Imada As can be seen in the inset of Fig. 6, the metal-insulator transition is the sharpest and takes place at the highest temperature K for , while any deviation from this stoichiometry blurs the MIT and shifts it to lower temperatures. This is particularly clear for high oxygen contents: is reduced to K for , and no distinct transition can be found for . In addition to the MIT, a clear, albeit small, kink is seen on the curves in the temperature range 100-260 K, which is related to a magnetic transition as will be discussed below.
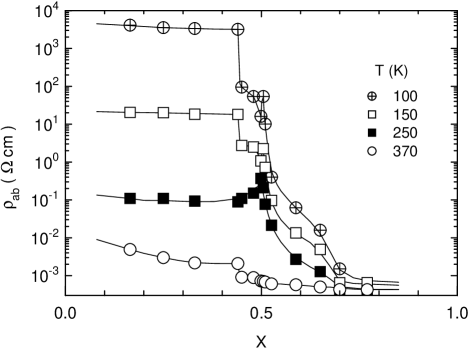
To make it more transparent how the resistivity in GdBaCo2O5+x evolves with oxygen content, in Fig. 7 we plot at several temperatures as a function of . Regardless of the temperature, the -dependence of resistivity splits into roughly the same three composition regions as were observed in the behavior of the crystal structure (Fig. 5). For both low () and high () oxygen concentrations, the resistivity appears to be almost -independent, while in the region it changes rather steeply, by orders of magnitude. This step-like resistivity drop, taking place upon going from “electron-doped” to “hole-doped” compositions, tends to hide the singularity expected for the parent compound. Only very detailed data collected with a step of make this singularity discernible on the low-temperature curves, where it is manifested as a narrow peak in the vicinity of .
In fact, the most unusual and intriguing feature in Fig. 7 is the asymmetry with respect to the oxygen concentration . The resistivity evolution at looks rather conventional: Indeed, doping of % of holes (), which turns Co-ions into a mixed 3+/4+ valence state, dramatically improves the conductivity. As can be seen in Fig. 7, the in-plane resistivity at 100 K drops by more than two orders of magnitude as increases from to 0.525, and by three orders of magnitude more upon further increasing . In contrast, upon electron doping (reducing below 0.50), an initial decrease of the resistivity almost immediately turns into a resistivity growth. Moreover, in a wide region both the absolute value of the resistivity and its temperature dependence are virtually independent of the oxygen content (Figs. 6, 7). Such insensitivity of the conductivity to doping is very unusual, and may only be possible if the electrons released upon removing the oxygen do not participate in the charge transport. This clearly speaks against the “rigid-band” picture, where electrons are expected to fill the lowest-energy unoccupied states. Apparently, the electron doping is accompanied by developing of microscopic insulating states or mesoscopic regions, where the electrons are immediately trapped. At this point it is useful to remind that the insulating nature of the limiting composition has been already understood as coming from the charge ordering of electrons in CoO2 planes into a unidirectional charge-density wave. Vogt ; Suard It is therefore reasonable to suggest that the robust insulating behavior observed in the wide range is also associated with some kind of charge ordering among the doped electrons.
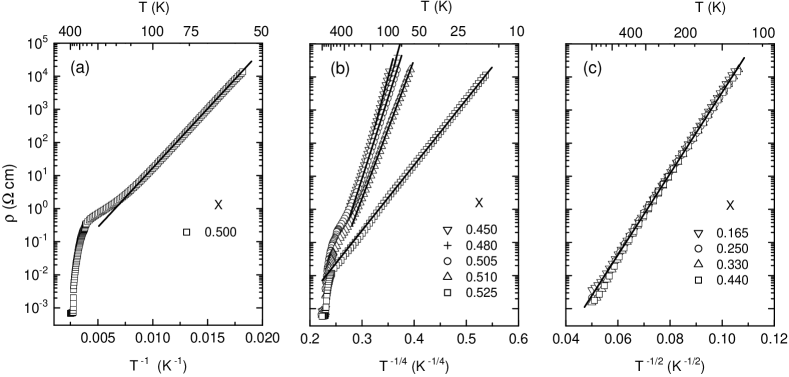
It is interesting to analyze the low-temperature behavior of the resistivity, which can give information on the transport mechanisms operating in the system. Data fitting has shown that a crystal with the precisely tuned composition exhibits a simple activation behavior with meV [Fig. 8(a)], which is well consistent with the understanding of this composition as a parent insulator (narrow-gap semiconductor). However, when the oxygen content deviates somewhat from , the resistivity behavior almost immediately switches into the 3D variable-range hopping (VRH) mode,Mott , as shown in Fig. 8(b). This type of conduction is typical for disordered systems where the charge carriers move by hopping between localized electronic states. The formation of such localized states may be rather simply conceived of in the following way: Initially, at the oxygen composition of , GdBaCo2O5+x possesses a well-ordered crystal structure, where the oxygen ions form perfect filled and empty chains alternating along the axis (Fig. 1). When the oxygen concentration deviates from , this results either in vacancies emerging in the filled chains, or in oxygen ions that go into the empty chains. While these oxygen defects inevitably generate electrons or holes in the CoO2 planes, they also produce a poorly screened Coulomb potential that may well localize the generated carriers, so that some of the adjacent Co ions acquire the Co2+ or Co4+ state. Then the conductivity occurs through hopping (tunneling) motion of such localized Co2+ or Co4+ states. As can be seen in Fig. 8(b), the slope of the resistivity curves monotonically decreases with increasing , implying that the localization length of holes (Co4+ states) is noticeably larger than that of electrons.
Upon further decreasing the oxygen content below , the temperature dependence of the resistivity becomes steeper than expected for the Mott’s VRH regime, , and we find that it is better fitted by the Efros-Shklovskii expression for the hopping conductivity,Efros , see Fig. 8(c). The latter behavior is usually observed when the Coulomb interaction starts to play a key role in carriers hopping, bringing about a strong depletion in the density of states (Coulomb gap) near the Fermi energy. The data in Fig. 8 imply that the Coulomb-repulsion effects in GdBaCo2O5+x gain strength as the oxygen content is reduced below .
The unusual resistivity behavior at high oxygen concentrations (Fig. 6) is also worth mentioning. For both the and crystals, smoothly increases by orders of magnitude upon decreasing temperature, and reaches apparently non-metallic values of the order of 1 cm. Nevertheless, it becomes also clear from Fig. 6 that, at least in the temperature range studied, the resistivity tends to saturate at a finite value, instead of diverging at ; such behavior would indicate a metallic ground state, if the resistivity values were not that large. A possible solution of this puzzle is an intrinsic mesoscopic phase separation, that makes the carriers to move along filamentary conducting paths. Mesosc In this case, the zero-temperature conductivity, being determined by the topology of the metallic phase, may be arbitrary small and can easily violate the Mott limitMott that sets the minimum metallic conductivity for homogeneous systems. This picture is quite plausible, since, as we have mentioned above, the crystal structure at these high oxygen concentrations actually bears signs of phase separation.
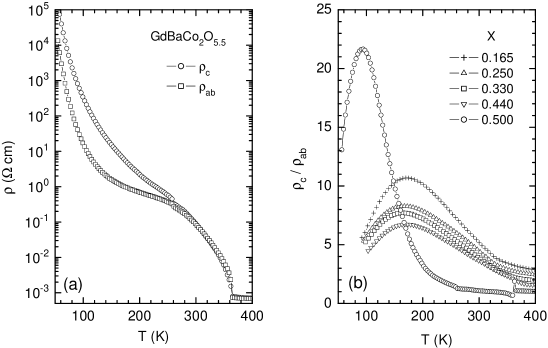
Thus far we discussed the resistivity behavior along the CoO2 planes, which is however not the full story, since one might anticipate a strong electron-transport anisotropy to be brought about by the layered crystal structure of GdBaCo2O5+x. Indeed, many layered transition-metal oxides, such as high- cuprates,cupr_Rc manganites,mang_Rc or even cobaltites built from triangular-lattice CoO2 planes,NaCoO ; misfitRc exhibit huge anisotropy values and contrasting temperature dependences of the in-plane and out-of-plane resistivity. In the case of GdBaCo2O5+x, where the GdOx layers with variable oxygen content are located in between the CoO2 planes (Fig. 1), it would be natural to expect a kind of 3D-to-2D transition to occur upon reducing from 1 to 0, that is, as the oxygen ions binding the CoO2 planes are removed. However, a comparison of the in-plane and out-of-plane resistivity in Fig. 9 shows that this is not really the case. The anisotropy indeed increases slightly as the oxygen concentration is reduced from towards zero [Fig. 9(b)], but remains rather moderate. In fact, a considerable anisotropy is observed only at intermediate temperatures, while at both high and low temperatures GdBaCo2O5+x tends to become virtually isotropic. It turns out therefore that the oxygen-depleted GdOx layers do not constitute a serious obstacle for the -axis electron motion.
Somewhat different behavior of the parent GdBaCo2O5.50 compound provides a clue to understand the mechanism responsible for resistivity anisotropy. As can be seen in Figs. 9(a), 9(b), the in-plane and out-of-plane resistivities stay virtually indistinguishable from each other down to , where the FM-AF transition takes place.GBC_PRL Upon further decreasing the temperature, the curves sharply diverge and grows from at up to at 100 K. This indicates that the charge motion in GdBaCo2O5+x is very sensitive to the arrangement of Co spins, and it is the peculiar spin ordering in this system that is responsible for the appearance of conductivity anisotropy.
III.3 Thermoelectric power
Among the features that currently attract a lot of attention to transition-metal oxides are their unusual and potentially useful thermoelectric properties.NaCoO ; S_book ; LaSrTiO ; Proceed The peculiar thermoelectric behavior in TM oxides is often attributed to strong electron correlations,Koshibae ; Ando_specific_heat though the picture still remains far from being clear. In this respect, the RBaCo2O5+x compounds, being capable of smoothly changing the doping level in a very broad range, appear to provide a good testing ground for studying the problem.
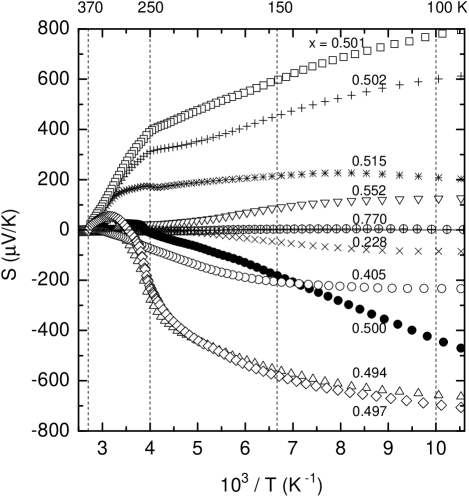
The thermoelectric power measured on both single-crystal and ceramic GdBaCo2O5+x samplesS_cer throughout the available oxygen-concentration range is presented in Fig. 10. Following the usual approach in analyzing the behavior of semiconductors, we have plotted the data in the inverse-temperature scale, since in semiconductors the thermoelectric power is expected to be linear in with a slope reflecting the activation energy for charge carriers , . It becomes immediately clear from Fig. 10 that the only composition that exhibits a conventional semiconducting behavior is , with the activation energy meV being in good agreement with that deduced from the resistivity data in Sec. III.2. Just a subtle deviation of the oxygen concentration from (by merely 0.001) qualitatively changes the thermoelectric behavior: becomes almost temperature independent at K, indicating that the electron transport is no longer governed by the band gap. It is worth noting that the resistivity of GdBaCo2O5+x also switches its behavior from a simple activation one into the variable-range hopping mode upon deviation from the parent composition (Fig. 8).
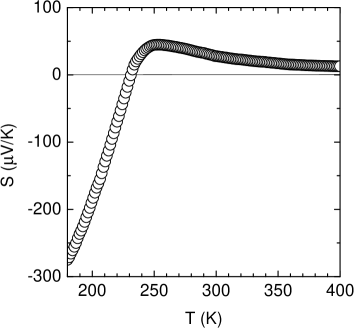
The salient feature in Fig. 10 is a very abrupt change in sign of the low-temperature thermoelectric power upon crossing ; (100 K) jumps from V/K at up to V/K at . In fact, this sign change unambiguously indicates that the type of change carriers sharply switches from electrons () to holes () without any messy intermediate state. It turns out to be possible, therefore, to drive the doping level in GdBaCo2O5+x continuously across the parent insulating state (so that the Fermi level jumps across the gap), which is really unusual among transition-metal oxides. The feature that makes possible such continuous and smooth doping of GdBaCo2O5+x is the metal-insulator transition at : At temperatures where the oxygen concentration is modified, the gap in the electronic band structure is closed and, therefore, the chemical potential changes gradually with the changing of the carriers concentration.
The metal-insulator transition at K has a spectacular manifestation in the thermoelectric properties (Figs. 10 and 11), owing to the high sensitivity of to details of the electronic structure. As can be seen in Fig. 11, at high temperatures K, is very small ( V/K), as is usually the case with ordinary metals, and virtually independent of temperature. Moreover, it does not change with doping either, implying that the Fermi level is positioned in the middle of a wide conduction band. Upon cooling the sample below 370 K, however, the thermoelectric power abruptly increases, indicating that the conduction band splits and a band gap opens near the Fermi level. Depending on the doping, the Fermi level gets trapped inside the newly created valence or conduction band, determining which type of carriers – electrons or holes – will prevail. Immediately after the transition, appears to be positive even in slightly electron-doped samples (), indicating that while both electrons and holes are contributing to charge transport at these temperatures, the holes have considerably higher mobility. At lower temperatures, carrier excitations over the gap become suppressed, letting only one type of carriers survive; consequently, at K the sign of is uniquely determined by the doping level ( or ).
One may wonder whether and how these two transport properties – resistivity and thermoelectric power – correlate in GdBaCo2O5+x. In conventional doped semiconductors, for instance, such correlation is rather straightforward if one type of carriers dominates. Namely, the resistivity and thermoelectric power are both governed by the activation energy of carriers, and , and thus are related roughly as . This qualitative relation implies that upon doping a semiconductor, its thermoelectric power should decrease (in absolute value) by roughly 200 V/K per order-of-magnitude reduction in resistivity. In fact, this trend is not restricted to conventional semiconductors, but holds also in many other non-metallic systems, including doped Mott insulators, Jonker_P ; Jonk_cup ; FeCrSe though the slope may differ from V/K.
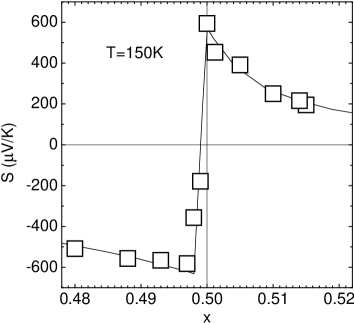
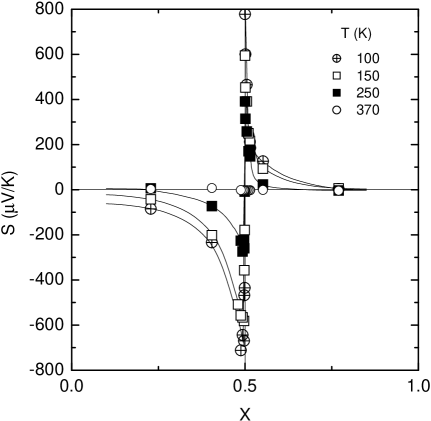
If this -vs.- correlation were also working in the case of GdBaCo2O5+x, its thermoelectric power would show a step-like decrease in magnitude upon increasing , following the asymmetric resistivity curves ( vs. ) shown in Fig. 7. However, Fig. 12, which presents at several temperatures as a function of the oxygen concentration, makes it immediately clear that these expectations fail. Instead, the doping dependence of thermoelectric power turns out to be fairly symmetric with respect to the parent, , composition: exhibits a spectacular divergence with approaching , where it reaches large absolute values and changes its sign upon crossing this peculiar doping level. It is worth noting that switches from being negative (electron-like) to positive (hole-like) within a very narrow but discernible region around (its expanded view is given in Fig. 13); this slight thermally-induced smearing gives evidence for a continuous evolution in the CoO2-plane doping. When the oxygen concentration deviates from , smoothly reduces its magnitude, eventually approaching a small constant value (Fig. 12). The curves keep this singular and fairly symmetric behavior regardless of temperature, except for the high-temperature “metallic” region ( K), where the thermoelectric power is small and virtually doping independent (Fig. 12). In fact, the striking contrast in the doping dependences of two transport properties – symmetric and asymmetric – is one of the most intriguing feature in the thermoelectric behavior of GdBaCo2O5+x.
The smooth evolution of with decreasing oxygen content below shown in Fig. 12 breaks down, however, upon approaching the limit of – another peculiar composition corresponding to the 50% electron doping. This composition is known for the long-range charge ordering that sets in below K, as was observed in YBaCo2O5.0 and HoBaCo2O5.0.Vogt ; Suard A similar charge ordering presumably takes place in GdBaCo2O5.0 as well, and it has a clear manifestation in the behavior of thermoelectric power, whose magnitude quickly increases below 230-240 K (Fig. 14). The long-range charge ordering at 50%-electron doping and its impact on the charge transport, being interesting in their own right, need a detailed study, which however goes beyond the scope of the present paper.
III.4 Magnetization
III.4.1 General features
Broadly speaking, it would be quite natural for cobalt oxides to possess magnetic properties more complex than those of isostructural compounds based on most other transition metals. The reason for this additional complexity is that cobalt ions in a given valence state can have more than one allowed spin state; for example, Co3+ ions can acquire a low-spin (LS: , ; ), intermediate-spin (IS: , ; ), or high-spin (HS: , ; ) state.Martin ; Maignan ; cubic_Co ; BiCo2201 ; Troy1 ; Troy2 ; OpticalSm ; Suard ; Vogt ; Moritomo ; Akahoshi ; Kusuya ; Respaud ; GBC_PRL ; Moritomo2 ; Frontera These states appear to be located quite close to each other in energy, bringing about a possibility of the spin-state transitions/crossovers upon changing temperature or lattice deformation.
Keeping in mind a possibility of wide-range charge doping in GdBaCo2O5+x, which affects both the valence state of Co ions and the magnetic interactions, structural ordering phenomena, and a possible nanoscopic phase separation, in addition to the spin-state degree of freedom, one might expect the magnetic phase diagram in this system to be extremely complicated or even messy. In reality, the magnetic behavior of GdBaCo2O5+x turns out to be indeed rich, but still following fairly simple empirical rules. As will be discussed below, the possible spin arrangements in GdBaCo2O5+x appear to be dramatically simplified by an exceptionally strong spin anisotropy, which essentially pins the spin orientation.GBC_PRL This fortunate feature turns GBCO into a good model system, yet it also emphasizes the necessity to perform all the magnetic measurements on single crystals only.
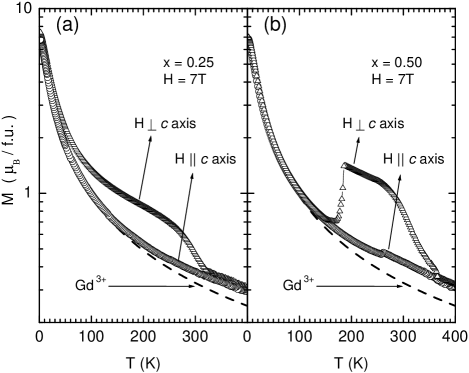
Figure 15 illustrates the method used to determine the anisotropic magnetization contribution coming from the cobalt ions. For every oxygen composition, we measured the magnetization of GdBaCo2O5+x crystals with the magnetic field T applied along or transverse to the CoO2 planes. From the overall magnetization we then subtracted an isotropic contribution of Gd3+ ions (shown by dashed lines in Fig. 15), assuming their ideal paramagnetic behavior with spin ; the latter appeared to be a good approximation since we found no sign of Gd3+ spin ordering down to K in any of the crystals. Hereafter, all the magnetization data will be presented after subtracting the contribution of Gd3+ ions.
When the magnetic field is applied along the CoO2 planes (), their magnetization exhibits several doping-dependent anomalies, which include a ferromagnetic-like behavior at moderate temperatures (Fig. 15). In sharp contrast, the -axis magnetization () appears to be always smaller and virtually featureless throughout the whole doping range, except for a weak step-like feature associated with the metal-insulator transition at K for , which is observed for any field orientation. This persistent anisotropy clearly indicates that regardless of the oxygen content, the cobalt spins in GdBaCo2O5+x are strongly confined to the CoO2 planes. As can be seen in Fig. 15, even when cobalt ions develop a fairly strong ferromagnetic moment along the plane ( per formula unit at K), the 7 T field appears to be far too weak to overcome the spin anisotropy and to turn this ferromagnetic moment towards the -axis. In the following, we will focus on the in-plane magnetic behavior, since the -axis magnetization is governed simply by a weak field-induced rotation of Co moments out of the plane, that is, by a competition between the Zeeman energy and a single-ion spin anisotropy.
Another general feature of the magnetization in GdBaCo2O5+x is a pronounced thermo-magnetic irreversibility. Regardless of doping, the data taken upon cooling the sample in magnetic field (FC) differed from those obtained on heating after the sample was cooled in zero field (ZFC), as illustrated in Fig. 16. As the magnetic field increases, the ZFC curve approaches the FC one, yet the difference remains well discernible even at T.
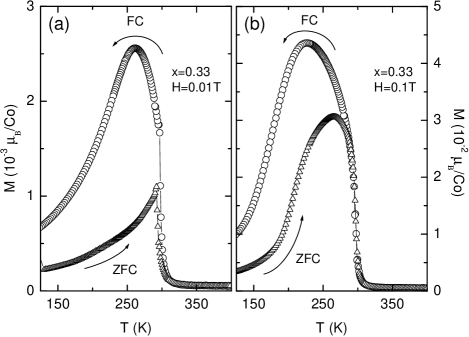
Quite often such magnetic irreversibility observed in transition-metal oxides is attributed, sometimes without due care, to the formation of a spin-glass state. It should be noted, however, that the idea of a spin glass implies that no long-range (or intermediate-range) order is developed in the spin system.SG We have found that in the case of GdBaCo2O5+x, the magnetic irreversibility shows up only below the onset of a ferromagnetic-like behavior (Fig. 16) and thus is most likely associated with a conventional ferromagnetic domain structure or with a metamagnetic transition. It should not be surprising also if the FM domain structure in GBCO appears to be very robust: one may just imagine how difficult it should be for a FM domain composed of Ising-like spinsGBC_PRL to change the direction of magnetization. Whatever the doping level in GdBaCo2O5+x was, we never observed a conventional spin-glass behavior, and thus we suggest that all magnetic irreversibilities in this system are related to the spin rearrangement within a spin-ordered state.
III.4.2 Evolution with doping

At , GdBaCo2O5+x exhibits an antiferromagnetic behavior as was previously reported for other RBaCo2O5.0 compounds studied by magnetization measurements and neutron powder diffraction;Suard ; Akahoshi ; Vogt the latter identified a -type AF ordering for spins of the cobalt ions [labeled as AF(1) hereafter]. It becomes increasingly more difficult to determine the magnetization component coming from the Co ions as approaches zero, because the contribution from the Gd ions becomes dominant in the temperature range of interest; therefore, it is useful to look at the behavior of YBaCo2O5+x – the only known isostructural compound with non-magnetic R ionsYLaLu (Fig. 17). The magnetization of YBaCo2O5.0, being in rough agreement with the evaluated contribution of cobalt ions to the magnetization of GdBaCo2O5.0, is quite small and shows two anomalies at K and K, which were attributed by Vogt et al. to the onset of an AF spin order and a unidirectional charge order, respectively.Vogt It is worth noting that the same types of ordering at virtually the same temperatures were also found in HoBaCo2O5.0 (Ref. Suard, ) and NdBaCo2O5.0 (Ref. Soda, ), which gives evidence that this spin and charge ordering is governed solely by the physics of CoO2 planes.
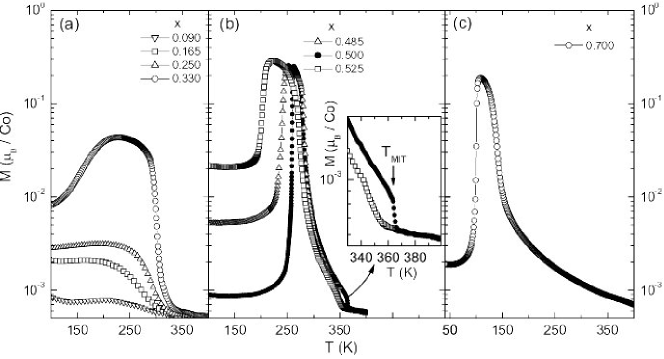
When the antiferromagnetic GdBaCo2O5.0 is doped with oxygen, it immediately causes an increase of magnetization at temperatures below K [Fig. 18(a)]; this looks like a new ferromagnetic-like component emerging and growing in a rough proportion to the oxygen concentration up to . To our surprise, the onset temperature of this FM behavior remains constant, ignoring the growth of the overall FM moment. Apparently, such behavior would certainly indicate a formation of a distinct chemical phase, if the structural data did not demonstrate that all the crystals were perfectly homogeneous on a macroscopic scale (down to the scale resolved by conventional X-ray technique).
One might speculate that the doped oxygen induces canting of antiferromagnetically ordered cobalt spins which then mimic the ferromagnetic behavior, as happens in many other canted antiferromagnets, such as La2CuO4 LCO , where a slight spin rotation brings about a weak ferromagnetism. However, a rather large magnitude of FM moment, exceeding, for example, in the sample Co at T, is apparently inconsistent with such weak spin canting.
The remaining possibility is that the ferromagnetic response originates from nanoscopic FM droplets imbedded in the AF(1) matrix; they may be associated with adjacent oxygen clusters in GdOx planes or just with nanoscopic regions of CoO2 planes enriched with charge carriers. These FM clusters should be at least several unit cells in size to survive thermal fluctuations and to produce more than just a paramagnetic response, yet small enough to avoid being detected as a macroscopic phase. Indeed, this hypothesis finds support from the field dependences of the magnetization measured in moderately doped GdBaCo2O5+x (), which exhibit a curious combination of ferromagnetic features (e. g., thermomagnetic irreversibility) with superparamagnetic ones. For example, in the crystal, the curves appear to be almost perfectly linear, that is, is independent of , without any sign of saturation up to 7 T [Fig. 19(a)]. In fact, this is a canonical behavior of a superparamagnet – a paramagnetic system, where the role of individual spins is played by the moments of FM clusters. A slow saturation appears in the curves at higher oxygen concentrations (as an example, Fig. 19(b) shows / data for ), indicating that FM domains grow and probably also start interacting with each other.
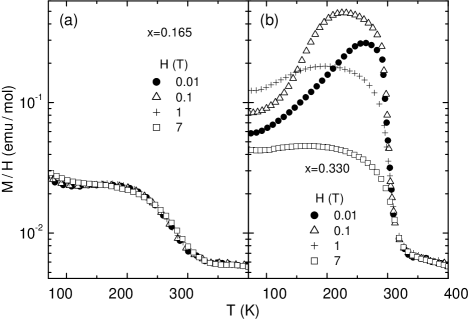
Interestingly, the FM ordering introduced by oxygen seems to be unstable at low temperatures and the magnetization increase starting below 300-320 K smoothly gives way to an AF-like behavior as the temperature is further reduced [Figs. 18(a) and 19(b)]. As can be seen in Fig. 19(b), a strong magnetic field can affect this FM-AF competition, suppressing the low-temperature magnetization drop: at T, diminishes by more than 5 times with decreasing temperature from 200 K to 100 K, while at T it remains almost constant.
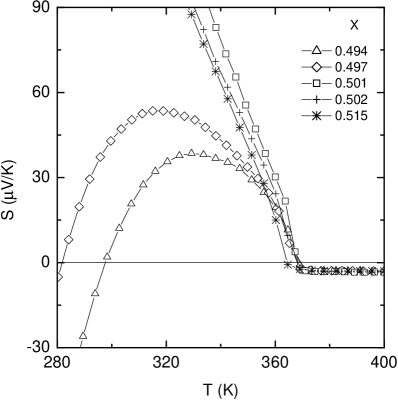
The sequence of magnetic transitions becomes most clear in the oxygen-concentration range near [Fig. 18(b)]. For these compositions, a net ferromagnetic moment appears in the cobalt sublattice below K, and then suddenly vanishes upon further decreasing temperature (at K for ), indicating successive PM-FM-AF transitions. The FM state shows up only in a narrow temperature window, which has the smallest width of less than 40 K for . Whenever the oxygen concentration deviates from the parent composition , be it on the electron-doped or the hole-doped side, the FM phase becomes more stable and the FM-AF transition shifts to lower temperatures [Fig. 18(b)]. Also, the low-temperature magnetization in both cases shows notably higher values, indicating a deviation from a pure AF spin order that is realized in GdBaCo2O5.50.
Another important feature of the magnetization behavior in the range of is a step-like change of both the magnetization and its slope at K [inset in Fig. 18(b)], exactly at the temperature of the metal-insulator transition observed in our resistivity and thermoelectric-power measurements (Figs. 6 and 11). This change takes place in the paramagnetic region and is caused by the spin-state transition of Co3+ ions as has been concluded based on the Curie-Weiss fitting of the PM susceptibility and structural studies of GdBaCo2O5+x and isostructural compounds.Respaud ; Frontera ; Martin ; Moritomo ; GBC_PRL Similar to the behavior observed in resistivity (Fig. 6), any deviation in stoichiometry from blurs the spin-state/metal-insulator transition and shifts it towards lower temperatures [inset in Fig. 18(b)].

As the oxygen content in GdBaCo2O5+x exceeds , its magnetic behavior notably changes. In this moderately hole-doped region, only crystals with give an impression of being homogeneous [Fig. 18(c)]. For this composition, the FM order develops at much lower temperatures than for , namely, below 150 K, suggesting a different spin arrangement of Co3+ and Co4+ ions; the FM ordering however is still followed by a sharp FM–AF transition at K [Fig. 18(c)]. For other oxygen concentrations, the curves clearly demonstrate a superposition of two magnetic phases, corresponding to and (Fig. 20). What distinguishes this composition region from the electron-doped samples () is that here the phase separation (taking place in macroscopically homogeneous crystalshomogen ) is also well seen in the structural data, see Sec. III.1, which implies a fairly large size of magnetic and crystallographic domains. Since the Coulomb interaction would prevent a formation of large charged domains, the phase separation should also involve a macroscopic redistribution of oxygen ions over the crystal. One might further speculate that the homogeneous state with corresponds to an ordered “Ortho-III” phase where two filled oxygen chains in GdOx layers alter with one empty chain (O-O-X-O-O-X), in contrast to the phase exhibiting a one-to-one alteration (O-X-O-X). It would be interesting to search for the superlattice peaks corresponding to this putative “Ortho-III” structure using high-intensity x-ray measurements. Given a very high oxygen mobility, the oxygen ions could easily form ordered domains when crystals were cooled down after annealing. More structural studies are however necessary to build a conclusive picture.
III.4.3 Detwinned GdBaCo2O5.50 crystals
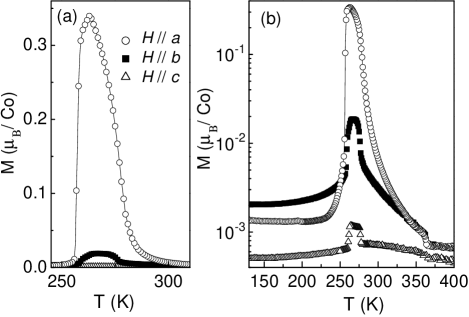
As it becomes clear from the data presented above, the magnetic properties of the parent GdBaCo2O5.50 composition are most important for understanding the overall magnetic behavior of GdBaCo2O5+x. Since the crystal structure at is orthorhombic (see Sec. III.1), we had to detwin crystals in order to obtain single-domain samples for an accurate and detailed study. The magnetization of a detwinned GdBaCo2O5.50 single crystal (a fraction of misoriented domains %) measured along the , , and axes reveals a remarkable anisotropy of the spin system [Fig. 21(a)]: In the FM state that shows up in a narrow temperature window below 300 K, the net FM moment appears only along one of the orthorhombic axes, namely, along the axis. This behavior suggests that the cobalt spins in GdBaCo2O5.50 are not only strongly confined to the CoO2 planes (Sec. III.4.1), but are also pinned to one of the in-plane directions; in other words, the spins system appears to be Ising-like. Note that a small magnetization along the axis in Fig. 21 comes mostly from residual misoriented domains.
The logarithmic plot in Fig. 21(b) provides additional details. As we have already discussed, the -axis magnetization in GdBaCo2O5.50 is almost featureless similar to all other compositions (a small hump in the FM region is several hundred times smaller than for ; moreover, it may come in part from imperfect alignment of the crystal in the magnetometer). The behavior of the in-plane magnetization is more interesting: In the FM region, is much larger for than for , but the situation abruptly turns over as the crystal enters the AF region. Given that the transverse susceptibility of an antiferromagnet exceeds the longitudinal one, we can conclude that the cobalt spins keep their spin easy axis () upon the FM-AF transition. In other words, the cobalt spins are aligned along the axis in the FM state and they keep being aligned along the axis in the AF state; what happens upon the FM-AF transition is that the spins in one of sublattices just flip by .
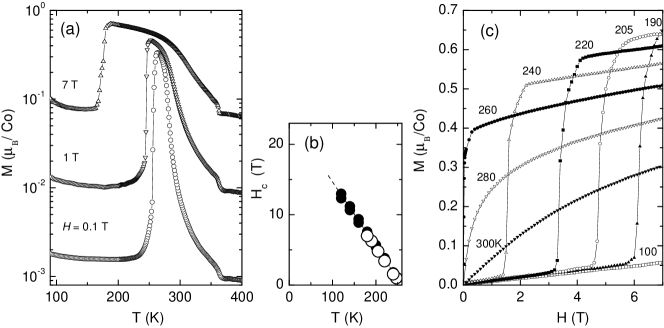
The balance of FM and AF ordering in GdBaCo2O5.50 turns out to be quite delicate, so that it can be easily affected by magnetic fields applied along the spin-easy axis, which stabilize the FM state and shift the FM-AF transition to lower temperatures (Fig. 22). We find that the magnetic field required to overcome the AF coupling grows roughly linearly with cooling, from zero at K up to T at . It is worth noting that the AF-FM transition remains very sharp even in the temperature range close to 260 K, where rather weak fields ( T at 240 K, i.e. ) are capable of recovering the FM order [Figs. 22(a) and 22(c)], which shows that thermal fluctuations are irrelevant here. This behavior clearly indicates that the observed AF-FM switching is a metamagnetic transition, that is, it occurs within the ordered spin state and is governed by the relative reorientation of weakly-coupled spin sublattices.
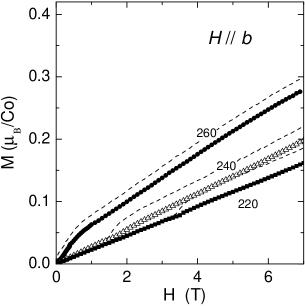
Whatever the temperature, the 7-T field or appears to be too week to compete with the spin anisotropy; it neither can turn the FM moment towards the or axis in the FM region, nor can it induce the AF-FM transition at K. The only impact of is therefore to cause a partial tilting of the cobalt spins from their easy axis, thus giving linear curves in both FM and AF regions (Fig. 23). The spin anisotropy between the axis and the plane is several times stronger than the in-plane anisotropy; consequently, the slope of the curves for is several times smaller than that shown in Fig. 23.
It is interesting to examine the magnitude of the moment that shows up in the FM state, which can be easily done using the data in Fig. 22(c). The FM moment turns out to exceed Co at K, and a rough extrapolation to suggests a saturated magnetic moment of Co (Fig. 24). It is worth noting that polycrystalline RBaCo2O5.5 samples were reported to demonstrate noticeably smaller FM moments.Troy1 ; Respaud ; Akahoshi This apparent discrepancy originates from the Ising spin anisotropy that prevents moments from being seen along the and axes; a detwinned single crystal is clearly necessary to make the true FM moment of Co visible.
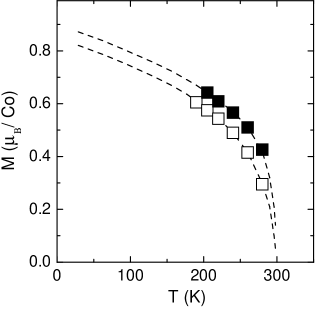
While this value is apparently too large to be accounted for by any spin-canting picture, it agrees well with the expectation for a simple FM order, if the Co3+ ions in this temperature range possess a 1:1 mixture of low-spin and intermediate-spin states. In fact, the same conclusion on the spin states of Co3+ ions has been also reached based on the Curie-Weiss fitting of the PM susceptibilityRespaud ; Martin ; GBC_PRL in the temperature range 300-360 K (Figs. 18 and 22), as well as based on the structural data.Frontera
III.5 Magnetoresistance

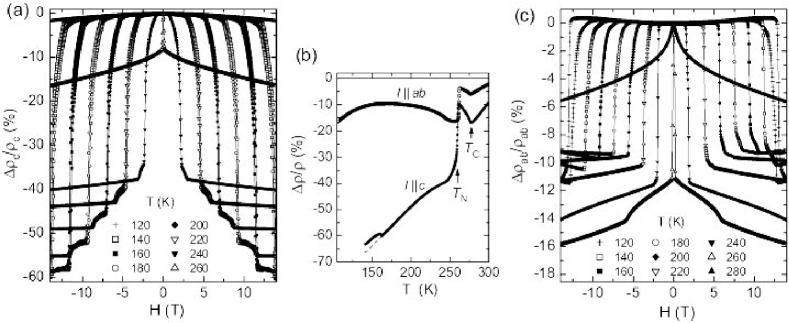
In compounds with competing magnetic orders, a magnetic field that favors one kind of ordering often causes also a large magnetoresistance; GdBaCo2O5+x is no exception. The charge transport in this system turns out to be very sensitive to both the FM and AF ordering, and magnetic fields readily induce a giant magnetoresistance by affecting the subtle AF-FM balance.Respaud ; GBC_PRL As an example, Fig. 25 shows the -axis resistivity of a twinned GdBaCo2O5.50 crystal measured at and 14 T. In zero field, the FM-AF transition at K brings about a step-like increase of the resistivity [Fig. 25(b)]; a similar, albeit smaller, step is observed in as well. A 14-T field applied along the plane shifts the magnetic transition towards lower temperatures and wipes out the resistivity increase, thus causing the resistivity to drop by up to several times.
As can be seen in Fig. 25(a), grows roughly exponentially upon cooling below K regardless of the applied field; the charge carriers, therefore, have different activation energies in the FM and AF states, and the MR originates from the reduction in this activation energy. As soon as the magnetic field becomes insufficient to maintain the FM order, the system switches into the AF state [at T], and the resistivity jumps to its zero-field value [Fig. 25(a)].
Unfortunately, we did not succeed in detwinning the crystals with already prepared electrical contacts, and thus the measurements were carried out on twinned crystals, which does not allow us to analyze the MR quantitatively. The role of twins is less critical for , since we find the orthorhombic domains to always go through the whole crystal from one face to another. Consequently, the measuring current does not cross domain boundaries, and the observed magnetoresistance is just reduced from its true value by some factor, since not all domains are affected by the magnetic field. Upon measuring , however, the current flowing in the plane has to pass through both kinds of orthorhombic domains which form a striped structure. The measured thus depends not only on the ratio of domains, but also on the yet unknown anisotropy .
In spite of this complication, the qualitative behavior of the MR remains clear. At 260 K, the in-plane magnetic field induces an abrupt decrease in both and (Fig. 26), which occurs at exactly the same field as the AF-FM transition in magnetization, leaving no doubts about its origin. At higher temperatures, the resistivity changes gradually, again resembling the magnetization behavior in Fig. 22(c). In the latter case, the MR seems to originate from the field-induced stabilization of the FM order; the magnetic field suppresses critical FM fluctuations, thus facilitating the charge motion.
The temperature dependences of and in Fig. 26(b) nicely illustrate the correlation of the MR with the magnetic behavior. Upon cooling, we first observe a clear peak at K in the MR, which can be associated with the FM transition (the peak position coincides with the peak in in Fig. 21). Apparently, the FM fluctuations that are strongest near frustrate the charge motion, providing contribution of about 20% to resistivity, and this contribution is removed when a strong magnetic field is applied. It is worth noting, that this negative MR peak near closely resembles the MR behavior of such ferromagnetic oxides as cubic La0.5Ba0.5CoO3 (Ref. Fauth, ) and La1-xSrxMnO3 (Ref. Imada, ), where the resistivity change is usually explained by the double-exchange mechanism.Double Upon further cooling, the MR abruptly increases at . The origin of this MR is obvious: Without field, the AF ordering enhances the resistivity, while the applied magnetic field prevents establishing the AF order. As can be seen in Fig. 26(b), the -axis MR quickly gains strength with cooling. At 150 K, drops by three times at 14 T, and the ratio would keep growing to much larger values with lowering temperature if fields exceeding were applied.Respaud The in-plane MR seems to be by several times smaller; the magnitude and the temperature dependence of should, however, be taken with a grain of salt, since, as we mentioned above, a detwinned crystal should be measured to determine the true MR values.

The MR anisotropy with respect to the magnetic-field direction can provide interesting information on the cobalt-spin anisotropy. In general, when an Ising-like antiferromagnet is subjected to an increasingly strong magnetic field, it eventually turns into a FM state, whatever the field direction is. If the field is applied along the spin-easy axis, the spin-flip transition is abrupt, while for the transverse direction, the spins rotate gradually and much higher fields are required to align them. In the latter case, the rotation angle is roughly , where is the spin anisotropy energy. It is reasonable to expect that the MR in GdBaCo2O5+x, being roughly proportional to the magnetization, will change with the field as , tending to reach its saturation value at . Thus, the anisotropy of magnetoresistance in addition to that of magnetization may be used to probe how strongly the spins are coupled with the crystal lattice.
An experimental study of GdBaCo2O5.50 crystals reveals that the MR anisotropy is surprisingly large and the 14-T field can do nothing comparable to the MR caused by a much less field (Fig. 27). Indeed, the MR is barely seen for , especially [Fig. 27(b)], which is as small as 0.14% at 14 T, while for the in-plane field it readily reaches a two orders of magnitude larger value. This indicates that magnetic fields in the 100-T range would be necessary to rotate the cobalt spins in GdBaCo2O5.50 from the to the axis, overcoming the remarkable spin anisotropy. It is worth noting, that such spin-anisotropy energy, roughly estimated to be of the order of 10 meV/Co (), is extremely large compared with any known magnetic materialtypical_MA ; largest_MA and is close to the giant magnetic anisotropy observed in nanoclusters.largest_MA This huge spin anisotropy can also account for a considerable anisotropy in susceptibility, , that survives even in the paramagnetic state up to 400 K.
III.6 Phase diagram of GdBaCo2O5+x
An empirical phase diagram of GdBaCo2O5+x based on the obtained structural, transport, and magnetic data is sketched in Fig. 28 as a function of the oxygen concentration. At the lowest oxygen content, , GdBaCo2O5+x is an antiferromagnetic insulator [AFI(1)]; its low-temperature phase should most likely correspond to a charge-ordered -type antiferromagnet, by analogy with other isostructural compounds studied using neutron diffraction.Vogt ; Suard ; Soda
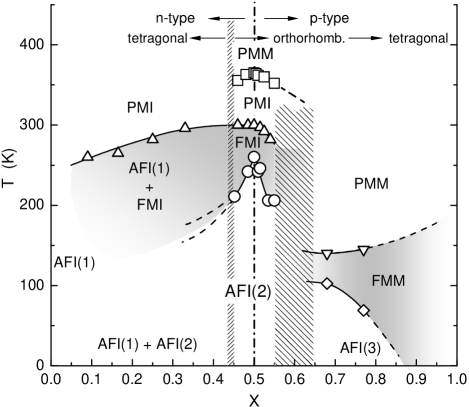
An increase in the oxygen content is found to immediately result in the formation of isolated ferromagnetic clusters imbedded in the antiferromagnetic [AFI(1)] matrix. These clusters demonstrate a paramagnetic behavior above K (marked by open triangles in Fig. 28), and a curious combination of superparamagnetic and ferromagnetic features below ; namely, the magnetization does not saturate in magnetic fields up to 7 T (as in canonical superparamagnets), yet the FM moments exhibit an extremely strong coupling with the crystal lattice, which is manifested in the magnetic anisotropy and thermo-magnetic irreversibility.
With further increasing oxygen content in GdBaCo2O5+x (up to ), the FM clusters smoothly grow in size, reaching percolation, and develop at low temperatures an intrinsic instability towards a new type of AF ordering [AFI(2)], which is the ground state of the parent GdBaCo2O5.50 compound.GBC_PRL The AFI(2) order emerges from the FM order in clusters and differs essentially from the AFI(1) state that is realized at ; for instance, the AFI(2) ordering can be easily suppressed by a magnetic field, while AFI(1) is quite robust. One can consider GdBaCo2O5+x over a wide composition region of as being composed of nanoscopic phases mixed together: At high temperatures, the system behaves as a paramagnetic insulator; then, below , as a mixture of FM and AF insulating phases; and finally at low temperatures, it evolves into a mixture of two distinct AF phases [AFI(1) and AFI(2)]. The resistivity in this composition range shows a robust insulating behavior without any noticeable change with increasing . The room-temperature crystallographic structure retains a macroscopically tetragonal symmetry with smoothly changing lattice parameters.
The region with the richest behavior, , occupies the center of the phase diagram around the “parent” composition . In this doping range, the crystal structure is macroscopically orthorhombic up to rather high temperatures due to the ordering of oxygen into alternating full and empty chains that run along the axis (at C, we still observed a twin structure related to the oxygen ordering). Owing to this structural order, the broad magnetic and transport features emerging already at come in focus here, and GdBaCo2O5+x demonstrates a series of sharp phase transitions upon cooling: first, from a paramagnetic metal (PMM) to a paramagnetic insulator (PMI) at (open squares in Fig. 28), which is also accompanied with a spin-state transition, then to a ferromagnetic insulator (FMI) at , and, finally, to an antiferromagnetic insulator [AFI(2)] at (open circles).
The “parent” composition GdBaCo2O5.50 is a metal at high temperatures but turns into a semiconductor upon cooling below the metal-insulator transition. In fact, the composition represents a kind of borderline that divides the central region of the phase diagram into two roughly symmetric parts which correspond to electron-doped and hole-doped semiconducting states below . All transport properties show anomalies in their doping dependences at , indicating that the density of doped carries smoothly goes to zero with approaching this point from either side. As can be seen in Fig. 28, all the transition temperatures also exhibit maximum values exactly at . The only property demonstrating a striking asymmetry with respect to is the resistivity which is much smaller for the hole-doped side ().
When the oxygen concentration exceeds , GdBaCo2O5+x develops a new phase possessing considerably lower temperatures of the ferromagnetic transition ( K) and the FM-AF transition ( K). Until reaches , this new phase is mixed (on a mesoscopic scale) with the phase, and only at the system again recovers its homogeneity. Surprisingly, in the region, the series of successive PM-FM-AF transitions, albeit happening at reduced temperatures, still remains remarkably similar to that at , in spite of very different transport properties and different spin states of cobalt ions in these phases.
In general, GdBaCo2O5+x seems to have just a few stable phases such as , , and , while intermediate compositions always tend to phase separate on a nanoscopic or mesoscopic scale.
Although the compositions with are hard to achieve in GdBaCo2O5+x, we can extrapolate the phase boundaries to higher doping, as shown in Fig. 28, using an analogy with the cubic La0.5Ba0.5CoO3-δ. Our measurements have shown that the latter compound is a ferromagnet with K (only weakly dependent on ) with no sign of reentrant AF behavior at low temperatures.
IV DISCUSSION
It is natural to start discussing the GdBaCo2O5+x compound beginning with the “parent” composition, whose properties constitute a basis for understanding the transport and magnetic behavior of this layered cobalt oxide over the entire doping range.
IV.1 Magnetic structure of GdBaCo2O5.50
By now, there were several attempts to elucidate the magnetically ordered states in isostructural RBaCo2O5+x (R = Y, Nd, Tb, Ho) compounds using neutron scattering (for GdBaCo2O5+x, such a study is precluded by a large absorption of neutrons by Gd).Vogt ; Suard ; Soda ; Fauth2 ; Neutron2 ; Neutron3 ; Neutron4 In the case of samples with the lowest oxygen concentration , whose preparation is quite straightforward, the neutron diffraction has indeed provided reproducible data on the charge and spin ordering, being in good agreement with the magnetization and transport measurements.Vogt ; Suard ; Soda In contrast, much more complicated and sample-dependent diffraction patterns were obtained for compositions near , bringing about controversial models of the magnetic order in this region of the phase diagram.Fauth2 ; Neutron2 ; Neutron3 ; Neutron4 This apparent controversy, however, is in fact not very surprising given the remarkable sensitivity of the magnetic and structural properties of RBaCo2O5+x to even a slight modification in the oxygen concentration, that was revealed in the present study; note also a strong tendency to phase separation, which should inevitably take place in all the samples except for those located in a few narrow composition regions (see Fig. 28). As we have shown here, the actual composition of so-called “as-grown” and “oxygen-annealed” samples usually used in most of the previous studies may deviate a lot from the required , and a rather delicate technique should be developed to tune the oxygen content precisely to this peculiar point.
To the best of our knowledge, none of the models, that have been suggested for the composition based on the neutron-scattering data, appears to be capable of explaining the entire experimentally-observed magnetic behavior. For example, a G-type AF order was proposed by Fauth et al.Fauth2 for temperatures where a rather large FM moment shows up in our magnetization measurements. On the other hand, the model suggested by Soda et al.,Neutron2 being quite close to that one reported recently by us,GBC_PRL indeed captures such gross features as the FM and AF states and a possibility of easy and abrupt switching between these two; nevertheless, it still implies a kind of spiral spin order for the AF state, which is clearly inconsistent with the Ising-like magnetic behavior observed in the magnetization of detwinned crystals.GBC_PRL
In view of the above mentioned problems with direct methods, we should try to reconstruct the magnetic structure of GdBaCo2O5.50 relying mostly on the magnetization data obtained on single crystals with precisely tuned stoichiometry. Fortunately, this task is simplified by the discovered strong uniaxial anisotropy of cobalt spins which dramatically narrows down the range of possible spin arrangements. Let us first summarize the robust facts established for GdBaCo2O5.50 as follows:
(i) The magnetic moments of Co3+ ions in GdBaCo2O5.50 exhibit an Ising-like behavior, being exceptionally strongly confined to the CoO2 () planes (with the anisotropy energy of the order of 10 meV per cobalt ion) and to a lesser extend, though still strongly, to the orthorhombic axis. Note also that the confinement of cobalt spins to the plane appears to be a generic feature of GdBaCo2O5+x regardless of the oxygen content and thus regardless of the valence and spin states of cobalt ions (Sec. III.4.1). One might wonder whether there can be another interpretation of the observed magnetic anisotropy: In magnetically ordered states, for example, the magnetization may indeed be larger for a direction transverse to the spin-easy axis, which is usually the case with antiferromagnets and canted antiferromagnets. However, a possibility of the spin-easy axis to be parallel to the axis is immediately ruled out by a considerable anisotropy that survives up to high temperatures in the paramagnetic state. In turn, by analyzing various canted AF configurations within the plane, regardless of whether they are allowed by symmetry or not, we find that non of them can account for the observed large FM moment, which would require a large canting angle of cobalt spins, and at the same time for a strong in-plane anisotropy, where the FM moment appears only along the axis (Fig. 21). For example, the spin structure suggested in Ref. Neutron2, with a canting angle of would inevitably result in a magnetic behavior to be essentially isotropic within the plane.
(ii) The spontaneous FM state below and the FM state induced by a magnetic field at represent the same phase with a net FM moment smoothly growing upon cooling, tending to Co at (Fig. 24). After the magnetic field stabilizes the FM order, no anomaly can be seen in the magnetization or resistivity at the zero-field FM-AF transition temperature.
(iii) The FM-AF switching in GdBaCo2O5.50 is a metamagnetic transition: It is induced by a relative reorientation of weakly coupled spin sublattices, while within each sublattice the spins are kept ordered by a much stronger interaction. This remarkable hierarchy of spin interactions follows from the fact that the AF-FM transition remains sharp even when it is induced by a very weak field (Fig. 22).
Based on the above listed observations (i)-(iii), one can quite easily sort out the spin structures that may be realized in GdBaCo2O5.50. The point (i) indicates that the cobalt spins in this compound should form a collinear structure aligned along the axis; this conclusion agrees with all the neutron-scattering studies,Vogt ; Suard ; Soda ; Fauth2 ; Neutron3 except for Ref. Neutron2, . However, if we consider a uniform FM order at , the observed net FM moment of Co [see (ii)] appears to be inconsistent with the allowed spin states of Co3+ ions (0, , and for LS, IS, and HS states, respectively). Although the magnetic moments of Co3+ ions could be modified from their spin-only values by the orbital moments, which at a first glance may resolve this contradiction, a homogeneous FM state is also clearly inconsistent with the FM-AF switching (iii). We thus inevitably arrive at a conclusion that the magnetic structure of GdBaCo2O5.50 should correspond to a ferrimagnet composed of two or more antiparallel FM sublattices; note that one of the sublattices may carry zero moment if it involves the LS cobalt ions. Apparently, the net FM moment of Co – a difference between the sublattice moments – may be accounted for if the Co3+ ions constituting the two ferrimagnetic sublattices are either in the LS and IS states, or in the IS and HS states. One can construct more complex spin structures by increasing the number of magnetic sublattices; for instance, a zero-moment sublattice may be composed of LS Co3+ ions, or antiferromagnetically ordered IS(HS) ions.
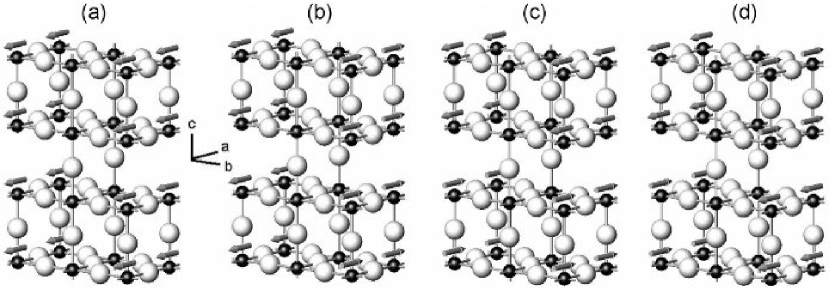
Now we can try to map the ferrimagnetic sublattices onto the actual crystal structure, keeping in mind the following important conditions. First, the ferrimagnetic sublattices should be strongly coupled with each other, since, according to Respaud et al., even a 35-T field fails to induce a ferrimagnetic-ferromagnetic transition.Respaud Another explanation for this robustness is that only one of the sublattices actually possesses a non-zero FM moment; in that case, no decoupling transition should be expected. The second point is that besides strong FM bonds, each 3D ferrimagnetic sublattice should also contain planes of very weak magnetic coupling to allow for an easy folding of the magnetic unit cell upon switching into the AF state. One can see in Fig. 1, that the crystallographic planes responsible for weak magnetic coupling can naturally be the GdOx plane and/or an plane passing between the pyramidal and octahedral cobalt ions. Apparently, such kind of effective decoupling of neighboring Co3+ ions can hardly be possible unless either of the two CoO2 planes – composed of cobalt ions in the pyramidal or octahedral environment – is essentially non-magnetic. Consequently, the other half of cobalt ions should provide an average moment of Co, which corresponds to the IS state or an 1:1 ratio of LS and HS states. Note that the existence of a non-magnetic sublattice also gives the best account for the high-field magnetization data of Respaud et al..Respaud
An important information on the magnetic states of Co3+ ions in GdBaCo2O5.50 has been also obtained from the Curie-Weiss fitting of the PM susceptibilityRespaud ; Martin ; GBC_PRL in the temperature range 300-360 K (Figs. 18 and 22), which better agrees with the presence of 50% of ions in the IS state, while the same fitting above K points to a 1:1 mixture of IS and HS states. Although our magnetization experiments can hardly distinguish which cobalt ions alter their spin state at the spin-state transition at and whether the IS state is realized in pyramidal or octahedral positions, a structural analysis of the oxygen coordination by Frontera et al. suggests that it is the cobalt ions in octahedral positions that participate in the spin-state (LS–HS) transition, while the cobalt ions in pyramidal sites keep their IS state regardless of temperature.Frontera
We have eventually reached the most likely picture of the magnetic ordering in GdBaCo2O5.50, which is illustrated in Fig. 29. The alternating filled and empty oxygen chains shown in Fig. 29(a) create two types of structural environment, octahedral and pyramidal, for Co3+ ions; the former favors the non-magnetic LS ground state, while the latter makes the IS state preferable. At high temperatures, the entropy keeps the cobalt ions in octahedral positions in the HS state, and the compound behaves as a paramagnet composed of IS and HS Co3+ ions (not to mention Gd3+ ions which are always paramagnetic). Upon cooling below K, the octahedral cobalt ions cooperatively switch into the LS state, and thus the CoO2 planes develop a spin-state order consisting of alternating rows of Co3+ ions in the LS and IS states. Consequently, the magnetic cobalt ions form 2-leg ladders extended along the axis and separated from each other by non-magnetic CoO2 layers along the axis and by paramagnetic GdO0.5 layers along the axis, as sketched in Fig. 29(a).
Empirically, the spin interaction in ladders formed below turns out to be ferromagnetic, and eventually the ladders establish a FM order below K with spins aligned strictly along the axis [Fig. 29(a)]. Owing to the reduced dimensionality (quasi-1D/2D) of the ladders, the FM order develops quite gradually upon cooling, being subject to strong thermal fluctuations. The strength of the FM interaction in ladders, , can be estimated from the Curie temperature: The molecular-field theory for 3D systems J_Tc would give K for K; however, for the quasi-1D/2D magnetic ordering, should be roughly twice as large for the same to be reached.Fisher It is worth noting that GdBaCo2O5.50 is an insulator and thus such mechanism of the FM ordering as the double exchange,Double which is common in metallic oxides,Imada is irrelevant here. In insulators, the magnetic ordering is known to be predominantly caused by the superexchange interaction, whose sign for each pair of ions can be estimated using Goodenough-Kanamori rules.Anderson ; Goodenough ; Kanamori ; Weihe To account for the FM spin order in ladders, we need to assume some kind of orbital ordering among the IS Co-ions.GBC_PRL We can even speculate that the superstructure reflections along the axis often observed in the neutron scattering are brought about by such orbital ordering.
Whether a macroscopic magnetic moment will emerge or not after the FM-ordered ladders are formed depends on their relative orientation, which can be either ferro- or antiferromagnetic due to the Ising-like nature of the spins. In a narrow temperature range below , the weak effective interaction between ladders turns out to be ferromagnetic and a net FM moment shows up; upon further cooling below , however, it gradually changes sign, resulting in the AF ground state. The ladder stacking may become antiferromagnetic along the axis [Fig. 29(b)], inducing doubling of the magnetic unit cell along that axis, or along the axis [Fig. 29(c)], or both [Fig. 29(d)].
Quite naturally, the inter-ladder coupling across non-magnetic layers is weak, and switching from the ground-state AF order to the field-induced FM one can be induced by a fairly weak magnetic field that depends on temperature. To understand the role of temperature, one should consider the thermally-excited states: upon heating, a certain amount of LS Co3+ ions in octahedral positions become Co2+, Co4+, or change their spin state. Whatever the case, each excited ion acquires a non-zero spin, providing an additional bridge between spin-ordered FM ladders. In this respect, it is worth noting that the AF ordering can be suppressed not only by magnetic fields or thermal excitations, but also by changing the oxygen stoichiometry: any deviation from also introduces Co2+ or Co4+ ions and shifts the AF-FM phase transition to lower temperature [see Fig. 18(b) and Fig. 28].
We can conclude that the GdBaCo2O5.50 compound with precisely tuned stoichiometry represents a very interesting magnetic system of weakly interacting FM ladders with Ising-like moments.
IV.2 Electronic structure of GdBaCo2O5.50
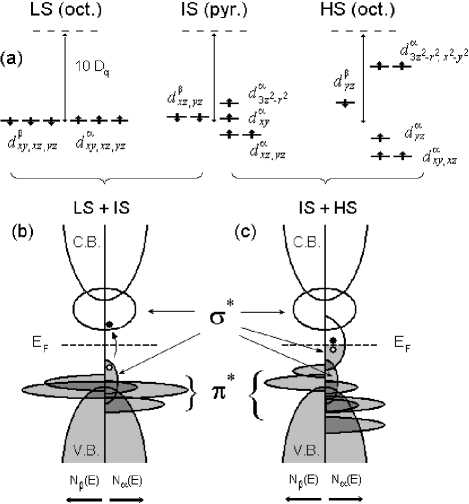
As follows from the magnetic and structural data of GdBaCo2O5.50 discussed above, the metal-insulator transition at K is accompanied with a change in the spin-state of Co3+ ions: Upon heating across , the Co3+ ions in octahedral positions switch their spin state from the LS to HS state, while those in pyramidal positions keep their IS state at all temperatures. Figure 30(a) shows the electronic energy levels of Co3+ ions for the relevant states, namely, the LS and HS states in octahedral environment, and the IS state in pyramidal environment. This level structure is evaluated in the framework of the ionic model that takes into account the crystal-field (CF) energy splitting () and on-site electrons interactions (the intra-atomic exchange energy and the Coulomb repulsion energies and , defined following KanamoriKanamori ; Pouchard ).
In the octahedral environment ( symmetry), the crystal field splits the 3d electron energy levels of a Co3+ ion into three orbitals (, , and with ) and two orbitals ( and with ). When such cobalt ion acquires the LS state, all its six valence electrons occupy the degenerate orbitals (three spin-up and three spin-down). Every electron therefore has the same energy, and the total electron energy per Co3+ ion, which takes into account the on-site interactions and the crystal field splitting, can be expressed as , where is a reference energy.
In order to bring the Co3+ ion into the IS state, one electron should go from a orbital to a higher-located one, for example, from to . This leads to an additional splitting of the one-electron energy levels that removes the initial degeneracy of orbitals: the intra-atomic exchange is modified, causing every spin-up electron to lower its energy by , while every spin-down electron increases the energy by . Besides, the Coulomb matrix element between the and orbitals is replaced with between the and orbitals. Consequently, the total electron energy for the IS state becomes . And finally, in the case of the Co3+ HS state in the octahedral environment, one more electron is transferred from the to shell (from to in Fig. 30(a)), causing a further splitting of the energy levels. The total electron energy for the HS state can be written as .
The energy levels of cobalt ions in the pyramidal environment ( symmetry) differ from the previous cases because the crystal field causes a different energy splitting: +9.14 (), +0.86 (), -0.86 () and -4.57 ( and ) for a square pyramid.Huheey Consequently, the total electron energy for the IS state, for instance, becomes .
In order to evaluate which spin states of Co3+ ions should be preferable, we need to compare their relative energies. Given that the difference between the intra- and inter-orbital Coulomb matrix elements is , only two parameters and appear to determine the one-electron energy levels of localized Co3+ states in the framework of the ionic model. Quite reasonable parameters for Co3+ ions are eV and eV.Huheey Following this approach, one can easily find out that the IS state in octahedrons is completely unstable with respect to either the LS or HS state, while either of the latter states may win, depending on the parameters. However, for the pyramidal positions, the IS state appears to be stable in a very broad range of / (from 0.57 to 2.74), as has been concluded by Pouchard et al..Pouchard
It is worth noting also that the result of this spin-state competition, that is, which one of the spin states closely located in energy will win, may well depend on temperature. For example, the non-magnetic LS state in octahedral positions experimentally appears to be the ground state, and therefore it dominates at low temperatures. However, the spin-orbital degeneracy of the HS state is much larger,Koshibae and thus with increasing temperature, the HS state should sooner or later take over the LS state because of the entropy terms associated with the spin-orbital degeneracy; this mechanism is likely staying behind the spin-state transition observed at K.
Another important issue is the energy-level position of occupied orbitals. As shown in Fig. 30(a), for IS Co3+ ions located in the pyramidal surrounding, the energy of occupied orbital is very close to the energy of , , and orbitals, mainly due to the strong splitting of and levels by the crystal field of the C4v symmetry. In contrast, for cobalt ions in the octahedral environment, the energy of and occupied orbitals appears to be much higher even in the HS state.
Quite naturally, the qualitative features of these simple ionic model may be expected to be reproduced in the band structure. In the framework of a more sophisticated ligand-field (LF) approach, the overlap of cobalt 3, 4, 4 and oxygen 2 orbitals leads to the formation of bonding, antibonding, and non-bonding molecular orbitals (MO), which are broadened in a solid into energy bands. The bonding molecular orbital, being predominantly composed of the and “atomic orbitals” (AO), creates a wide valence band (indicated in Figs. 30(b) and 30(c) as V.B.) similar to ordinary band insulators (semiconductors). In turn, the antibonding molecular orbital, being also predominantly composed of and AO of cobalt and oxygen ions, creates a wide conduction band (indicated as C.B.).
The interaction of cobalt orbitals with oxygen orbitals has a different character. In a CoO6 octahedron, the cobalt orbitals should be non-bonding, because there is no linear combination of oxygen orbitals of the same symmetry for them to interact. As a result, a rather narrow band occupied by almost localized electrons appears at the top of the valence band. On the other hand, the cobalt orbitals interact with a linear combination of oxygen orbitals of the symmetry, increasing the energy of the antibonding band. A center of the band is located by 10Dq higher than the center of the band (the same energy splitting as in the CF theory). Note that in the LS state, the band is empty.
The on-site electron interactions as well as distortions of the CoO6 octahedron, with the CoO5 pyramid being the ultimate case, shift the energy bands in the same way as in the case of discrete levels. For IS Co3+ ions in the pyramidal environment, the band occupied by electrons with the prevailing spin projection is separated from the conduction band and shifted down to the top of the valence band [as shown in Fig. 30(b)]. On the other hand, in the case of the HS state in octahedral environment, the occupied band is situated higher in energy and is twice as large [Fig. 30(c)].
Figure 30(b) presents a simplified electronic structure originating from a 1:1 mixture of the electronic states of CoO6 octahedrons and CoO5 pyramids with the Co3+ ions being in the LS and IS states, respectively. We expect this state to be realized in GdBaCo2O5.50 below the metal-insulator transition. The high-temperature electronic structure corresponding to HS Co3+ ions in octahedral environment and IS ions in pyramidal surrounding is depicted in Fig. 30(c). One can see that the most prominent difference between these two pictures is a band gap in the first case, while the occupied band overlaps with the conduction band in the latter one. Whether the energy gap emerges or not is determined mainly by the position of the bands as well as by their widths. The electronic structure of GdBaCo2O5.50 discussed here offers a natural, though much simplified, explanation of the metal-insulator transition that is observed to coincide with the spin-state one at K.
IV.3 Transport properties of GdBaCo2O5.50
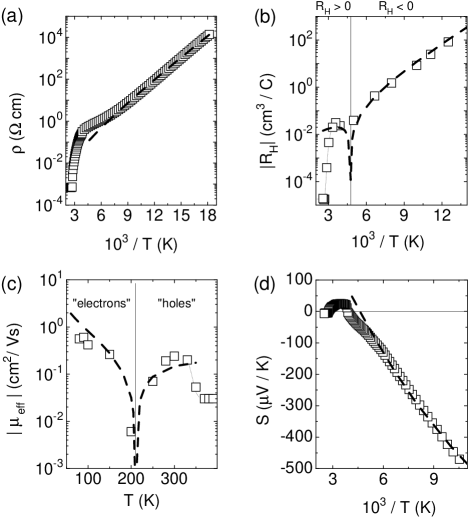
Having obtained a qualitative picture of the electronic structure for the parent compound GdBaCo2O5.50, we can now review its transport properties. The temperature dependences of the resistivity , Hall coefficient , and thermoelectric power of GdBaCo2O5.50 are summarized in Fig. 31 together with an “effective” mobility of carriers defined as . The latter would correspond to a true Hall mobility , if only one type of charge carriers were present in the system.
Apparently, all the transport properties presented in Fig. 31 behave quite coherently. At low temperatures, both and grow exponentially upon cooling with an activation energy meV. An activation character of the charge transport with the same energy gap can be also inferred from the thermoelectric power which is linear in . On the other hand, when the temperature increases above the metal-insulator transition at K, all these physical quantities, , , and , acquire small and almost temperature-independent values: cm, cm3/C, and V/K. This small Hall coefficient would correspond to an unrealistically high density of carriers of holes per Co ion, if one assumes only one type of carriers to participate in the charge transport; correspondingly, the apparent mobility becomes unrealistically small above [Fig. 31(c)]. One can naturally conclude, therefore, that the Hall signal is strongly reduced at high temperatures because both electrons and holes move almost equally and their contributions to , being very close in magnitude but opposite in sign, almost cancel each other. The metallic charge transport provided by both electrons and holes is presumably responsible for the small value of the Seebeck coefficient as well. Note that the sign of at high temperatures is opposite to that of the Hall resistivity, which can easily happen when different types of charge carriers are providing delicately balanced contributions: The holes’ contribution to is a bit larger than the electrons’ one, while in the balance appears to be opposite.
One more interesting feature in Figs. 31(b) and 31(d) is that both and change their sign from negative to positive at K, long before approaching the metal-insulator transition. This sign change indicates that the electrons and holes in GdBaCo2O5.50 keep providing comparable contributions to the conductivity down to quite low temperatures, and thus keep competing for the dominating role in the Hall response and thermoelectric power. On one hand, this is not surprising, given that the neutrality condition in a non-doped semiconductor requires the number of electrons to match the number of holes, . On the other hand, however, the switch in sign of and would imply that the relative mobilities of electrons and holes should quickly change, with their ratio being at low temperatures but at high temperatures.
One possibility is that such asymmetric mobility evolution actually takes place, though we cannot point to any obvious reason for that. Another possibility to be considered is that the mobility ratio is essentially temperature independent, but instead there are more than two types of carriers in the system. Namely, there may be two distinct types of holes (the total number of holes ) with very different mobilities and different activation energies. Whenever the temperature is modified, the relative shares of the two kinds of holes should change, and their average mobility should change accordingly, mimicking a gradual mobility evolution.
In order to understand where the different types of carries may be coming from, we can refer to the qualitative electronic structure of GdBaCo2O5.50 sketched in Fig. 30(b). The bands nearest to the Fermi level are the conduction band and a narrow band composed of occupied and cobalt -bands, with being located exactly in the center of the band gap at . Apparently, at the lowest temperatures, only excitations from the top of the -band to the bottom of the conduction band may take place, and thus the carriers in these bands should govern the transport properties. It is reasonable to expect the mobility of holes in the narrow -band composed of almost localized states () to be much lower than that of electrons in the conduction band (), though the latter is not very high either, since the conduction band also includes cobalt states (unoccupied). Under these conditions, the electrons thermally activated into the conduction band should make a predominant contribution to the low-temperature charge transport, providing a simple activation behavior for the resistivity and the Hall coefficient, and . The thermoelectric power for electrons in the conduction band, , should follow a conventional law:
| (2) |
where the energy corresponds to the conduction-band bottom, and is determined by the scattering mechanism (through the energy dependence of the relaxation time ). Note that a similar expression is valid for the thermoelectric power of holes, , as well, but their low mobility does not allow them to compete with electrons at low temperatures, because the total thermoelectric power for the two-carrier system is calculated, in the simplest model, as
| (3) |
where conductivity of electrons, (as well as holes, ) is directly proportional to their mobility.
Upon increasing temperature, a wider energy range of electronic states becomes available for thermal excitation, and at some point, a number of electrons excited from the valence band to the conduction band should become considerable. While the behavior of electrons in the conduction band is the same regardless of where they are activated from, the holes generated in the valence band clearly differ from those in the band, because the valence band is much wider than the band and the mobility is expected to be larger in the wider band. As soon as the valence-band holes join the transport, the share of holes in the conductivity, Hall coefficient, and thermoelectric power quickly increases, and at some temperature, it exceeds the contribution of electrons owing to the high mobility ; as a result, and change their sign from negative to positive.
To illustrate the latter picture, in Fig. 31 we show results of a simulation (dashed lines) for , , , and obtained for the three-band model, where the mobility ratios were taken as . One can see that even such very simplified model provides a reasonable description for all the measured transport properties on the insulator side of the metal-insulator transition. We can conclude, therefore, that the electronic structure of GdBaCo2O5.50 proposed in Sec. IV.2 gives a consistent explanation not only for the metal-insulator transition, originating from the spin-state transition, but also can account for the behavior of resistivity, Hall coefficient and thermoelectric power as well.
IV.4 The origin of giant magnetoresistance
At this point, it is interesting to consider the mechanism responsible for the giant magnetoresistance observed in GdBaCo2O5+x and other isostructural compounds. Although the MR behavior in GdBaCo2O5+x bears some resemblance to that in manganites (in particular, the MR in both systems is related to the AF-FM transition), there are several dissimilar features pointing to different MR mechanisms. Most important is that GdBaCo2O5+x, in contrast to manganites, remains to be an insulator even in the FM state, indicating that neither the double-exchange mechanismImada ; CMR_rev ; Double nor percolation through some metallic phase is relevant here;CMR_rev the MR does not seem to originate from the “spin-valve” effects, i.e., from a tunneling between two spin-polarized metallic regions, either. Our analysis of the resistivity in the AF and FM states (Fig. 25) has shown that the activation energy for carriers diminishes considerably upon the AF-FM transition, and it is mainly a change in the density of carriers, rather than in their mobility, that affects the resistivity.
By examining the crystal and magnetic structure of GdBaCo2O5.50 (Fig. 29), one can easily find out that the charge transport, at least along the axis, should be governed by nominally non-magnetic CoO2 layers, which go along the plane and are composed of cobalt ions with octahedral oxygen environment. It appears, therefore, that the charge-carrier doping of these octahedral CoO2 planes is to a large extent determined by the relative orientation of the magnetic moments in neighboring FM ladders. To distinguish this intriguing MR scheme from other MR mechanisms, in a recent paperGBC_PRL we have coined a term “magnetic field-effect transistor”, based on a hypothetic structure where the charge-carrier injection into a 2D semiconducting channel is controlled not by an electric field, but by a magnetic state of neighboring “ligands”.
One might wonder how the reorientation of very weakly coupled FM ladders may affect the charge transport, bringing about a giant MR, particularly in the nominally non-magnetic CoO2 layers. Qualitatively, the MR mechanism appears to be quite simple: GdBaCo2O5.50 is a narrow-gap insulator, where the carrier generation goes through formation of electron-hole pairs, i.e., through formation of inevitably magnetic Co2+ and Co4+ states, whose energy must depend on the surrounding magnetic order.GBC_PRL In other words, the energy gap that opens at the Fermi level due to the crystal-field splitting and on-site interactions must be further modified by the spin-dependent exchange interactions with neighboring Co ions. As we already know, the carriers generated by thermal excitations or doping always favor the FM coupling between ladders (Fig. 28); thus, the FM arrangement of ladders should, in turn, also make the carrier generation easier. One can conceive this interrelation in a way that the energy for generating carriers in the AF state also includes a penalty that should be paid upon frustrating the relative order of the antiferromagnetically-coupled ladders. When a magnetic field aligns the FM ladders, this penalty is removed, which lowers the barrier for carrier generation. One can expect the reduction of the insulating gap upon the field-induced AF-FM transition to be of the same order as the inter-atomic exchange energy meV, which is indeed observed experimentally (Fig. 25).
Lastly, an interesting point to be emphasized in the MR behavior is a strong amplification effect, whereby an apparently small energy of the magnetic field K becomes capable of changing the carriers’ activation energy by several hundreds K. This gives one more evidence for the cooperative nature of the observed MR.
IV.5 Evolution of physical properties of GdBaCo2O5+x with oxygen content
The main motif governing the behavior of the GdBaCo2O5+x compound is obviously a competition of various kinds of ordering, involving charge, spin, orbital and structural degrees of freedom. While for several particular compositions (, etc.), this ordering competition is won by certain homogeneous states, the majority of the phase diagram appears to be occupied by mixtures of various ordered phases (Fig. 28).
In the end-point compound, which corresponds to the 50% electron doping, the Co2+ and Co3+ ions order into alternating lines running along the axis, where each cobalt spin is aligned antiferromagnetically to six nearest neighbors to form a G-type AF structure.Vogt ; Suard This means that in GdBaCo2O5.00 all the nearest-neighbor superexchange interactions, be they between the Co2+ ions or Co3+ ions, are antiferromagnetic. Under such conditions, one would expect the charge doping, which converts some Co2+ ions into Co3+ ones, to cause no considerable effect on the magnetic behavior; this should certainly be the case if just the size of AF-ordered spins is modified. In reality, however, the oxygen doping immediately brings in some sort of ferromagnetism. Since GdBaCo2O5+x retains its insulating behavior all the way up to , one has to invoke a qualitative change in the orbital order to account for the emerging FM behavior. Apparently, the orbital order that underlies the AF spin ordering in GdBaCo2O5.00 is stable only for the particular unidirectional charge order which is realized at the 50% electron doping. When the holes are introduced upon oxygen doping, they immediately frustrate the pattern of the charge and orbital order in CoO2 planes. In fact, this doping-induced frustration offers a clue to the origin of nanoscopic phase separation, whose spectacular manifestations appear in the magnetic behavior: To avoid frustration, the charge-ordered AF matrix expel the doped holes, which are then segregated in small droplets of a new FM phase, as sketched in Fig. 32; the evidence for this phase segregation is found in the magnetization data, as we discussed in Section III D.
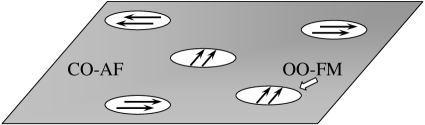
An electronic phase separation, arising from the tendency of an ordered state to avoid frustration, is quite common for strongly correlated systems. Usually, the frustration is induced by the charge carrier motion over an AF insulating background; the system, therefore, tends to segregate the mobile carriers into metallic regions with a modified magnetic order.CMR_rev ; Kivelson What is peculiar in GdBaCo2O5.00 is that the AF and FM phases here are both insulating; in this case, they differ only in the charge and orbital order. Presumably, these phases correspond to the charge-ordered insulator (50% electron doping) and the undoped band insulator (zero doping).
An interesting issue is whether the oxygen ions participate in the phase separation or it is mostly an electronic phenomenon. Based on the very small size of the FM-phase droplets – they are not detected by the X-ray scattering (Sec. III.1), and exhibit just a superparamagnetic behavior at moderate oxygen doping – we can conclude that the oxygen ions are not involved in the large-scale redistribution. Though the negatively-charged oxygen ions may rearrange locally, being dragged by the Coulomb interaction with the doped carriers, this motion is apparently insufficient to cause the domains to grow. Consequently, the observed nanoscopic phase separation at is most likely governed by the electronic interactions in the CoO2 planes and thus may be a generic feature of layered cobalt oxides.
The phase-separated state depicted in Fig. 32 gives a consistent explanation for the magnetic and transport properties of GdBaCo2O5+x in the electron-doped region (). As long as the FM droplets are small and located far apart, they exhibit a superparamagnetic behavior with thermomagnetic irreversibility features originating from the strong spin-orbit coupling. With increasing oxygen content, the FM droplets grow until they achieve a percolation within the CoO2 planes at ; from that point, the initial AF phase is kept in inclusions embedded in the FM matrix. Eventually, the system becomes homogeneous again as the composition approaches that of the undoped parent insulator, . Given that both the FM and AF phases are insulators, it is not surprising that the conductivity of crystals is virtually independent on doping in the entire electron-doped region, and that it goes through variable-range hoping of localized carriers.
While in the electron-doped region, GdBaCo2O5+x tends to phase separate into two insulating components, namely, the undoped and 50%-electron doped phases, the hole doping () also quickly destabilizes the homogeneous parent state. However, the phase separation in the hole-doped region bears several important differences from the behavior of electron-doped crystals. First, the scale of resulting domains is much larger, implying that the oxygen ions are involved in the macroscopic (or mesoscopic) rearrangement process and redistribute over the crystal together with the doped carriers; otherwise, the long-range Coulomb interactions would prevent the formation of such a macroscopically inhomogeneous state. Second, the nearest stable phase is located at a considerably lower doping level of % of holes (). And finally, the most important is that the stable hole-doped phase appears to be metallic, in contrast to insulating electron-doped compositions. The latter explains the remarkable asymmetry in the doping dependence of the conductivity in Fig. 7.
Now, we can only speculate on the nature of the metallic hole-doped phase, since a detailed information on the crystal structure of GdBaCo2O5+x at is still lacking. Apparently, that phase should be well structurally ordered, since one can hardly imagine so sharp a FM-AF transition, as shown in Fig. 18(c), to takes place in a system with a significant disorder. Therefore, some sort of oxygen ordering is expected to occur in GdOx layers, similar to the formation of perfect oxygen chains in the parent compound with ; one can immediately find out that the composition best fits the “Ortho-III” superstructure where two filled oxygen chains in GdOx layers alternate with one empty chain.
If the Ortho-III structure is actually realized in GdBaCo2O5+x with , and the FM-AF transition has the same purely magnetic origin as in the parent compound with , one inevitably arrives at the conclusion that some kind of weakly coupled FM ladders or layers are formed in the phase as well. One can further speculate that the double octahedral CoO2 layers are still non-magnetic in this Ortho-III phase, and the FM ladders are just located farther apart. The main difference with the parent composition is that for , about 20% of cobalt ions should acquire the Co4+ state. If all the holes are gathered in the FM layers, where they can readily move, those layers would possess a quarter-filled metallic band. Note that on the macroscopic scale, the conductivity would exhibit a true metallic behavior only if the crystal has a perfectly ordered oxygen subsystem; otherwise, the metallic ladders/layers would be always interrupted by non-conducting regions. In the latter case, a variable-range hopping between metallic fragments should be expected.Fogler The measured resistivity of crystals indeed exhibits an unusual behavior, tending to saturate at low temperatures at finite but surprisingly large values (Fig. 6).
While the suggested very speculative picture of the metallic phase can easily account for the observed magnetic and transport properties, more work is obviously necessary to clarify whether it has anything to do with the actual microscopic state. In any case, this intriguing phase with self-organized metallic paths bears a clear resemblance to the stripe structures in high- cuprates,Kivelson and the phase-separated conducting phases in manganites,CMR_rev and thus its study may help in understanding the unusual transport in other oxides as well.
V SUMMARY
In order to gain insight into the general behavior of square-lattice layered cobalt oxides, we have performed a systematic study of the transport, magnetic, and thermoelectric properties of GdBaCo2O5+x single crystals over a wide range of oxygen content, . The high-quality crystals were grown by the floating-zone method and their oxygen content was precisely tuned to required values by successive annealing treatments so that the entire phase diagram could be spanned; particularly, in the critical regions of the diagram, the composition was modified with steps as small as .
The “parent” compound GdBaCo2O5.50 – the composition with all cobalt ions in the Co3+ state – is shown to be a metal at high temperatures, but it switches into a band insulator (a narrow-gap semiconductor) below the metal-insulator transition at K, which is manifested in step-like anomalies in all the measured properties, , , , and . The gap opening at the Fermi level is associated with a cooperative spin-state transition, which seems to involve a half of the cobalt ions, while the other half keeps its spin state unchanged. Two non-equivalent cobalt positions are created by the oxygen ions which order in GdO0.5 layers into alternating filled and empty rows running along the axis. Consequently, the CoO2 planes also develop a spin-state order consisting of alternating rows of Co3+ ions in the and states. The overall magnetic structure of GdBaCo2O5.50 below may be conceived of as a set of magnetic “2-leg ladders”, which are composed of Co3+ ions and are separated from each other by non-magnetic layers. Upon cooling below K, these ladders develop a ferromagnetic order; however, whether a macroscopic magnetic moment will emerge or not after the FM ladders are formed depends on inter-ladder coupling. According to the magnetization measurements performed on detwinned single crystals, the cobalt spins exhibit a remarkably strong Ising-like anisotropy, being aligned along the oxygen-chain direction; thus the FM ladders in GdBaCo2O5.50 can only form a relative ferromagnetic or antiferromagnetic arrangement. Owing to the very weak strength of this coupling between ladder, their relative magnetic order can be easily altered by temperature, doping, or magnetic fields, bringing about FMAF transitions and a giant magnetoresistance.
A study of GdBaCo2O5+x crystals with the oxygen content deviating from has revealed that this layered compound is a unique filling-control system that allows a continuous ambipolar doping of the CoO2 planes, that is, the doping level can be continuously driven across the parent insulating state. This continuous doping is manifested in spectacular singularities of the transport properties as the system approaches the undoped state: the thermoelectric power, for instance, tends to diverge at , and abruptly changes its sign upon crossing this peculiar point.
As soon as the CoO2 planes are doped with more than a few percent of charge carriers, be they electrons or holes, their homogeneous state is found to become unstable, and the system exhibits a very strong tendency to separation into several peculiar ordered phases. The resulting nano- or mesoscopic phase mixture is clearly manifested in the transport and magnetic properties of the crystals. For the entire electron-doped region (), GdBaCo2O5+x tends to phase separate into two insulating components, the undoped phase and the charge-ordered AF insulator with 50% electron doping. As a result, the conduction in GdBaCo2O5+x crystals is almost doping independent in the entire range , and goes through a variable range hopping of electrons. In the hole-doped region, the CoO2 planes also expel the doped carriers, protecting the undoped domains, but the second phase generated upon the phase separation turns out to be metallic, in contrast to the electron-doped crystals. Consequently, the GdBaCo2O5+x crystals gradually evolve towards a metallic state with hole doping, and thus the doping dependence of the conductivity exhibits a remarkable asymmetry with respect to whether the CoO2 planes are doped with electrons or holes.
Although a conclusive picture of the metallic hole-doped phase has not been established yet, such metallic state self-organized within the electronically inhomogeneous system bears a clear resemblance to the behavior of CMR manganites and high- cuprates, and thus its study may offer a clue to understanding the unusual charge transport in transition-metal oxides.
To conclude, the GdBaCo2O5+x compound has proved to be an interesting system with a very rich phase diagram originating from the competition of various spin-charge-orbital ordered phases. What turns it into a model system and makes it particularly interesting for a detailed study is the possibility of continuous ambipolar doping of CoO2 planes and the exceptionally strong cobalt-spin anisotropy, which dramatically narrows down the range of possible spin arrangements.
Acknowledgements.
We thank S. Komiya and K. Segawa for invaluable technical assistance.References
- (1) For review, see M. Imada, A. Fujimori, and Y.Tokura, Rev. Mod. Phys. 70, 1039 (1998).
- (2) For review, see E. Dagotto, T. Hotta, and A. Moreo, Phys. Rep. 344, 1 (2001); E. L. Nagaev, Phys. Usp. 39, 781 (1996).
- (3) For review, see E. W. Carlson, V. J. Emery, S. A. Kivelson, and D. Orgad, cond-mat/0206217.
- (4) Y. Maeno, H. Hashimoto, K. Yoshida, S. Nishizaki, T. Fujita, J. G. Bednorz, and F. Lichtenberg, Nature 372, 532 (1994).
- (5) K. Takada, H. Sakurai, E. Takayama-Muromachi, F. Izumi, R. A. Dilanian, and T. Sasaki, Nature 422, 53 (2003).
- (6) J. M. Tranquada, D. J. Buttrey, V. Sachan, and J. E. Lorenzo, Phys. Rev. Lett. 73, 1003 (1994).
- (7) I. A. Zaliznyak, J. P. Hill, J. M. Tranquada, R. Erwin, and Y. Moritomo, Phys. Rev. Lett. 85, 4353 (2000); I. A. Zaliznyak, J. M. Tranquada, R. Erwin, and Y. Moritomo, Phys. Rev. B 64, 195117 (2001).
- (8) T. Vogt, P. M. Woodward, P. Karen, B. A. Hunter, P. Henning, and A. R. Moodenbaugh, Phys. Rev. Lett. 84, 2969 (2000).
- (9) E. Suard, F. Fauth, V. Caignaert, and I. Mirebeau, G. Baldinozzi, Phys. Rev. B 61, R11871 (2000).
- (10) M. A. Señarís-Rodríguez and J. B. Goodenough, J. Solid State Chem. 118, 323 (1995); S. Yamaguchi, Y. Okimoto, H. Taniguchi, and Y. Tokura, Phys. Rev. B 53, R2926 (1996); J. Wu and C. Leighton, Phys. Rev. B 67, 174408 (2003); and references therein.
- (11) K. J. Thomas, Y. S. Lee, F. C. Chou, B. Khaykovich, P. A. Lee, M. A. Kastner, R. J. Cava, and J. W. Lynn, Phys. Rev. B 66, 054415 (2002).
- (12) C. Martin, A. Maignan, D. Pelloquin, N. Nguyen, and B. Raveau, Appl. Phys. Lett. 71, 1421 (1997).
- (13) I. O. Troyanchuk, N. V. Kasper, D. D. Khalyavin, H. Szymczak, R. Szymczak, and M. Baran, Phys. Rev. Lett. 80, 3380 (1998).
- (14) I. O. Troyanchuk, N. V. Kasper, D. D. Khalyavin, H. Szymczak, R. Szymczak, and M. Baran, Phys. Rev. B 58, 2418 (1998).
- (15) A. Maignan, C. Martin, D. Pelloquin, N. Nguyen, and B. Raveau, J. Solid State Chem. 142, 247 (1999).
- (16) M. Respaud, C. Frontera, J. L. García-Muñoz, M. A. G. Aranda, B. Raquet, J. M. Broto, H. Rakoto, M. Goiran, A. Llobet, and J. Rodríguez-Carvajal, Phys. Rev. B 64, 214401 (2001).
- (17) A. A. Taskin, A. N. Lavrov, and Y. Ando, Phys. Rev. Lett. 90, 227201 (2003).
- (18) I. Terasaki, Y. Sasago and K. Uchinokura, Phys. Rev. B 56, R12685 (1997).
- (19) Oxide thermoelectrics, edited by K. Koumoto, I. Terasaki, and N. Murayama (Research Signpost, Kerala, 2002).
- (20) W. Koshibae, K. Tsutsui, and S. Maekawa, Phys. Rev. B 62, 6869 (2000); W. Koshibae and S. Maekawa, Phys. Rev. Lett. 87, 236603 (2001).
- (21) Y. Ando, N. Miyamoto, K. Segawa, T. Kawata and I. Terasaki, Phys. Rev. B 60, 10 580 (1999).
- (22) T. Saito, T. Arima, Y. Okimoto, and Y. Tokura, J. Phys. Soc. Jpn. 69, 3525 (2000).
- (23) Y. Moritomo, T. Akimoto, M. Takeo, A. Machida , E. Nishibori, M. Takata, M. Sakata, K. Ohoyama, and A. Nakamura, Phys. Rev. B 61, R13325 (2000).
- (24) Y. Moritomo, M. Takeo, X. J. Liu, T. Akimoto, and A. Nakamura, Phys. Rev. B 58, R13334 (1998).
- (25) T. Matsuura, J. Tabuchi, J. Mizusaki, S. Yamauchi, and K. Fueki, J. Phys. Chem. Solids 49, 1403 (1988); Y. Moritomo, K. Higashi, K. Matsuda, and A. Nakamura, Phys. Rev. B 55, R14725 (1997).
- (26) I. Tsukada, T. Yamamoto, M. Takagi, T. Tsubone, S. Konno, and K. Uchinokura, J. Phys. Soc. Jpn. 70, 834 (2001); T. Valla, P. D. Johnson, Z. Yusof, B. Wells, Q. Li, S. M. Loureiro, R. J. Cava, M. Mikami, Y. Mori, M. Yoshimura, and T. Sasaki, Nature 417 627 (2002 ).
- (27) S. Hébert, S. Lambert, D. Pelloquin, and A. Maignan, Phys. Rev. B 64, 172101 (2001); T. Yamamoto, K. Uchinokura, and I. Tsukada, Phys. Rev. B 65, 184434 (2002).
- (28) D. Akahoshi and Y. Ueda, J. Solid State Chem. 156, 355 (2001).
- (29) H. Kusuya, A. Machida, Y. Moritomo, K. Kato, E. Nishibori, M. Takata, M. Sakata, and A. Nakamura, J. Phys. Soc. Jpn. 70, 3577 (2001)
- (30) C. Frontera, J. L. García-Muñoz, A. Llobet, and M. A. G. Aranda, Phys. Rev. B 65, 180405(R) (2002).
- (31) A. N. Lavrov, A. A. Taskin, and Y. Ando (unpublished). Our study has shown that it is virtually impossible to grow RBaCo2O5+x crystals with R = Y, La, or Lu. For R = La, in contrast to what was claimed in Ref. Moritomo2, , the compound crystallizes into a cubic La0.5Ba0.5CoO3-δ structure instead of forming the ordered LaBaCo2O5+x phase when sintered in air or O2. Reducing oxygen partial pressure would favor the ordered 112 phase, but at some point the compound decomposes into the perovskite phase La2-yBayCoO4 and an eutectic with approximate composition of BaCo2Oz. According to our data, the stability range of LaBaCo2O5+x in the P - T diagram should be very small, if any. For R = Y, one can easily prepare single-phase YBaCo2O5+x ceramic, but upon heating it melts incongruently, decomposing into pure Y2O3 and the BaCo2Oz eutectic. Again, the stability range of YBaCo2O5+x appears to be too narrow for the crystal growth, since its decomposition temperature almost coincides with the melting point of the BaCo2Oz eutectic. And finally for R = Lu, the 112 phase does not seem to be formed.
- (32) I. Yasuda and M. Hishinuma, J. Solid State Chem. 123, 382 (1996).
- (33) J.A. Lane and J.A. Kilner, Solid State Ionics 136-137, 997 (2000).
- (34) A. A. Taskin, A. N. Lavrov, and Y. Ando, cond-mat/0501127.
- (35) S. J. Rothman, J. L. Routbort, U. Welp, and J. E. Baker, Phys. Rev. B 44, 2326 (1991).
- (36) Y. Ando, K. Segawa, S. Komiya, and A. N. Lavrov, Phys. Rev. Lett. 88, 137005 (2002); A. N. Lavrov, S. Komiya, and Y. Ando, Nature 418, 385 (2002).
- (37) Y. Ando and K. Segawa, Phys. Rev. Lett. 88, 167005 (2002).
- (38) The highest oxygen concentration was achieved only for ceramic samples, since it required annealing at low temperatures where oxygen diffusion was already inhibited. It has turned out, however, that the resistivity of ceramics with was still of insulating type at K, being quite similar to that of a single crystal with (Fig. 6).
- (39) N. F. Mott and E. A. Davis, Electronic Processes in Non-Crystalline Materials, 2nd ed. (Clarendon Press, Oxford, 1979).
- (40) B. I. Shklovskii, and A. L. Efros, Electronic Properties of Doped Semiconductors (Springer-Verlag, Berlin, 1984)
- (41) Y. Ando, A. N. Lavrov, S. Komiya, K. Segawa, and X. F. Sun , Phys. Rev. Lett. 87, 017001 (2001).
- (42) Y. Ando, G. S. Boebinger, A. Passner, N. L. Wang, C. Geibel, and F. Steglich, Phys. Rev. Lett. 77, 2065 (1996); A. N. Lavrov, M. Yu. Kameneva, and L. P. Kozeeva, Phys. Rev. Lett. 81, 5636 (1998).
- (43) T. Kimura, Y. Tomioka, H. Kuwahara, A. Asamitsu, M. Tamura, Y. Tokura, Science 274, 1698 (1996).
- (44) T. Okuda, K. Nakanishi, S. Miyasaka, and Y. Tokura, Phys. Rev. B 63, 113104 (2001).
- (45) A. A. Taskin, A. N. Lavrov, and Y. Ando, in Proceedings of 22-nd International Conference on Thermoelectrics, Hérault, France, 2003, p.196.
- (46) In the close vicinity of , even a very subtle modification of the oxygen concentration (by merely or less) results in a significant change of the thermoelectric power . However, the accuracy of measuring the oxygen content in fairly small single crystals is lower than required for such precise positioning of the crystals on the scale. We had therefore to measure in both single-crystal samples and samples cut from large ceramic blocks, where the oxygen content could be determined with the required precision. Fortunately, the thermoelectric power, in contrast to resistivity, does not depend on the sample’s geometry; also, we found no noticeable anisotropy in the thermoelectric power of RBaCo2O5+x. We observed no considerable difference in the thermoelectric behavior of our single crystals and ceramics, and thus used the data for both kinds of samples to establish the detailed doping dependence .
- (47) M. H. Kane, N. Mansourian-Hadavi, T. O. Mason, W. Sinkler, L. D. Marks, K. D. Otzschi, D. Ko, and K. R. Poeppelmeier, J. Solid State Chem. 148 3 (1999).
- (48) G. J. Snyder, T. Caillat, and J.-P. Fleurial, Phys. Rev. B 62, 10185 (2000).
- (49) M.-Y. Su, C. E. Elsbernd, and T. O. Mason, J. Am. Ceram. Soc. 73, 415 (1990).
- (50) K. Binder and A. P. Young, Rev. Mod. Phys. 58, 801 (1986).
- (51) M. Soda, Y. Yasui, M. Ito, S. Iikubo, M. Sato, and K. Kakurai, J. Phys. Soc. Jpn. 73, 464 (2004).
- (52) T. Thio, T. R. Thurston, N. W. Preyer, P. J. Picone, M. A. Kastner, H. P. Jenssen, D. R. Gabbe, C. Y. Chen, R. J. Birgeneau, A. Aharony, Phys. Rev. B 38, R905 (1988); A. N. Lavrov, Y. Ando, S. Komiya, and I. Tsukada, Phys. Rev. Lett. 87, 017007 (2001); S. Ono, S. Komiya, A. N. Lavrov, Y. Ando, F. F. Balakirev, J. B. Betts, and G. S. Boebinger, Phys. Rev. B 70, 184527 (2004).
- (53) It should be emphasized that the observed two-phase state can by no means originate from macroscopic composition gradients in the annealed crystals; it must be an intrinsic instability of the homogeneous state in GdBaCo2O5+x for some range of doping that brings about the mesoscopic phase separation. Our experiments clearly support this conclusion. Namely, one and the same crystal annealed successively to provide the oxygen concentrations of , , and then , exhibited a single-phase behavior for the initial and final states, but behaved as a two-phase mixture for the intermediate composition of . Such non-monotonic evolution cannot be account for by a composition gradient that would appear in the crystal because of the slow oxygen diffusion; for the described experiment, the composition gradient would develop irreversibly, given that the annealing temperature was monotonically decreased in order to get higher values, and that the oxygen diffusion dramatically slows down upon cooling.
- (54) F. Fauth, E. Suard, and V. Caignaert, Phys. Rev. B 65, 060401(R) (2001).
- (55) C. Zener, Phys. Rev. 82, 403 (1951); P.-G. de Gennes, ibid. 118, 141 (1960).
- (56) P. Gambardella, S. Rusponi, M. Veronese, S. S. Dhesi, C. Grazioli, A. Dallmeyer, I. Cabria, R. Zeller, P. H. Dederichs, K. Kern, C. Carbone, and H. Brune, Science 300, 1130 (2003).
- (57) D. Weller and A. Moser, IEEE Trans. Mag. 35, 4423 (1999).
- (58) F. Fauth, E. Suard, V. Caignaert, and I. Mirebeau, Phys. Rev. B 66, 184421 (2002).
- (59) M. Soda, Y. Yasui, T. Fujita, T. Miyashita, M. Sato, and K. Kakurai, J. Phys. Soc. Jpn. 72, 1729 (2003).
- (60) V. P. Plakhty, Yu. P. Chernenkov, S. N. Barilo, A. Podlesnyak, E. Pomjakushina, D. D. Khalyavin, D. Sheptyakov, E. V. Moskvin, S. V. Gavrilov, and A. Furrer, cond-mat/0407010.
- (61) J. C. Burley, J. F. Mitchell, S. Short, D. Miller, and Y. Tang, J. Solid State Chem. 170, 339 (2003).
- (62) , where for IS-Co3+ ion and , counting only nearest neighbors.
- (63) M. E. Fisher, Rep. Progr. Phys. 30, 615 (1967).
- (64) P. W. Anderson, Phys. Rev. 115, 2 ( 1959).
- (65) J. B. Goodenough, Phys. Rev. 100, 564 (1955).
- (66) J. Kanamori, J. Phys. Chem. Solids 10, 87 (1959).
- (67) H. Weihe and H. U. Güdel, Inorg. Chem. 36, 3632 (1997).
- (68) M. Pouchard, A. Villesuzanne, and J.-P. Doumerc, J. Solid State Chem. 162, 282 (2001).
- (69) J. E. Huheey, E. A. Keiter, and R. L. Keiter, Inorganic Chemistry: Principles of structure and reactivity, 4th edn. (Harper Collins, New York, 1993).
- (70) M. M. Fogler, S. Teber, and B. I. Shklovskii, Phys. Rev. B 69, 035413 (2004).