Two dimensionality in quasi one-dimensional cobalt oxides
Abstract
By means of muon spin rotation and relaxation (SR) techniques, we have investigated the magnetism of quasi one-dimensional (1D) cobalt oxides Con+1O3n+3 (=Ca, Sr and Ba, =1, 2, 3, 5 and ), in which the 1D CoO3 chain is surrounded by six equally spaced chains forming a triangular lattice in the -plane, using polycrystalline samples, from room temperature down to 1.8 K. For the compounds with =1 - 5, transverse field SR experiments showed the existence of a magnetic transition below 100 K. The onset temperature of the transition () was found to decrease with ; from 100 K for =1 to 60 K for =5. A damped muon spin oscillation was observed only in the sample with =1 (Ca3Co2O6), whereas only a fast relaxation obtained even at 1.8 K in the other three samples. In combination with the results of susceptibility measurements, this indicates that a two-dimensional short-range antiferromagnetic (AF) order appears below for all compounds with =1 - 5; but quasi-static long-range AF order formed only in Ca3Co2O6 , below 25 K. For BaCoO3 (=), as decreased from 300 K, 1D ferromagnetic (F) order appeared below 53 K, and a sharp 2D AF transition occurred at 15 K.
pacs:
76.75.+i, 75.40.Cx, 75.50.EeI Introduction
In the two-dimensional (2D) layered cobalt oxides, NaxCoO2, [Ca2CoO3]0.62[CoO2] and [Ca2Co4/3Cu2/3O4]0.62[CoO2], a long-range magnetic order — which is clearly incommensurate spin density wave in single crystalline samples — was previously found at low temperatures by positive muon spin rotation and relaxation (SR) experiments.jun_PRB1 ; jun_PRB3 ; jun_PRB4 ; jun_PRL1 ; jun_PRB5 Several researchers reconfirmed later the existence of long-range magnetic order in the layered cobaltites by not only SR NCO_muSR but also neutron diffraction experiments.NCO_neutron These cobaltites share a common structural component as a conduction path, i.e., the CoO2 planes, in which a two-dimensional-triangular lattice of Co ions is formed by a network of edge-sharing CoO6 octahedra.
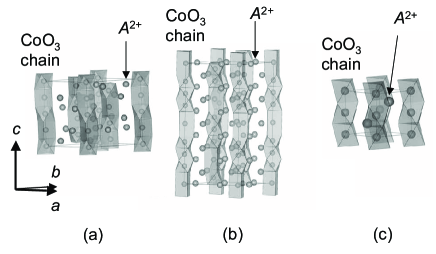
This leads naturally to the question of the (cause and effect) interrelationship between magnetism and dimensionality. That is, the most stable spin configuration as a function of a spin density in low dimensional systems. Recently, a homologous series of O3n+3 (= Ca, Sr, Ba, and =Co) was discovered, in which charge carrier transport is restricted mainly to a one-dimensional (1D) [B’BnO3n+3] chain.Q1D_1 ; Q1D_2 Each chain is surrounded by six equally spaced chains forming a triangular lattice in the -plane. As seen in Fig. 1, the [O6] chain in the =1 compound consists of alternating face-sharing O6 trigonal prisms and O6 octahedra. As increases, only the number of [O6] octahedra increases so as to build the chain with [O6] octahedra and one O6 trigonal prism.
The =1 compound, Ca3Co2O6, in particular, has attracted much attention for the past eight years, Co326XRDND_1 ; Co326ND_1 ; Co326chi_1 ; Co326chi_2 ; Co326rho_1 ; Co326pressure_1 ; Co326Mn_1 because it is considered to be a typical quasi-1D system. It was found that Ca3Co2O6 exhibits a transition from a paramagnetic to an antiferromagnetic state below 24 K (=),Co326ND_1 although the magnetic structure is not fully understood even after neutron scattering studies, probably due to the competition between the intra-chain ferromagnetic (F) and inter-chain antiferromagnetic (AF) interactions.Co326ND_1 ; Co326chi_1 The valence state of the Co ions was assigned to be +3; also, the spin configuration of Co3+ ions in the CoO6 octahedron is the low-spin (LS) state with =0 and in the CoO6 prism the high-spin (HS) state with =2. Co326ND_1 ; Co326Cr_1 ; Co326theory_1 At lower temperatures, magnetization and 59Co-NMR measurements suggested the existence of a ferrimagnetic transition around 10 K,Co326chi_1 ; Co326chi_2 ; Co326NMR_1 which, however, was not seen in the specific heat (). Co326Cp_1 Furthermore, the measurement revealed an indication of either a short-range magnetic order or a gradual change in the spin state of Co ions at higher temperatures (100 - 200 K).Co326Cp_1
The other end member, BaCoO3 (=), crystallizes in the hexagonal perovskite structure, in which the face sharing CoO6 octahedra form a 1D CoO3 chain. The chains locate on a corner of the two-dimensional triangular lattice separated by Ba ions.BaCoO3_1 Although a weak ferromagnetic, ferrimagnetic or spin-glass-like behavior was observed below 100 K in the susceptibility, BaCoO3chi_1 ; BaCoO3chi_2 so far there are no reported studies using neutron scattering, NMR or SR on BaCoO3. Additionally, a recent electronic structural calculation (LDA+U) predicted a ferromagnetic ground state as the most stable configuration.BaCoO3calc_1 The structure of BaCoO3 is the same to that of CsCoCl3 and/or BaVS3, RMX3st_1 ; BaVS3st_1 which are known as typical 1D systems with =1/2. The electronic configuration () of Co4+ ions in BaCoO3 suggests that the nature of BaCoO3 is more like that of BaVS3 (with for V4+) than that of CsCoCl3 ( for Co2+). In other words, the interaction between orbitals presumably plays the dominant role for magnetism in both BaCoO3 and BaVS3. Also, BaVS3 exhibits a structural phase transition at 240 K, a metal-insulator transition at 69 K and an AF transition at 30 K. BaVS3_1 ; BaVS3_2 However, a ZF-SR experiment on BaVS3 did not detect muon spin oscillations, even at 2.2 K, but only a fluctuating random field well described by a dynamic Kubo-Toyabe relaxation function. BaVS3muSR_1
For the compounds with 2, there are very limited data on physical properties, except for the structural data.Q1D_1 ; Q1D_2 Very recently, Takami et al. reported transport and magnetic properties for the compounds with =2 - 5.Q1DNagoya_1 According to their susceptibility () measurements, there are no drastic changes in the curve below 300 K for all these compounds, while the slope of changes at around 180 K for the compounds with =2 and 3.
As increases from 1, the Co valence increases from +3 and approaches +4 with increasing up to ; i.e., BaCoO3. Also the ratio between prism and octahedron in the 1D CoO3 chain reduces from 1/1 for =1 to 0 for =.Q1D_2 Further systematic research on O3n+3 is therefore needed to provide more significant information concerning the dilution effect of HS Co3+ in the 1D chain on magnetism. In particular, muon spin spectroscopy, as it is very sensitive to the local magnetic environment, is expected to yield crucial data in frustrated low-dimensional system, as was the case for the 2D layered cobaltites.
Here we report on a series of measurements at both weak (relative to the spontaneous internal fields in the ordered state) transverse-field, (wTF-) SR, and zero field, (ZF-) SR, for polycrystalline =1, 2, 3, 5 and compounds at temperatures between 1.8 and 300 K. The former method is sensitive to local magnetic order via the shift of the spin precession frequency in the applied field and the enhanced spin relaxation, while ZF-SR is uniquely sensitive to weak local magnetic [dis]order in samples exhibiting quasi-static paramagnetic moments.
II Experiment
Polycrystalline samples of quasi-1D cobalt oxides were synthesized at Nagoya University by a conventional solid state reaction technique, using reagent grade Co3O4, CaCO3, SrCO3 and BaCO3 powders as starting materials. For BaCoO3, a sintered pellet was annealed at 650 oC for 150 h in oxygen under pressure of 1 MPa. Powder X-ray diffraction (XRD) studies indicated that the samples were single-phase of hexagonal structure. The composition and lattice parameters of the five samples are summarized in Table 1. The preparation and characterization of the samples with =1 - 5 were reported in detail elsewhere.Q1DNagoya_1
| lattice parameters | ||||
|---|---|---|---|---|
| composition | (Å) | (Å) | space group | |
| 1 | Ca3Co2O6 | 9.07 | 10.38 | |
| 2 | Sr4Co3O9 | 9.35 | 10.57 | |
| 3 | Sr5Co4O12 | 9.4 | 20.2 | |
| 5 | (Sr1/2Ba1/2)7Co6O18 | 9.7 | 30.2 | |
| BaCoO3 | 5.65 | 4.75 |
Magnetic susceptibility () was measured using a superconducting quantum interference device (SQUID) magnetometer (mpms, Quantum Design) at temperatures between 2 - 600 K with magnetic field . Heat capacity () was measured using a relaxation technique (ppms, Quantum Design) in the temperature range between 300 and 1.9 K. The SR experiments were performed on the M20 surface muon beam line at TRIUMF. The experimental setup and techniques were described elsewhere.muSR_1
III Results
III.1 n=1 compound, Ca3Co2O6
The wTF-SR spectra in a magnetic field of Oe in the Ca3Co2O6 (=1) sample, exhibit a clear reduction of the precession amplitude below 100 K. The wTF-SR spectrum below 100 K was well fitted in the time domain with a combination of four signals; a slowly relaxing precessing signal caused by the applied field, a fast relaxing precessing signal induced by quasi-static internal fields, a slowly non-oscillatory and a fast non-oscillatory background signals, namely:
| (1) | |||||
| (2) | |||||
| (3) | |||||
| (4) |
where is the initial (=0) asymmetry, is the muon spin polarization function, and are the muon Larmor frequencies corresponding to the applied weak transverse field and the internal antiferromagnetic field, and are the initial phases of the two precessing signals and and ( = TF, AF, fast and slow) are the asymmetries and exponential relaxation rates of the four signals. The fast relaxing precessing signal has a finite amplitude below K and the two non-oscillatory signals (=fast and slow) below K.
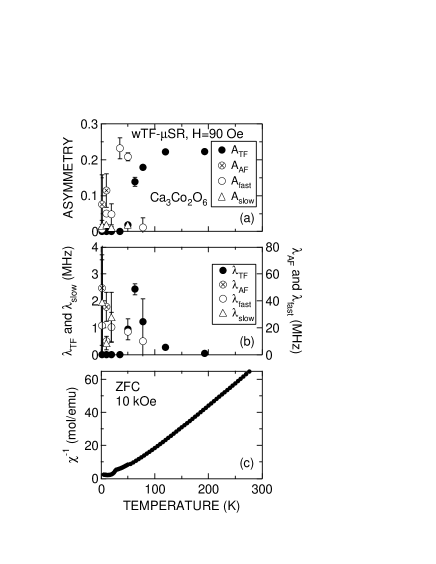
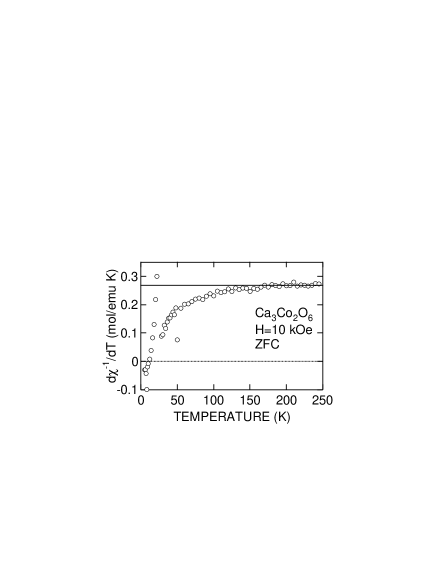
Figures 2(a) - 2(c) show the temperature dependences of , (=TF, AF, fast and slow), and inverse susceptibility measured in field cooling mode with =10 kOe in the Ca3Co2O6 sample (=1 compound). As decreases from 200 K, the magnitude of is nearly independent of temperature down to 100 K; then decreases rapidly as is lowered further. Co326muSR_1 Finally levels off to zero at temperatures below about 30 K. This indicates the existence of a magnetic transition below around 100 K. Since is proportional to the volume of a paramagnetic phase, the volume fraction of the magnetic phase below 30 K is estimated to be 100%. On the other hand, the curve exhibits a maximum at around 30 K, probably due to the onset of even stronger local fields (resulting in unobservably fast muon spin depolarization) below 30 K. The magnitude of reaches the full asymmetry of 0.22 at the maximum. The two other signals, and , appear below around 20 K, whereas seems to disappear below 20 K.
Both the and the curves exhibit a broad maximum around 60 K and 30 K, respectively. That is, increases with decreasing from 200 K to 60 K, then decreases below 60 K. Meanwhile, increases with decreasing from about 80 K (where it is first detected) down to 30 K, after which it decreases down to the lowest temperature measured. It is noteworthy that the highest value of ( s-1) is 20 times larger than that of ( s-1).
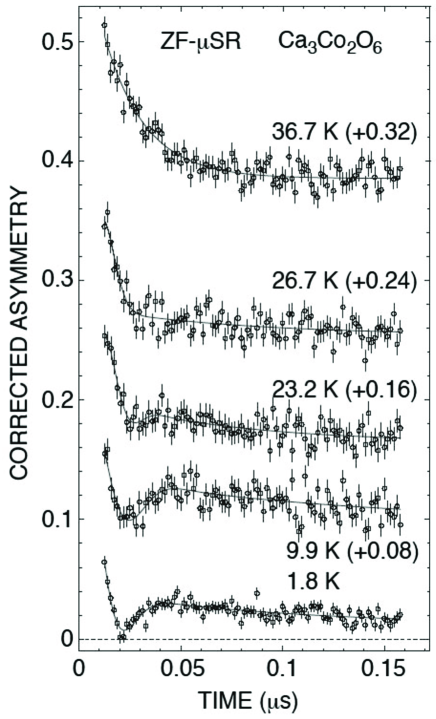
In order to elucidate magnetism below 30 K in greater detail, Fig. 3 shows ZF-SR time spectra for Ca3Co2O6 below 36.7 K. The spectrum at 36.7 K consists mainly of a fast relaxed non-oscillatory signal, while below 23.2 K a first minimum and maximum are clearly seen, indicative of a fast relaxing oscillation. Indeed, this spectrum is reasonably well fitted with a combination of an exponentially relaxed cosine oscillation (for a quasi-static internal field) and fast and slow exponential relaxation functions (for fluctuating moments), given by the the last three terms in eq. (4). Moreover, it was very difficult to fit using Kubo-Toyabe functions, which describe a random field distribution. We therefore conclude that Ca3Co2O6 undergoes a magnetic transition to a long-range ordered state below 30 K. Only the first minimum and maximum can be observed in the spectra even at 1.8 K, indicating that the formation of the long-range order is strongly suppressed probably due to geometrical frustration in the triangular lattice.
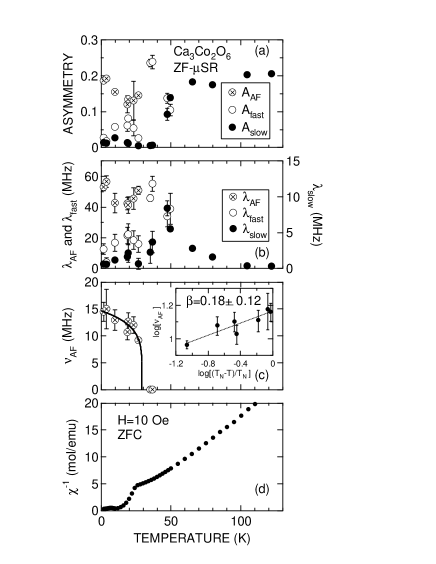
Figures 4(a) - 4(d) show the temperature dependences of , (=AF, fast and slow) and muon precession frequency ) in Ca3Co2O6. The oscillating signal has a finite intensity below 27 K, while the slow exponential relaxed signal disappears below around 30 K. This means that the magnetic moment fluctuating at high temperatures slows down with decreasing and then orders below 27 K, and becomes quasi-static (within the experimental time scale). The dependence of , which is an order parameter of the transition, is in good agreement with the dependence of the intensity of the AF magnetic diffraction peak determined by a neutron experiment.Co326ND_1 Actually, the curve is well fitted by the following expression;
| (5) |
This provides (0K)=14.60.8 MHz, =0.180.12, and =295 K (see, Fig. 4(c)). In spite of the low accuracy of the fitting, the critical exponent () obtained lies between the predictions for the 2D and 3D Ising models (=0.125 and 0.3125).critical The value of is also in good agreement with the results of and neutron diffraction measurements (=24 K).Co326ND_1 These results confirm that muons experience the internal magnetic field due to the long-range 2D AF order. It should be noted that there are no marked anomalies in the ZF-SR results around 10 K corresponding to the ferrimagnetic transition temperature.Co326chi_1 This is very reasonable because the ferrimagnetism is induced by the external field.
There are two probable explanations for the decrease in below 100 K. One is a conventional scenario, in which a short-range 1D F order appears below 100 K as proposed by Aasland et al.Co326ND_1 and probably completes below 40 K, because both (Fig. 2) and (Fig. 4) seem to level off to their minimum value (0) below around 40 K. The long-range 2D AF order then appears below 27 K. The other scenario is more ambitious; that is, a short-range 2D AF order appears below 100 K and completes below 27 K. This means that the 1D F order should exist above 100 K, which is not supported by the present SR experiments. Based only on the result in Ca3Co2O6, it is difficult to determine which scenario is more probable. We will therefore discuss this problem later.
III.2 n=2, 3 and 5 compounds
Figure 5(a) - 5(c) show the temperature dependences of (a) normalized (n-), (b) , and (c) in Ca3Co2O6 (=1), Sr4Co3O9 (=2), Sr5Co4O12 (=3), and (Ba0.5Sr0.5)7Co6O18 (=5).
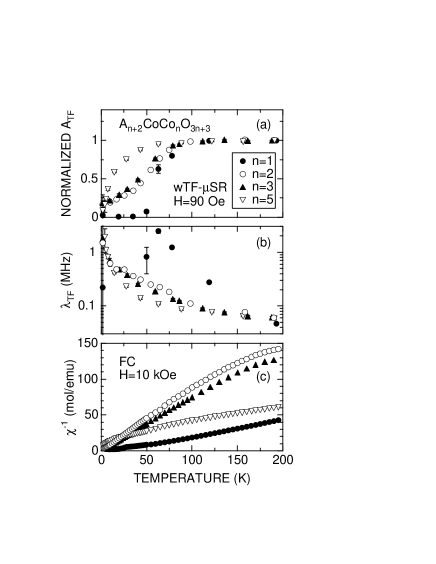
The data were obtained by fitting the wTF-SR spectra using eq. (4) without the oscillatory signal due to a static internal antiferromagnetic magnetic field (the signal). In order to compare the value of for these samples, is defined as;
| (6) |
in which is the maximum value of . Since corresponds to for the paramagnetic state, is roughly equivalent to the volume fraction of the paramagnetic phase in the sample.
All four samples show the magnetic transition below 100 K; the onset temperatures of the transition () are estimated as 10025 K for =1, 9010 K for =2, 8510 K for =3 and 5010 K for =5, respectively. The magnitude of is thus found to decrease with . It should be noted that there are no marked anomalies in the curve measured with =10 kOe at for the four compounds. Although for the =1 compound levels off to its minimum value (0) below 30 K, the curve for the other three compounds never reaches their minimum even at 1.8 K, indicating that the internal magnetic field is still fluctuating. Indeed, for the samples with =2, 3 & 5 increases monotonically with decreasing , whereas the curve for Ca3Co2O6 (=1) exhibits a sharp maximum around 55 K.
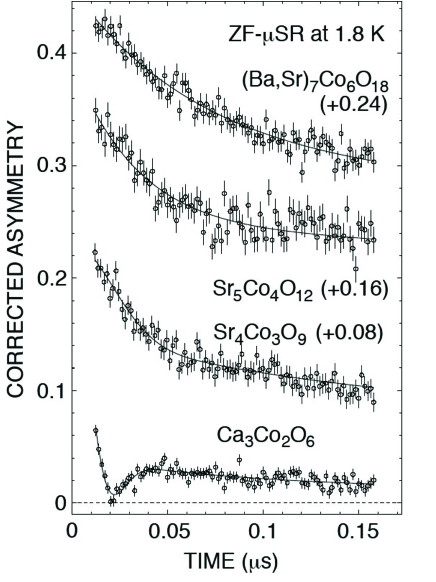
In spite of the large decrease in below 100 K for the samples with =2, 3 and 5, the ZF-SR spectra exhibit no oscillations even at 1.8 K as seen in Fig. 6. This indicates that the magnetic moment appears below , but is still fluctuating at 1.8 K. The ZF-SR spectra are well fitted by a combination of fast and slow exponential relaxation functions (for fluctuating moments) and a dynamical Kubo-Toyabe function (for a fluctuating random moment component).
| (7) | |||||
| (8) | |||||
| (9) |
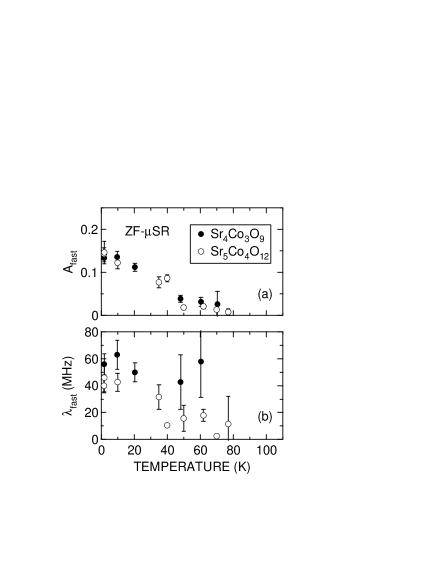
The fast exponentially relaxed signal, which corresponds to the initial decay of the ZF-spectrum in Fig. 6, appears below 80 K for the samples with =2 and 3. The and curves increase monotonically with decreasing , as expected from the wTF-SR measurement. The fitted values of at the lowest (=1.8 K) were 55 MHz for Sr4Co3O9 (=2), 40 MHz for Sr5Co4O12 (=3) and 18 MHz for (Ba0.5Sr0.5)7Co6O18 (=5). Since these are comparable to the value of (1.8 K)(=55 MHz) for Ca3Co2O6, the fast exponential relaxed signal in the samples with is most likely caused by an inter-chain 2D AF interaction. It should be noted that (1.8 K) decreases with , suggesting that the magnitude of the 2D AF interaction is weakened with decreasing .
III.3 n= compound, BaCoO3
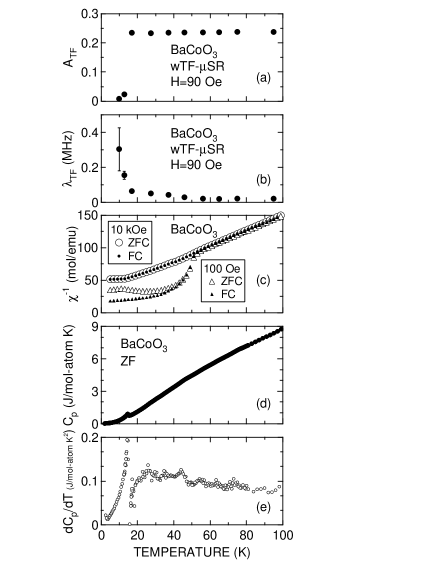
Figures 8(a)-8(c) show the temperature dependences of (a) , (b) , (c) , (d) specific heat , and (e) its temperature derivative d/d for BaCoO3 (=). Both and were obtained by fitting the wTF-SR spectra, the same way as the compounds with =2 - 5. The curve indicates the existence of an AF transition at 14 K(=) with =10 kOe, but a weak F or ferrimagnetic behavior below 53 K with =100 Oe. Also, the curve shows a sharp maximum at 15 K, indicating the existence of a magnetic transition. However, at around 53 K, there are no clear anomalies in the curve, although the slope (d/d) increases slightly around 50 K with decreasing . The lack of a clear anomaly around 50 K in the curve suggests that the transition at 53 K is induced by the 1D F order, as in the case for the 1D F order in Ca3Co2O6.
The wTF-SR experiment with 90 Oe show that, as decreases from 100 K, drops suddenly down to 0 at , indicating that the whole sample enters into an AF state. Such abrupt change in is very different from those for the other quasi-1D cobalt oxides with =1 - 5, which typically show a large transition width of 50 - 80 K. On the other hand, the curve exhibits a small increase below 50 K with decreasing , probably associated with the complicated magnetism observed in with low magnetic fields. As decreases further from 50 K, increases rapidly below 17 K, showing typical critical behavior towards .
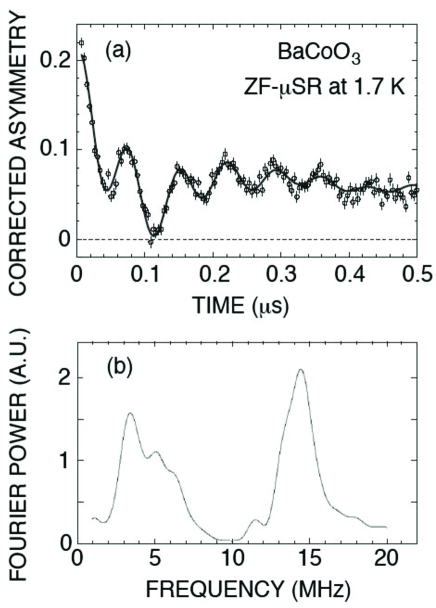
The ZF-SR spectrum at 1.7 K exhibits a clear but complex muon spin oscillation, displayed in Fig. 9(a). The Fourier transform of the ZF-SR time spectrum (Fig. 9(b)) indicates that the ZF-SR spectrum has five frequency components (, 13.5, 6.4, 5.1 and 3.5 MHz), even though the sample is structurally single phase at room temperature and there is no indication of any structural phase transition down to 77 K in resistivity () and thermopower (TEP) measurements;BaCoO3chi_1 nor are there any anomalies in the curve down to 4 K, except around . The ZF-spectra were well fitted by the following equation;
| (10) | |||||
| (11) |
where is the empirical maximum experimental muon decay asymmetry, and ( = 1 - 5) are the asymmetries and exponential relaxation rates associated with the five oscillating signals, and and ( = 1 and 2) are the asymmetries and exponential relaxation rates of the two non-oscillating signals (for the muon sites experiencing fluctuating magnetic fields).
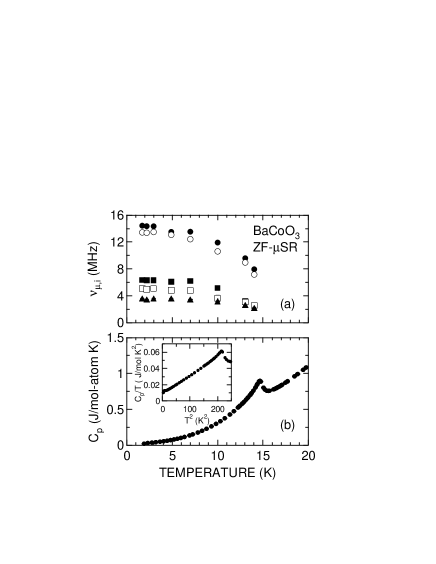
The internal magnetic fields of the five signals, i.e., with = 1 - 5, exhibit a similar temperature dependence, as seen in Fig. 10(a). That is, as decreases from 20 K, each suddenly appears below 15 K, at which the curve shows a typical behavior for the AF transition (Fig. 10(b)), and increases with a decreasing slope d/d, then levels off to a constant value below 5 K. Here, it is worth noting that the -vs.- curve indicates the change in an order parameter of the transition. Thus, the rapid temperature dependence of just below suggests that the transition is likely to be continuous. Actually, the curve also supports that the transition at 15 K is continuous. The five frequencies are therefore unlikely to be caused by inequivalent muon sites in the crystal lattice (compositional inhomogeneities), but most likely reflect the intrinsic behavior of BaCoO3.
IV Discussion
IV.1 for the compounds with =1 - 5
| composition | charge distribution | spin distribution | |
|---|---|---|---|
| 1 | Ca3Co2O6 | Co, Co | 2, 0 |
| 2 | Sr4Co3O9 | Co, Co, Co | 2, 0, 1/2 |
| 3 | Sr5Co4O12 | Co, Co, Co, Co | 2, 0, 1/2, 1/2 |
| 5 | (Sr1/2Ba1/2)7Co6O18 | Co, Co, Co, Co, Co, Co | 2, 0, 1/2, 1/2, 1/2, 1/2 |
| BaCoO3 | Co | 1/2 |
In order to understand the common features of the macroscopic magnetism of the quasi-1D compounds taken collectively, Fig. 11 shows the average valence of Co () ions, the effective magnetic moment of Co ions () and the paramagnetic Curie temperature () as a function of . The curve is calculated from the nominal composition of the 1D system; that is, we ignored a possible oxygen deficiency in the samples. The values of and were obtained by fitting the curve between 300 - 600 K using the Curie-Weiss law. The solid line in Fig. 11(b) represents the curve for the charge and spin distribution on the CoO3 chain in Table 2; that is, one Co3+ in the CoO6 prism (Co) with the HS state (=2) and one Co3+ and (-1)Co4+ in the CoO6 octahedra (Co and Co) with the LS state (=0 and 1/2). The relationship between and is given by;mumix
| (12) |
where and are for Co ions with =2 and =1/2 (Co and Co). Since the variation of measured below =5 is well explained by eq (13), the above spin and charge configuration in the CoO3 chain is the most probable one. This also suggests that the oxygen deficiency in the samples with is very small. For BaCoO3 (=), is estimated as 2.45 , whereas it is for Co with =1/2. This discrepancy was also reported by another group () and was explained using a large factor (=2.2) for the Co ions, BaCoO3chi_1 although =2.0 for Fe-doped Ca3Co2O6 was found in an ESR study. Co326Fe_1
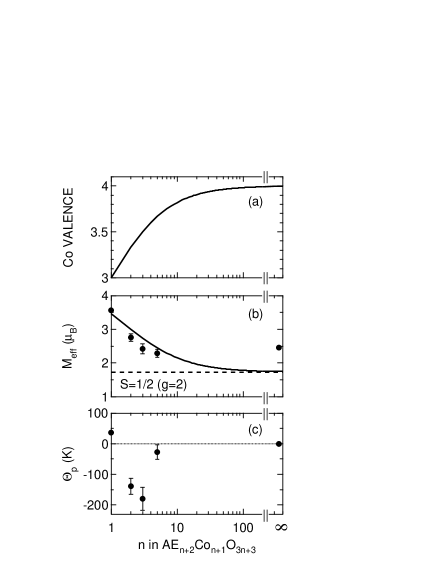
For Ca3Co2O6 (=1), =36.10.8 K, and this is consistent with past work.Co326chi_1 ; Co326chi_2 As increases from 1 to 3, changes its sign from positive to negative and rapidly decreases down to -180 K, then increases with further increasing and approaches 0 at =. A large negative paramagnetic Curie temperature for the samples with =2 and 3 obviously indicates that the transition at is caused by an inter-chain 2D AF interaction. Considering the structural similarity among the quasi 1D cobalt oxides, for the samples with =1 and 4 are therefore most likely due to the appearance of the short-range 2D AF order. The magnitude of the 1D F interaction would be strongly affected by , because not only the structure of the chain but also the Co valence are altered by (see Table II). Compared with the the intra-chain 1D F interaction, the inter-chain 2D AF interaction is expected to be insensitive to , as the geometrical arrangement of the chains in the plane is essentially the same for all the compounds with =1 - . This indicates that the inter-chain AF interaction plays a significant role for determining the magnetism detected by the current SR measurements. Here we wish to emphasize that is not caused by the change in the spin state of Co ions proposed by Hardy et al.,Co326Cp_1 because the decrease in confirms the appearance of a magnetically ordered phase. On the contrary, it was found that not but exhibit an anomaly at the spin state transition in the layered cobaltites.jun_PRB4
Since each chain is considered to act as a single spin, we ignore the intra-chain 1D F interaction. Within the mean field theory, is expressed by;
| (13) |
where is the number of the nearest neighboring spins, is the 2D AF coupling constant and is the Boltzmann constant. Although 295 K for Ca3Co2O6 from the ZF-SR measurement, we introduce a virtual () to explain the behavior of the curve, indicating the appearance of the short-range 2D AF order. Assuming that (or ) = and =6, we can estimate for the current samples using the spin distribution in Table. II. Here, denotes the temperature at which =0.5.
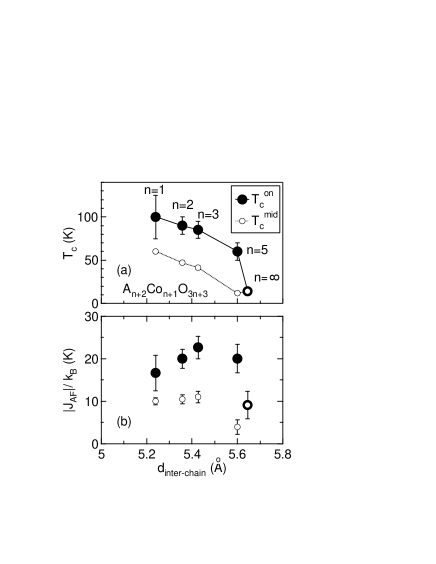
Figures 12(a) and 12(b) show the variation of and as a function of the inter-chain distance in Con+1O3n+3. Although decreases with (and/or ), the magnitude of / is roughly the same (20 K or 10 K) for all the samples. This suggests that is induced by the 2D AF interaction not only for the compounds with 2 but also for Ca3Co2O6.
For BaCoO3, the lowest and the sharp transition width are characteristic features compared with those for the compounds with 5 (see Figs. 5 and 8). Also, a clear muon oscillation is observed only in BaCoO3 below 15 K. These suggest a smaller fluctuation and/or distribution of the internal magnetic field in BaCoO3 than in the compounds with 5. As seen in Table II, Co4+ ions with =1/2 (Co) are stable in BaCoO3, while both Co3+ ions with =2 and =0 (Co and Co) coexist in Ca3Co2O6 and Co, Co and Co in the compounds with =2 - 5. A mixed valence state is expected in the neighboring Co and Co ions for minimizing electronic repulsion, indicating the existence of a fluctuating magnetic field. Also, the spin and charge distribution in the compounds with 5 would induce a large distribution in the internal magnetic field. These are most likely to be the reasons for the difference between BaCoO3 and the compounds with =1 - 5.
IV.2 Ferromagnetic order along the chain
As seen in Fig. 8, the curve for BaCoO3 exhibits a weak F or ferrimagnetic behavior below 53 K only under low magnetic fields. Reflecting this change, increases slightly below 50 K with decreasing , while there are no anomalies in the curve down to 15 K. It is therefore most reasonable to conclude that, as decreases, the 1D F order completes below 53 K, then the 2D AF order becomes stable below 15 K. In other words, the F order in the chain is easily observed by measurements but looks very complex in SR. This situation is similar to the case for the typical 1D antiferromagnet CsCoCl3, in which the short-range 1D AF order appears below 75 K.CsCoCl3chi_1 This corresponds to the maximum in the curve. Nevertheless, moving solitons along the chainCsCoCl3ND_1 induce a large fluctuation of the internal field at the muon sites. As a result, SR was able to detect the 2D AF order but unable to observe the short-range 1D AF order.CsCoCl3muSR_1
For the compounds with =1 - 5, we propose that (or )= is caused by the 2D AF interaction. Hence, there should exist a transition into the short-range 1D F ordered state above . For Ca3Co2O6, this requirement is very consistent with the indication of a short-range magnetic order below 200 K detected by a specific heat measurement.Co326Cp_1 The curve for the current Ca3Co2O6 also exhibits a deviation from the linear relationship below 150 K (see Fig. 13),Co326chi_2 presumably indicating the appearance of the 1D F order.
Furthermore, recent measurements for the compounds with =2 - 5 showed a field dependence even at 300 K.Q1DNagoya_2 This may be due to the appearance of short-range 1D F order along the chain. The overall scenario for the quasi-1D systems is therefore that the 1D F ordered state exists even at 200 K, while the 2D AF ordered state appears below 100 K. The former is very difficult to detect by SR and neutron diffraction measurements, but the latter can be relatively easily observed by SR.
IV.3 Multi-frequency components in BaCoO3
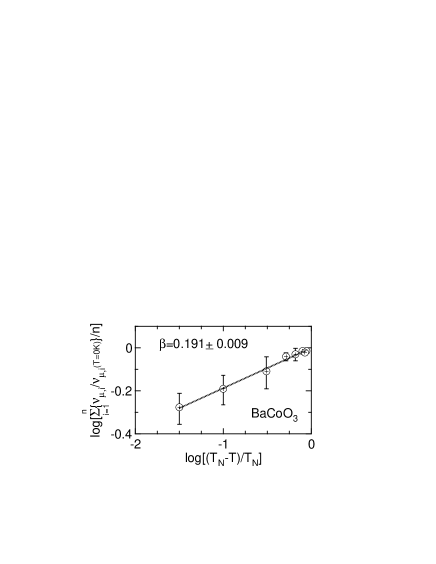
In order to evaluate the critical exponent () for the AF transition, Fig. 14 shows the relationship between the normalized oscillation frequency /(0K) and the reduced temperature (-)/. Here, (0K) and are obtained by fitting the curve (Fig. 10) with eq. (5). We obtain =0.1910.009 and =14.50.2. The evaluated for BaCoO3 also ranges between the predictions for the 2D and 3D Ising model (=0.125 and 0.3125) , and is roughly the same as that for Ca3Co2O6 (=0.180.12). This indicates a strong 2D character of the AF transition in BaCoO3, in contrast to =0.31 for the 1D antiferromagnet CsCoBr3. CsCoBr3critical_1 Here of CsCoBr3 was evaluated using the neutron diffraction data in the vicinity of (510), whereas of BaCoO3 the SR data at . According to Ref. [40], however of CsCoBr3 looks almost the same value (0.31) even using the data at . The result that [BaCoO[CsCoBr3] is therefore reliable. This discrepancy is probably due to the difference of the orbitals contributing to the magnetism; that is, for Co4+ in BaCoO3 and for Co2+ in CsCoBr3. The overlap of the former between the neighboring chains is expected to be smaller than that of the latter.BaVS3calc_1
The simple hexagonal structure of BaCoO3 (and the lack of structural phase transitions at low ) and good quality of our sample suggest the difficulty for explaining five frequencies by multi-muon sites and/or inhomogeneity of the sample. In addition the fact that the five frequencies show a sharp transition at the same temperature indicates that these are the intrinsic behavior in BaCoO3. We consider the following two hypotheses;
-
1.
coexistence of 2D AF and 1D F interaction
According to the measurement at high , the paramagnetic Curie temperature was found to be almost 0 K. This indicates that the magnitude of the inter-chain 2D AF interaction is roughly the same as that of the intra-chain 1D F interaction. The highest frequency in Fig. 9 (14.4 MHz) is comparable to the AF oscillation frequency in Ca3Co2O6 (15 MHz at 1.8 K). The signals with 5 MHz would correspond to the magnetic fields of the intra-chain 1D F order.
-
2.
AF domain structure
One CoO3 chain (at (0,0)) is surrounded by six nearest neighboring CoO3 chains in the 2D triangular lattice. We ignore the effect of the second nearest neighboring chains. If the dipole field from the nearest neighboring chain is defined as at (0,0), the total field at (0,0) can be represented by; , , and , in which is the field from the chain at (0,0). This could be consistent with a roughly symmetrical distribution of at 1.8 K (see Fig. 9(b)). In this case, 10 MHz, where kHz/Oe. Furthermore, the electronic structural calculation suggested almost a similar stability for the two type of AF configuration, although the F configuration was predicted to be most stable.BaCoO3calc_1
In order for further understanding the nature of the AF phase in BaCoO3, more precise SR measurements on pure and doped BaCoO3 are necessary; in particular, the change in the inter-chain distance by chemical and/or physical pressure is crucial to distinguish the two hypothesis above through the shift of the balance between the 1D F and 2D AF interactions.
V Summary
Magnetism of quasi one-dimensional (1D) cobalt oxides Con+1O3n+3 (=Ca, Sr and Ba, =1, 2, 3, 5 and ) was investigated by susceptibility () and muon spin rotation and relaxation (SR) measurements using polycrystalline samples, at temperatures from 300 K down to 1.8 K. The measurement confirmed a systematic change in the charge and spin distribution in the 1D CoO3 chain with . The weak transverse field (wTF-) SR experiments showed the existence of a magnetic transition in all five samples investigated. The onset temperature of the transition () was found to decrease with ; that is, 10025 K, 9010 K, 8510 K, 5010 K, and 151 K for =1, 2, 3, 5, and , respectively. In particular, for the samples with =2 - 5, was detected only by the present SR measurements. A muon spin oscillation was clearly observed in both Ca3Co2O6 (=1) and BaCoO3 (=), whereas only a fast relaxation is apparent even at 1.8 K in the other three samples (=2, 3 and 5).
A large negative paramagnetic Curie temperature for the samples with =2 and 3 indicated that the transition at is caused by an inter-chain two-dimensional (2D) antiferromagnetic (AF) interaction. Considering the structural similarity among the quasi 1D cobalt oxides, the transitions at for the samples with =1 and 5 were therefore most likely due to the appearance of the short-range 2D AF order. This suggested that the 1D ferromagnetic order in the CoO3 chain of Ca3Co2O6 (=1) would occur at higher temperatures (200 K) than proposed previously (80 K).
For BaCoO3 (=), the measurement confirmed that =(=15 K) and =53 K, which corresponds to the ferromagnetic (F) transition caused by an intra-chain 1D interaction. Nevertheless, the wTF-asymmetry () did not exhibit a marked anomaly at , while is very sensitive to the formation of magnetic order. This is likely to be caused by a domain motion in the 1D chain, as in the case for CsCoCl3. In spite of the fact that the sample is structurally homogeneous, the ZF-SR spectrum showed a complex of at least five frequency components below , which require further detailed studies.
Acknowledgements.
We thank Dr. S.R. Kreitzman, Dr. B. Hitti and Dr. D.J. Arseneau of TRIUMF for help with the SR experiments. We appreciate useful discussions with Dr. R. Asahi of Toyota CRDL. This work was supported at Toyota CRDL by joint research and development with International Center for Environmental Technology Transfer in 2002-2004, commissioned by the Ministry of Economy Trade and Industry of Japan, at UBC by the Canadian Institute for Advanced Research, the Natural Sciences and Engineering Research Council of Canada, at TRIUMF by the National Research Council of Canada, and at Nagoya Univ. (T. T.) by a Grant-in-Aid for the 21st Century COE program, ”Frontiers of Computational Science.”References
- (1) J. Sugiyama, H. Itahara, T. Tani, J. H. Brewer, and E. J. Ansaldo, Phys. Rev. B 66, 134413 (2002).
- (2) J. Sugiyama, H. Itahara, J. H. Brewer, E. J. Ansaldo, T. Motohashi, M. Karppinen, and H. Yamauchi, Phys. Rev. B 67, 214420 (2003).
- (3) J. Sugiyama, J. H. Brewer, E. J. Ansaldo, H. Itahara, K. Dohmae, Y. Seno, C. Xia, and T. Tani, Phys. Rev. B 68, 134423 (2003).
- (4) J. Sugiyama, J. H. Brewer, E. J. Ansaldo, H. Itahara, T. Tani, M. Mikami, Y. Mori, T. Sasaki, S. Hébert, and A. Maignan, Phys. Rev. Lett. 92, 17602 (2004).
- (5) J. Sugiyama, J. H. Brewer, E. J. Ansaldo, B. Hitti, M. Mikami, Y. Mori, and T. Sasaki, Phys. Rev. B 69, 214423 (2004).
- (6) S. P. Bayrakci, C. Bernhard, D. P. Chen, B. Keimer, R. K. Kremer, P. Lemmens, C. T. Lin, C. Niedermayer, and J. Strempfer , Phys. Rev. B 69, 100410(R) (2004).
- (7) A. T. Boothroyd, R. Coldea, D. A. Tennant, D. Prabhakaran, L. M. Helme, and C. D. Frost, Phys. Rev. Lett. 92, 197201 (2004).
- (8) K. Boulahya, M. Parras, and J. M. Gonzlez-Calbet, J. Solid State Chem., 142, 419 (1999).
- (9) M.-H. Wangbo, H.-J. Koo, K.-S. Lee, O. Gourdon, M. Evain, S. Jobic, and R. Brec, J. Solid State Chem., 160, 239 (2001).
- (10) H. Fjellvåg, E. Gulbrandsen, S. Aasland, A. Olsen, and B. C. Hauback, J. Solid State Chem., 124, 190 (1996).
- (11) S. Aasland, H. Fjellvåg, and B. Hauback, Solid State Commu., 101, 187 (1997).
- (12) H. Kageyama, K. Yoshimura, K. Kosuge, H. Mitamura, and T. Goto, J. Phys. Soc. Jpn., 66, 1607 (1997).
- (13) H. Kageyama, K. Yoshimura, K. Kosuge, M. Azuma, M. Takano, H. Mitamura, and T. Goto, J. Phys. Soc. Jpn., 66, 3996 (1997).
- (14) B. Raquet, M. N. Baibich, J. M. Broto, H. Rakoto, S. Lambert, and A. Maignan, Phys. Rev. B, 65, 104442 (2002).
- (15) B. Martnez, V. Laukhin, M. Hernando, J. Fontcuberta, M. Parras, and J. M. Gonzlez-Calbet, Phys. Rev. B, 64, 12417 (2001).
- (16) S. Rayaprol, K. Sengupta and E. V. Sampathkumaran, J. Solid State Chem., 128, 79 (2003).
- (17) D. Flahaut, A. Maignan, S. Hébert, C. Martin, R. Retoux, and V. Hardy, Phys. Rev. B, 70, 94418 (2004).
- (18) R. Fresard, C. Laschinger, T. Kopp, and V. Eyert, Phys. Rev. B, 69, 140405(R) (2004).
- (19) E. V. Sampathkumaran, N. Fujiwara, S. Rayaprol, P. K. Madhu, and Y. Uwatoko, Phys. Rev. B, 70, 14437 (2004).
- (20) V. Hardy, S. Lambert, M. R. Lees, and D. McK.Paul, Phys. Rev. B, 68, 14424 (2003).
- (21) Y. Takeda, J. Solid State Chem., 15, 40 (1975).
- (22) K. Yamaura, H. W. Zandbergen, K. Abe and R. J. Cava, J. Solid State Chem., 146, 96 (1999).
- (23) K. Yamaura, and R. J. Cava, Solid State Commu., 115, 301 (2000).
- (24) V. Pardo, P. Blaha, M. Iglesias, K. Schwarz, D. Baldomir, and J. E. Arias, Cond-mat/0405082.
- (25) T. Li, G. D. Stucky, and G. L. McPherson, Acta Crystallogr. B, 29, 1330 (1973).
- (26) R. A. Gardner, M. Vlasse, and A. Wold, Acta Crystallogr. B, 25, 781 (1969).
- (27) G. Mihly, I. Kzsmrki, F. Zmborszky, M. Miljak, K. Penc, P. Fazekas, H. Berger and L. Forr; Phys. Rev. B 61, R7831 (2000).
- (28) T. Inami, K. Ohwada, H. Kimura, M. Watanabe, Y. Noda, H. Nakamura, T. Yamasaki, M. Shiga, N. Ikeda, and Y. Murakami, Phys. Rev. B 66, 073108 (2002).
- (29) W. Higemoto, A. Koda, G. Maruta, K. Nishiyama, H. Nakamura, S. Giri, and M. Shiga, J. Phys. Soc. Jpn. 71, 2361 (2002).
- (30) T. Takami, H. Ikuta, and U. Mizutani, Jpn. J. Appl. Phys. 43, 8208 (2004).
- (31) G. M. Kalvius, D. R. Noakes, and O. Hartmann, in Handbook on the Physics and Chemistry of Rare Earths 32 edited by K. A. Gschneidner Jr. et al., (North-Holland, Amsterdam, 2001) pp. 55-451, and references cited therein.
- (32) This is consistent with the preliminaly SR experiment on Ca3Co2O6 using a pulsed muon beam at KEK (T. Takeshita, N. Nomura, K. Sato, S. Kaneko, T. Goto, J. Arai, K. Nishiyama, and K. Nagamine, in the Abstracts of the Annual Meeting of Phys. Soc. Jpn. 2003, 22aTC-11 (2003), in Japanese). However, there were neither information on and nor muon oscillation below in the report, because of a limited time resolution of the pulsed beam (below 10 MHz).
- (33) H. E. Stanley, in Introduction to phase transitions and critical phenomena, (Clarendon, Oxford, 1971).
- (34) N. Y. Vasanthacharya, P. Ganguly, J. B. Goodenough, and C. N. R. Rao, J. Phys. C: Solid State Phys., 17 2745, (1984).
- (35) H. Kageyama, K. Yoshimura, K. Kosuge, H. Nojiri, K. Owari, and M. Motokawa, Phys. Rev. B, 58, 11150 (1998).
- (36) M. Achiwa, J. Phys. Soc. Jpn., 27, 561 (1969).
- (37) H. Yoshizawa, K. Hirakawa, S. K. Satija, and G. Shirane, Phys. Rev. B, 23, 2298 (1981).
- (38) M. Mekata, S. Onoe, H. Kuriyama H, J. Mag. Mag, Mater., 104, 825 (1992).
- (39) T. Takami, H. Ikuta, and U. Mizutani, unpublished.
- (40) W. B. Yelon, D. E. Cox, and M. Eibschtz, Phys. Rev. B 12, 5007 (1975).
- (41) X. Jiang and G. Y. Guo, Phys. Rev. B, 70, 035110 (2004).