Comment on “Multiple Bosonic Mode Coupling in the Electron Self-Energy of (La2-xSrx)CuO4”
Recently Zhou et al reported photoemission data from underdoped (La2-xSrx)CuO4 revealing ”fine structure” in the single-particle self-energy Zhou . Four ”fine structures” at energies of (40–46) meV, (58–63) meV, (23–29) meV and (75–85) meV, were identified in the real part of and attributed to coupling of electrons to four phonon modes. The maximum entropy method was used to fit the measured Re and the coupling function was extracted. Here, we argue that the features in Re interpreted by Zhou et al Zhou as the ”fine structure” could not be detected with the experimental parameters used in Zhou . We show that the measured Re displays more ”structure” than physically possible and the ”fine structure” should therefore be interpreted as statistical noise or other experimental error.
Our strategy is to check whether such fine structure may be observed, even in principle, in an experiment with the experimental resolution comparable to the splitting between neighboring peaks or shoulders (”structures”) in the Re. As a first step, we took from Zhou and reproduced the calculated self-energy, as shown in Fig 1c). This self-energy was directly compared to the experimental Re in Zhou , clearly demonstrating that no experimental broadening was considered in the fitting procedure. However, the claimed energy resolution in Zhou ranges from 12 to 20 meV res at which the effects on the measured Re are quite significant and, as we show bellow, essentially forbid the observation of ”fine structure” suggested in Zhou .
The measured Re is extracted from momentum distribution curves (MDC) and is affected by the experimental resolution in a non-trivial way. To see the effects of finite energy resolution on the MDC derived self-energy, we have simulated the photoemission intensity by using the self-energy and the dispersion relation from Zhou . A constant term of 50 meV (roughly one half of the experimental value) is added to the Im. The resulting simulation is shown in Fig. 1a. Now, the ”experimental” spectrum would be smeared in energy and momentum by finite energy and momentum resolution.
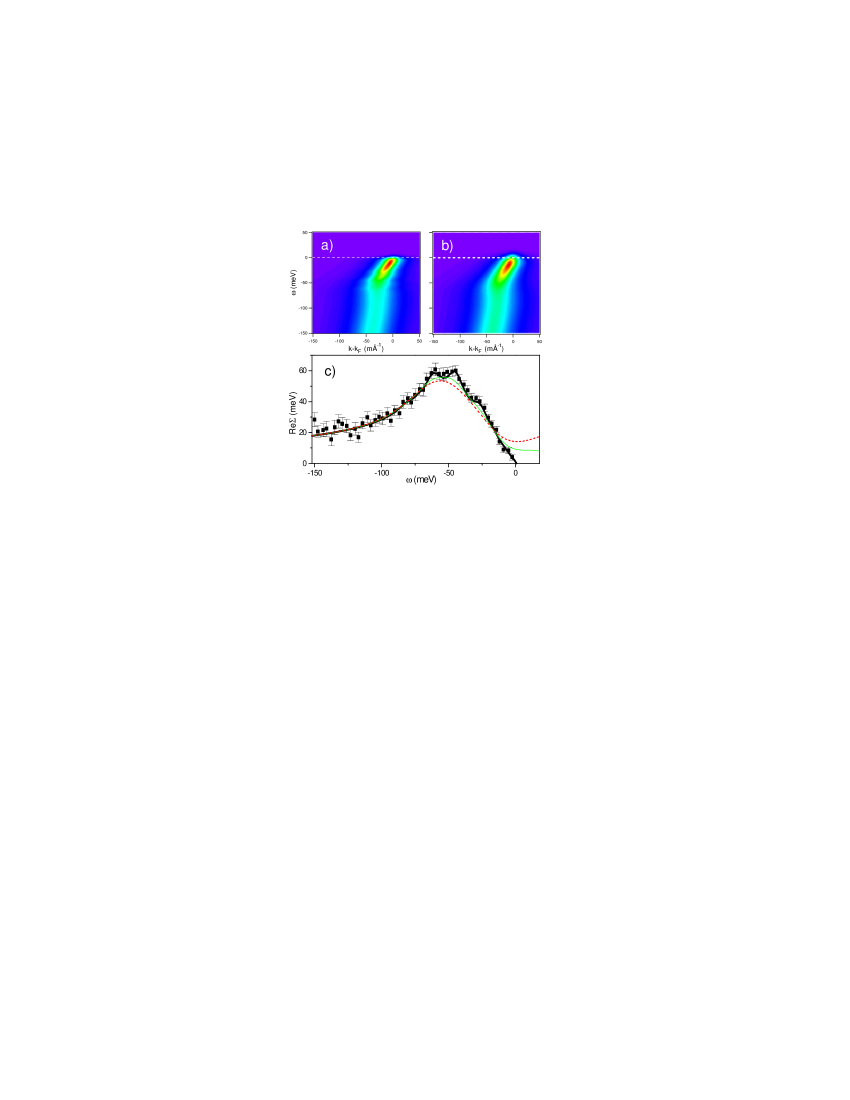
In the following we completely neglect the momentum broadening and only convolve
the simulated spectrum in energy. The result for meV is shown in Fig 1b, while the corresponding
MDC deduced Re is shown in Fig 1c) by the thin solid line. If measured with meV, the Re
would look as the dashed line in Fig 1c).
It is obvious that the ”fine structure”, present in the unbroadened spectrum, dissappears completely, even at meV structure .
Therefore, its ”presence” in the data signals some experimental error, most likely statistical noise.
The finite energy resolution also introduces a shift in the apparent (an offset in Re at ),
altering the magnitude and the shape of the measured Re.
Depending on temperature and on details of quasiparticle dispersions, Fermi velocities may be significantly overestimated.
At low temperature () the effect is most pronounced and near it is roughly proportional to .
In the opposite limit, () these effects disappear. In the present case, however, the effect near is
15-25 of the maximum value of Re and should be easily detected. Even the
shape and magnitude of the broad structure in Re is significantly altered. However, Zhou et al have
missed and/or ignored these effects completely. Instead, they claim that much finer structure, unobservable under the cited experimental conditions, is real.
In conclusion, we showed that such structure can not be real and is probably noise related.
T. Valla
Physics Department, Brookhaven National Laboratory
Upton, NY 11973-5000
References
- (1) X. J. Zhou et al, Phys. Rev. Lett. 95, 117001 (2005).
- (2) Fig. 1b) in Zhou suggests that the actual energy resolution was meV in that case.
- (3) The simulated Re has only one broad maximum at meV, while its second derivative obviously has more structure. The structure in the second derivative of the simulated curve can not be a valid criterion for the existence of multiple modes, especially in the case where the simulated curve differs so much from the data.