Electron-boson mode coupling and the pseudogap of NaxCoO2 by infrared spectroscopy
Abstract
We report the in-plane optical measurements on NaxCoO2 with 0.18x0.92. The crystal growth and characterization were described in detail. The spectral weight increases monotonically with decreasing x. For sample with the lowest Na content x0.18, the optical conductivity was strongly suppressed below 2200 at low temperature. The suppression becomes weaker with increasing Na content, and disappears in charge-ordered sample with x0.5. At higher Na contents, similar suppression appears again but locates at higher energy scale near 3300 . Our analysis indicates that those spectral features are dominated by a combination of electrons coupling to a bosonic mode and a pseudogap-like phenomenon. We suggest that the pseudogap-like phenomenon is purely a band structure effect. The infrared activated phonon modes were discussed in relation with the structural geometries.
pacs:
78.20.-e, 71.27.+a, 74.25.Gz, 74.25. KcI INTRODUCTION
The discovery of superconductivity at 4 K in hydrated sodium cobaltateTakada has attracted much attention in NaxCoO2 material. A rich phase diagram has been revealed for NaxCoO2 with a change of Na content x. A spin ordered phase is found for x3/4. With decreasing Na contents, the material becomes a ”Curie-Weiss metal” for x near 2/3, then a charge-ordered insulator with x 1/2, and finally a paramagnetic metal with x 1/3.Foo Superconductivity occurs when sufficient water is intercalated between the CoO2 layers for x near 1/3. The cobaltate provides a model system for studying the physics of correlated electrons in a 2D triangular lattice. It is also widely expected that the study of NaxCoO2 system may shed new light on high-Tc superconductivity in cuprates.
Various experimental techniques have been employed to explore the properties of NaxCoO2 . Among others, the optical spectroscopy yields important information about electronic structure and charge dynamics of the system. Several groups Lupi ; Wang1 ; Bernhard ; Caimi ; Hwang1 ; Wang2 have performed optical studies on NaxCoO2 , but those work were almost limited to compounds with high Na concentration (x0.5). The only work Hwang1 that contains infrared data of a x=0.25 compound revealed an insulating behavior of the sample, and its spectral feature is almost identical to that seen on charge-ordered compound of x=0.5.Hwang1 ; Wang2 This result is in contradiction to the expected metallic response at this doping level. Therefore, the so-called paramagnetic metals for x near 1/3, a doping region where superconductivity occurs after hydrated, remain unexplored by optical spectroscopy.
On the other hand, the reported optical data show apparent controversies, particularly with respect to the low- charge dynamics. Lupi et al.Lupi measured the optical spectra of a Na0.57CoO2 single crystal and reported an anomalous Drude behavior. The optical scattering rate, 1/, extracted from the extended Drude model shows a dependence. Caimi et al.Caimi studied a Na0.7CoO2 crystal and found a roughly -linear dependence of the 1/ at low . By contrast, the recent work by Hwang et al.Hwang1 indicated a -linear dependence of 1/ at high , while the low- scattering is dominated by a bosonic mode with an onset frequency of scattering near 600 cm-1 . The spectral feature is very much like that in the cuprates. In this work, we present the in-plane optical measurements at different temperatures on NaxCoO2 with different x. We show that in metallic samples, the optical spectra were dominated by a combination of the coupling effect of electrons with a Boson mode and a pseudogap-like phenomenon. We provide a detailed analysis for the origin of the pseudogap-like feature.
II Crystal growth and characterizations
High-quality NaxCoO2 single crystals were grown from a floating zone optical image furnace. Powders of Na2CO3 and Co3O4 with nominal chemical ratios of x=0.751.0 were well mixed, ground, heated at 750 for 24 hours twice with intermediate grinding, followed by calcination at 820850 for another 24 hours. From X-ray diffraction measurement, the calcined powders were already in a single phase. Then, the calcined powders were pressed into a rod with a size roughly 8 mm 10 cm under a pressure of 70 MPa, and annealed at 850 for one day in flowing oxygen to form feed rod. A part of the rod (2 ) was cut and used as the seed. The feed rod was pre-melted in the floating zone furnace with a feeding speed of 30 mmh. Then the pre-melted rod was used as a feed and re-melted with a much slower feeding speed 24 mmh under 5 atm oxygen pressure. During the procedure, the feed rod and seed were rotated in contrary directions at a speed of 20 rpm to insure a uniform melting zone. The obtained single crystal ingot was characterized by x-ray diffraction, electrical transport and magnetic measurement. It is found that the top 2 part of the ingot has higher quality than the rest part. So for every ingot, the top 2 cm was cut-off and the rest part was re-melted again. The induction coupled plasma (ICP) analysis was used to determine the Na:Co ratios. The sodium concentrations in the range of 0.750.95 were obtained for the as-grown crystals. For getting crystals with low sodium contents, the obtained as-grown single crystals of Na0.85CoO2 were immersed in solution of 60 ml bromine/CH3CN with very different bromine concentrations for over one month. Eventually, we obtained a series of NaxCoO2 single crystals with reduced Na concentrations x=0.48, 0.36, 0.32, 0.18 by ICP measurement.
Fig. 1 (a) shows the (00l) x-ray diffraction patterns of cleaved NaCo single crystals with x=0.18, 0.32, 0.36, 0.48, 0.85, and 0.92. The obtained c-axis lattice constants show a monotonous increase for decreasing the sodium contents, as displayed in 1 (b). For three low Na content samples, the weak lines at 2=12.8, 25.7, 36.7 are originated from water intercalation after exposed to atmosphere for a long time.Lin Samples with higher Na contents x0.48 are very stable, and no water absorption could be detected. An as-grown NaCoO2 crystal ingot is shown in 1 (c). The ab-plane can be easily cleaved from the ingot due to layered structure of the compound.

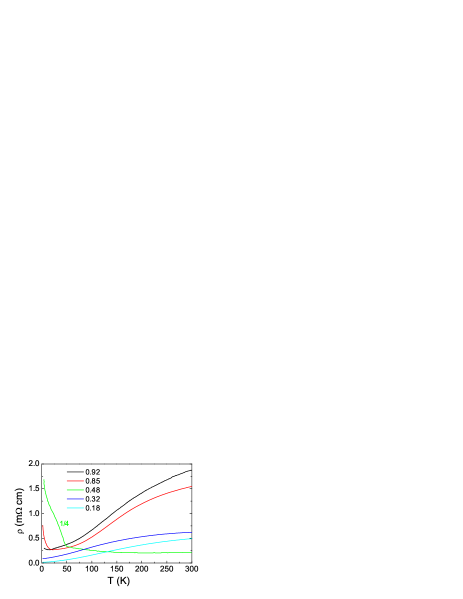
Fig. 2 shows the in-plane resistivity for several compositions measured by a four-probe low frequency ac method. For the as-grown x0.85 sample, it shows a metallic behavior above 18 K but exhibits an upturn at low temperature because of the formation of the A-type long-range anti-ferromagnetic orderingLuo ; Boothroyd . A weak upturn feature is also seen for x=0.92 sample. For x=0.48 crystal, a sharp metal-insulator transition occurs at 48 K which is due to the well-known charge-ordering formation. The two other samples with lower Na contents of x=0.32 and 0.18 show metallic behavior in the whole temperature range. For the measured samples, the in-plane resistivity decreases monotonously with decreasing Na content. Since the x=0 compound is a half-filled system (with a te (Co+4) electron configuration), and is anticipated to be a Mott insulator within the strong electron-correlation picture. One would expect to observe a transition from metallic to insulating transport for x approaching zero. However, down to the lowest Na content x=0.18, there is no indication for such a transition. As the compound with lower Na content was not obtained, it is not clear whether the x=0 compound is really a Mott insulator or a good metal with half-filled band.
III Optical properties
III.1 Evolution of optical spectra with doping
The near-normal incident reflectance spectra were measured on the freshly cleaved surface using a Bruker 66v/s spectrometer in the frequency range from 40 cm-1 to 28000 cm-1 , as described in our earlier report.Wang1 ; Wang2 Standard Kramers-Kronig transformations were employed to derive the frequency-dependent conductivity spectra. R() was extrapolated to zero frequency by using a standard Hagen-Rubens behavior and a constant extrapolation to 400000 cm-1 followed by a behavior in high energy side.

Fig. 3 (a) and (b) show the room temperature in-plane reflectance and conductivity spectra for NaxCoO2 with x=0.180.92 over broad frequencies. We found that the compound with the highest Na content has the lowest reflectance values and edge frequency, as a result, it has the lowest spectral weight in optical conductivity curve. According to the partial sum-rule, the area under the conductivity curve below a certain frequency corresponds to the effective carrier density below that frequency. The effective density of carriers per Co ion contributed to conductivity below is , where m is the free-electron mass, mb the averaged high-frequency optical or band mass, a unit cell volume, N the number of Co ions per unit volume. Fig. 1(c) displays as a function of frequency for those samples. The result is in good agreement with earlier studies on limited doping levels.Wang2 ; Hwang1 Obviously, the compound with high Na content has low conducting carrier density. Since the x=1 compound has a te (low spin state of Co3+) electron configuration and is expected to be a band insulator with completely filled t2g band and empty eg band, the gradually vanishing spectral weight for high Na content samples confirms such a band insulator for x=1 compound. With reducing the sodium content from 0.92 to 0.18, the spectral weight increases monotonously, suggesting a continuous increase of the effective carriers density. Many people considered the NaxCoO2 system in the superconducting region (x0.3) as being evolved from the x=0 compound by adding the system electrons, i.e. a doped Mott insulator. The optical data here indicate that at least down to x=0.18, the effective carrier density still increases with decreasing Na content, favoring a doped band insulator picture rather than a doped Mott insulator. We noticed that spectral increase for x below 0.5 becomes less as fast as it does for x0.5, however, there is no indication for a decrease of the spectral weight with further reducing Na content.
Another important feature is that all samples have two apparent interband transitions near 1.6 eV and 3.1 eV, except for the x=0.92 compound which shows roughly a single broad interband transition centered around 2.5 eV. This energy scale is in good agreement with the simple LDA calculation.Singh A naive interpretation for the two peak structure is that the low-energy peak is originated from the interband transition between the occupied Co t2g to unoccupied Co eg bands, while the high-energy one is due to the transition from occupied O 2p to Co eg bands.Johannes Unfortunately, the observed energy scales are much lower than the LDA band structure calculations. The interpretation also has the difficulty to explain the broad single interband transition peak observed for x=0.92 sample with the energy scale now in good agreement with the simple LDA calculations for transition between t2g and eg bands. In our previous work on Na0.7CoO2,Wang1 we interpreted both peaks near 1.6 eV and 3.1 eV as interband transitions from occupied t2g to empty eg bands by invoking an exchange splitting. The present results add support for this interpretation. Note that, as x approaches 1 (band insulator), the t2g band tends to be fully filled and eg band completely empty, the exchange splitting would disappear. In this case, a single interband transition from t2g to eg with energy scale close to the simple LDA band structure calculation is expected. The x=0.92 sample indeed follows this expectation.
III.2 Temperature-dependent optical response: mode coupling and gap-like structure
The temperature-dependent spectra are shown in figure 4. At room temperature, all samples show metallic behavior, indicated by the high reflectance at low frequency and a gradually decreasing behavior up to a reflectance edge. For each sample, the spectra of different temperatures cross at certain frequencies, indicating a spectral weight transfer between high and low energy region. The temperature dependences of the optical responses are also metallic except for those samples with high sodium contents at low temperature. For the x=0.85 and 0.92 samples, the reflectances below 250 cm-1 are clearly depressed at T=10 K, leading to a suppression of conductivity spectra. The optical result is consistent with the dc resistivity measurement showing an upturn below 20 K due to AF ordering formingLuo . The other one is the insulating charge-ordering sample x=0.48. Its spectra are very similar to our reported data on x=0.50 compoundWang2 showing characteristic spectral features: an opening of gap below 125 cm-1 together with the development of an electronic resonance peak near 800 cm-1, as seen clearly in Fig. 5.
The upper panels of figure 5 show the T-dependent spectra obtained from their reflectances by Kramers-Kroning transformations. The data on x=0.85 and 0.92 compounds are similar to our previous data on x=0.7 compound,Wang1 except that the present samples have lower values. The compounds with lower Na content 0.18x0.36 show metallic response and have apparently higher conductivity values. In the very far-infrared region, an unusual drop in is commonly observed for those samples, leading to a peak at finite energy (200 cm-1 ). This feature was addressed in our earlier work.Wang1 The most striking observation here is that for x=0.18, 0.32 and 0.36 samples, the spectra show distinct suppressions at low T below about 2200 cm-1 . Such suppression was usually taken as a signature of a pseudogap (PG) in spectra. We notice that this suppression structure is strongest for x=0.18 sample, becomes weaker with increasing Na content, and disappears completely when approaching the charge-ordered insulating phase near x=0.5, for which instead of a suppression we observe an pronounced electronic resonance peak near 800 cm-1 . However, at higher Na contents, the suppression feature appears again, but its peak position occurs at higher energy near 3300 cm-1 , which was previously labelled as the -peak.Wang1 .

Although the conductivity displays a gap-like suppression at low temperature, an integration of the conductivity up to 5000 cm-1 does not show a decrease of the spectral weight within our experimental uncertainty. The depression of the conductivity in the mid-infrared region is balanced out by the increase of conductivity at low frequency. Despite the presence of a peak at finite frequency, the low-frequency Drude-like conductivity shows a rapid narrowing with decreasing temperature. We emphasize that such spectral change resembles significantly to the hope-doped cuprates in the PG state, where no detectable SW loss was found in the ab-plane conductivity as well.Syro Understanding the low-frequency dynamics, including the rapid narrowing behavior of the low-frequency component and the PG-like suppression readily seen at low temperature, is our major focus in this paper.

It is well known that, for the case of metallic conduction in the ab-plane, the signature of a PG is best resolved in the spectrum of the -dependent scattering rate.Timusk The bottom panels of Fig. 5 show the 1/ spectra for above six samples obtained from the extended Drude modelPuchkov 1/= Re(1/, where is the overall plasma frequency and can be obtained by summarizing the up to the reflectance edge frequency. Related to the suppression in , we observe a strong suppression feature as well in 1/ at frequencies near 1300 cm-1 for x=0.180.36 samples. Compared with data at high temperature, the low-T spectra show weak ”overshoot” behaviors just above the suppression frequencies. We notice again that the spectral feature in 1/ is similar to that of high-Tc cupratesTimusk ; Puchkov and other materials with partially gaped Fermi surface (FS) like, for example, an antiferromagnet Cr for which a spin-density-wave gap opens in parts of the FSBasov1 . Note that the suppression in 1/ appears at lower frequency than that in spectra. This is a generic behavior for PG, and was discussed in our recent work on cuprate superconductors.Wang3 Another notable observation is that, different from samples with low Na contents, the x=0.85 and 0.92 samples display prominent peaks near 2000 cm-1 in 1/ spectra. This is because the free carrier contribution to the high- spectral weight is very low, which makes the gap or interband transition structures more pronounced. Here we show the 1/ spectra for all samples obtained by the same method, but we should bear in mind that the non-monotonous spectral shape implies a breakdown of the extended Drude mode for application to these compounds. We found again that the peak position in 1/ is much lower than the suppression energy in .
It should be pointed out that there is no simple and direct connection between the quantity or 1/ and the density of states (DOS). An exact relationship depends on model. Simply from the suppressions in or 1/ spectra, one cannot conclude the presence of a true gap structure in the DOS, because very similar spectral change can also be caused by a strong coupling effect of electrons with a bosonic mode. In the later case, the optical spectra would display strongly enhanced absorption above the mode energy, which leads to a sharp increase in the 1/. This result can be verified easily from famous Allen’s formula for the case of electron-phonon coupling at zero temperature,Allen = , by assuming a peak-like phonon spectral function of . The strong coupling effect of electrons with a collective mode was intensively studied in high-Tc cuprates.Carbotte ; Abanov ; Tu ; Wang4 ; Hwang2 The same effect was also suggested in earlier optical study on Na0.75CoO2 by Hwang et al.Hwang1 . From the analysis of the real and imaginary parts of the optical scattering rate (or the optical self-energy), they extracted an underlying bosonic mode with frequency near 600 cm-1 . Recent ARPES experiments on NaxCoO2 also reveal a mode coupling effect near 70-80 meV based on a self-energy analysis.Qian In the present work, we can identify from figure 5 that all samples, except the charge-ordered insulating one, exhibit a sharp increase structure at 500-600 cm-1 in 1/ spectra. The feature is strongest at lowest T, but becomes less prominent with increasing T. Furthermore, there is no shift in energy scale for samples with different x. Naturally, we can conclude that the mode is indeed present in all those samples and results in similar features in their optical spectra. We noticed that the phonons are in the right frequency range for the underlying mode.
A crucial issue is can we distinguish the effect resulted by a PG or a bosonic mode from those optical spectra? In other words, whether the above mentioned characteristic features in optical spectra are contributed by one of the two phenomena or by a combination of both that appear together? A critical analysis of the spectral shape provides a clue to this question. The key point is that the electron-boson coupling can only result in an increase in 1/ spectrum, it can never cause an overshoot or peak in 1/. Therefore, the observation of the overshoot behavior must have a different origin. This statement is further strengthened by the result of inverted bosonic spectral function, as we shall explain below.
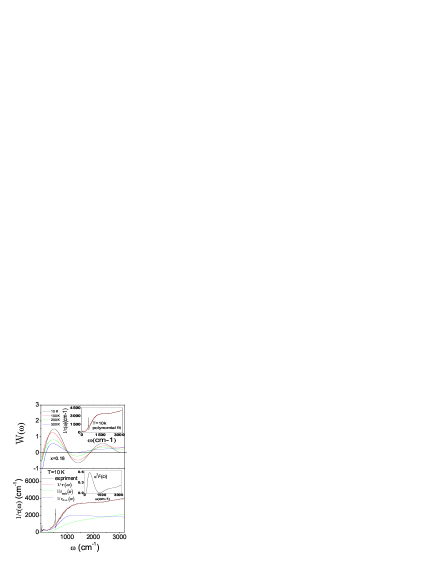
A simple way to extract the electron-Boson spectral function is to use the formula by Marsiglio et al.Marsiglio , = . Since the second derivative is used, heavy smoothing of the experimental data has to be done. In the present work, we first remove a phonon near 560 cm-1 in 1/, then fit the spectra with high-order polynomial. As all metallic samples have similar spectra, we only show the results for x=0.18 sample. Fig. 6(a) shows the spectral function obtained from the above formula. The inset shows the 1/ at 10 K together with the fitting curve with phonon removed. The most prominent feature in W() is a large maximum near 530 cm-1 and a deep negative minimum at 1300 cm-1 . Again the spectral function resembles significantly to the cuprate superconductors.Carbotte ; Abanov ; Tu ; Wang4 The large maximum corresponds to the sharp increase in 1/, while the negative minimum is linked with the weak overshoot. Since the electron-boson spectral density cannot be negative, the negative dip in W() could not originate from the electron-boson coupling.
In fact, earlier studies on a BCS superconductor have revealed a peak structure in scattering rate spectrum due to the presence of superconducting gap in the density of states (DOS).Basov1 ; Wang3 Obviously, if we perform second derivative, we would get a negative minimum in W(). Therefore, a gap (or pseudogap) in DOS can cause such negative structure in W. Taking account of those different effects, we can tentatively conclude that both the electron-boson coupling effect and the pseudogap-like phenomenon are likely present in NaxCoO2 .
It would be most desirable to quantitatively analyze the low-T 1/ for the case of electron-Boson coupling in the presence of a gap in DOS. Recently, several groups made such attempts to low-T 1/ of high-Tc cuprates.Dordevic ; Hwang3 In fact, Allen generalized the electron-phonon coupling formula at T=0 K for a BCS superconductor as, = , where E(x) is the second elliptic function.Allen Dordevic et al.Dordevic employed this formula to the data of YBCO, and found that it reproduced fairly well the low-T 1/ with the use of a finite value of the gap and a positive bosonic spectral function. More recently, Hwang et al.Hwang3 used a more generalized formula to the data of ortho-II YBCO. In their formula, the shape of the gap can be modelled flexibly. Although we found that those approaches can also reproduce well the low-T 1/ of NaxCoO2 , there is a strong reason against the application of those approaches here, for those formulae were derived based on the assumption that a superconducting gap opens below Tc. Furthermore, the impurity elastic scattering was ignored. Therefore, those approaches are valid only for superconductors at TTc in the clean limit. While in the case of NaxCoO2 , the samples we studied are not superconducting at all.
According to the band structure calculation on NaxCoO2 Singh , two bands, an a1g and one of the e bands, from Co t2g manifold cross the Fermi level (EF). They form a large hole Fermi surface (FS) centered at (by a1g) and six small Fermi pockets near the zone boundary (by e). The large FS was confirmed by the ARPES measurements, however, the six pockets were not observedHasan ; Yang . It deserves to point out that, unlike cuprate superconductors where partial states are really removed in FS near ”hot spots”, or a d-wave gap really exists at low T, ARPES experiments on all available metallic NaxCoO2 indicated no sign of gap opening on any part of the large FSHasan ; Yang ; Yang2 . This makes the gap-like suppression more puzzling in NaxCoO2 than in cuprates. One cannot conclude that the gap-like feature is related to the large FS.
One might link the PG feature to the missed small FS pockets. ARPES experiments indicated that the e pockets near K points sink down 200 meV below EF, and have almost no doping or T dependence.Yang2 Band structure calculation also indicates that the pocket band may not touch EF, if a proper on-site Coulomb repulsion U is considered.Zhang At the first glance, this energy scale seen by ARPES is very close to the suppression energy in 1/. However, because there exists no other band above EF at the same momentum in the reciprocal space where the pocket band sinks, no allowed optical interband transition from occupied e bands to others just above EF exists. This rules out the possibility.
We noticed that the interband transition from occupied e to unoccupied a1g bands in other momentums within t2g manifold are possible. This is actually one of explanations we suggested for the origin of the peak in ref.Wang1 . It appears to be the most likely interpretation for the origin. Indeed, we found that the optical scattering rate can be modelled by a formula containing a mid-infrared component, which could be naturally ascribed to such interband transition. To illustrate, we assume that the 1/ was contributed by a bosonic mode together with two other components (Drude+Lorentz): =+ where =, and = Re(1/) with = + . Indeed, we found that this expression can reproduce the data well with the following parameters =16500 cm-1 , =11180 cm-1 , =90 cm-1 , =26450 cm-1 , =2200 cm-1 , =6000 cm-1 , and a bosonic mode showing in the inset of Fig. 3(b). We emphasize that, in this approach, the bosonic mode is still necessary in order to give a continuous increase of scattering rate at high . The above analysis suggest that the PG feature could be purely a band structure effect. Recent calculation for based on band structure can indeed give a weak peak at low Johannes . Based on those results, we can conclude that both the mode coupling and interband transition contribute to the low temperature spectral feature in NaxCoO2 system. Furthermore, the band structure may experience a significant change when crossing the charge-ordered phase near x=0.5, since the energy scale in the suppression is substantially different.
III.3 Infrared phonon spectra
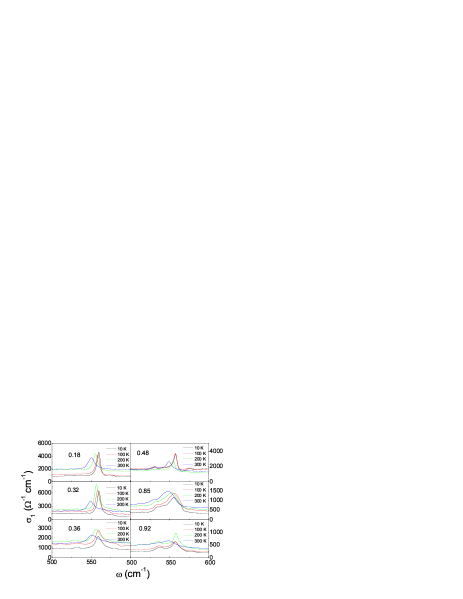
Fig. 7 shows the conductivity spectra in an expanded region where in-plane phonon modes are seen. For the three low sodium content samples (left panels), there is only one infrared-active phonon mode near 550 cm-1 at room temperature. With decreasing temperature down to 10K, the phonon mode narrows and shifts slightly to the high energy. For other three samples with higher sodium contents 0.48 (right panels), additional phonon mode near 530 cm-1 can be seen at room temperature, besides the one at 550 cm-1 . The mode near 530 becomes more eminent with increasing sodium content, and also shifts to higher frequency with decreasing temperature. In NaxCoO2, Na ions have two possible sites: one is underneath the Co atom (being referred to as A site), the other underneath the center of the triangle formed by three neighboring Co atoms (B site), leading to two kinds of structural geometries. The two Na sites cannot be simultaneously occupied in the same unit cell because of impossibly close Na1-Na2 distances. According to the symmetry analysis, four infrared active phonons (two for out-of-plane, two for in-plane vibrations) are predicted for structure with only one Na site occupation.Li The respective mode frequencies are different for the two different structural geometries. According to the calculation by Li et al.Li , the energy of phonon mode for geometry B is a little bit higher than that of geometry A. The observation of two in-plane phonon modes at room temperature, that are all close to the frequency of hard E1u mode, may indicate that both structural geometries are present in the sample. We also found that for the x=0.85 sample, two additional peak/shoulder features could be resolved at higher energy side of the two phonon modes at low temperature. The result is similar to our earlier study on x=0.7 sample.Wang1 The appearance of additional phonon modes might be due to a structural change at low temperature.
IV Summary
In summary, the single crystals of NaxCoO2 were prepared using floating zone method and characterized by x-ray diffraction and dc resistivity measurements. The in-plane optical measurements at different T on different x were measured. The vanishing spectral weight for x approaching 1 confirms the expected band insulator. The spectral weight is found to increase monotonically with decreasing Na content down to the lowest achieved x=0.18. The result suggests against a doped Mott insulator for the system even in the region where the compounds become superconducting after hydrated. For sample with the lowest Na content x0.18, the optical conductivity was strongly suppressed below 2200 cm-1 at low T. The suppression becomes weaker with increasing Na content, and disappears when approaching charge-ordered phase with x0.5, where an insulating gap below 125 cm-1 and an electronic resonance near 800 cm-1 develop at low temperature. After crossing the charge-ordering phase, similar suppression appears again but at higher energy scale near 3300 cm-1 . An partial sum rule analysis indicates that there is no apparent loss of spectral weight. Then, the low-frequency Drude-like component shows a rapid narrowing behavior, correspondingly a strong depression is seen in the optical scattering rate spectrum. The spectral features resemble significantly to the hole-doped cuprates at low temperature. Our analysis demonstrated that the optical spectra in those metallic samples were caused by a combination of the coupling effect of electrons with a Bosonic mode and a PG-like phenomenon. We suggest that the PG-like phenomenon is purely a band structure effect, and the interband transition within t2g manifold is responsible for the PG-like feature. The in-plane phonon modes were displayed and their evolution with x and temperature was discussed in relation with the structural geometries.
Acknowledgements.
We acknowledge discussions with H. Ding, T. Xiang, and G. M. Zhang, and Y. C. Ma. This work was supported by National Science Foundation of China, the Knowledge Innovation Project of Chinese Academy of Sciences, and the Ministry of Science and Technology of China 973 project No:2006CB601002).References
- (1) K. Takada, H. Sakurai, E. Takayama-Muromachi, F. Izumi, R. A. Dilanian, and T. Sasaki, Nature (London) 422, 53 (2003).
- (2) Maw Lin Foo, Yayu Wang, Satoshi Watauchi, H. W. Zandbergen, Tao He, R. J. Cava, and N. P. Ong, Phys. Rev. Lett. 92, 247001 (2004).
- (3) S. Lupi, M. Ortolani, and P. Calvani, Phys. Rev. B 69, 180506(R) (2004).
- (4) N. L. Wang, P. Zheng, D. Wu, Y. C. Ma, T. Xiang, R. Y. Jin, and D. Mandrus, Phys. Rev. Lett. 93, 237007 (2004).
- (5) C. Bernhard, A. V. Boris, N. N. Kovaleva, G. Khaliullin, A. V. Pimenov, Li Yu, D. P. Chen, C. T. Lin, and B. Keimer, Phys. Rev. Lett. 93, 167003 (2004).
- (6) G. Caimi, L. Degiorgi, H. Berger, N. Barisic, L. Forro, F. Bussy, Eur. Phys. J. B 40, 231 (2004) .
- (7) J. Hwang, J. Yang, T. Timusk, F.C. Chou, Phys. Rev. B 72, 024549 (2005).
- (8) N. L. Wang, Dong Wu, G. Li, X. H. Chen, C. H. Wang, and X. G. Luo, Phys. Rev. Lett. 93, 147403 (2004).
- (9) D. P. Chen, H. C. Chen, A. Maljuk, A. Kulakov, H. Zhang, P. Lemmens, and C. T. Lin, Phys. Rev. B 70, 024506 (2004).
- (10) J. L. Luo, N. L. Wang, G. T. Liu, D. Wu, X. N. Jing, F. Hu, and T. Xiang, Phys. Rev. Lett. 93, 187203 (2004).
- (11) L. M. Helme, A. T. Boothroyd, R. Coldea, D. Prabhakaran, D. A. Tennant, A. Hiess, and J. Kulda, Phys. Rev. Lett. 94, 157206 (2005).
- (12) D. J. Singh, Phys. Rev. B 61, 13397 (2000)
- (13) M. D. Johannes, I. I. Mazin, and D. J. Singh, Phys. Rev. B 71, 205103 (2005).
- (14) A. F. Santander-Syro, R. P. S. M. Lobo, N. Bontemps, Z. Konstantinovic, Z. Li, and H. Raffy, Phys. Rev. Lett. 88, 097005 (2002).
- (15) T. Timusk, Solid State Communications 127, 337 (2003).
- (16) A. V. Puchkov, D.N. Basov, and T. Timusk, J. Phys.: Condens. Matter 8, 10049 (1996).
- (17) D. N. Basov, E. J. Singley, and S. V. Dordevic, Phys. Rev. B. 65, 054516 (2002).
- (18) N. L. Wang, G. Li, Dong Wu, X. H. Chen, C. H. Wang, and H. Ding, cond-mat/0410242
- (19) P. B. Allen, Phys. Rev. B 3, 305 (1971).
- (20) J. P. Carbotte, E. Schachinger, and D. N. Basov, Nature (London) 401, 354 (1999).
- (21) Ar. Abanov, Andrey V. Chubukov, and Jorg Schmalian, Phys. Rev. B 63, 180510(R) (2001).
- (22) J. J. Tu, C. C. Homes, G. D. Gu, D. N. Basov, and M. Strongin, Phys. Rev. B 66, 144514 (2002).
- (23) N. L. Wang, P. Zheng, J. L. Luo, Z. J. Chen, S. L. Yan, L. Fang, and Y. C. Ma, Phys. Rev. B 68, 054516 (2003).
- (24) J. Hwang, T. Timusk, and G. D. Gu, Nature (London) 427, 714 (2004).
- (25) D. Qian, M. Z. Hasan, et al, private communications.
- (26) F. Marsiglio, T. Startseva, and J.P. Carbotte, Phys. Lett. A 245, 172 (1998).
- (27) S. V. Dordevic, C. C. Homes, J. J. Tu, T. Valla, M. Strongin, P. D. Johnson, G. D. Gu, and D. N. Basov , Phys. Rev. B 71, 104529 (2005).
- (28) J. Hwang, J. Yang, T. Timusk, S.G. Sharapov, J.P. Carbotte, D.A. Bonn, Ruixing Liang, and W.N. Hardy, cond-mat/0505302 (to be published in Phys. Rev. B)
- (29) M. Z. Hasan, Y.-D. Chuang, D. Qian, Y. W. Li, Y. Kong, A. Kuprin, A. V. Fedorov, R. Kimmerling, E. Rotenberg, K. Rossnagel, Z. Hussain, H. Koh, N. S. Rogado, M. L. Foo, and R. J. Cava, Phys. Rev. Lett. 92, 246402 (2004).
- (30) H.-B. Yang, S.-C. Wang, A. K. P. Sekharan, H. Matsui, S. Souma, T. Sato, T. Takahashi, T. Takeuchi, J. C. Campuzano, R. Jin, B. C. Sales, D. Mandrus, Z. Wang, and H. Ding, Phys. Rev. Lett. 92, 246403 (2004).
- (31) H.-B. Yang, Z.-H. Pan, A. K. P. Sekharan, T. Sato, S. Souma, T. Takahashi, R. Jin, B. C. Sales, D. Mandrus, A.V. Fedorov, Z. Wang, and H. Ding, Phys. Rev. Lett. 95, 146401 (2005).
- (32) Peihong Zhang, Weidong Luo, Marvin L. Cohen, and Steven G. Louie, Phys. Rev. Lett. 93, 236402 (2004).
- (33) Zhenyu Li, Jinlong Yang, J.G. Hou, and Qingshi Zhu, Phys. Rev. B 70, 144518 (2004).