molecular dynamics investigation of dislocation pinning by a nanovoid in copper
Abstract
Interactions between an edge dislocation and a void in copper are investigated by means of molecular dynamics simulation. The depinning stresses of the leading partial and of the trailing partial show qualitatively different behaviors. The depinning stress of the trailing partial increases logarithmically with the void radius, while that of the leading partial shows a crossover at nm above which two partials are simultaneously trapped by the void. The pinning angle, which characterizes the obstacle strength, approaches zero when the void radius exceeds nm. No temperature dependence is found in the critical stress and the critical angle. This is attributed to an absence of climb motion. The distance between the void center and a glide plane asymmetrically affects the pinning strength.
pacs:
61.80.Az, 62.20.Fe, 61.72.QqI introduction
Voids are ubiquitous in irradiated metals and act as obstacles to dislocation motion as well as other radiation-induced defects: e.g. stacking fault tetrahedra or helium bubbles. Those obstacles results in the increase of yield stress and therefore play an important role in irradiation hardening. To investigate the extent of hardening by those obstacles, there has been a model in which a dislocation is regarded as a continuous line with a constant line tension. This is referred to as the uniform line tension model. In the presence of obstacles, a dislocation is fixed to form a cusp at an obstacle. The pinning angle is defined as the angle between two tangent vectors at a cusp. (See FIG. 1). Then the restoring force to make a dislocation straight is written as , where denotes the line tension. We assume that a dislocation can penetrate an obstacle when the restoring force exceeds the critical value. Since is a constant, this condition is equivalent to , which we call the critical angle.
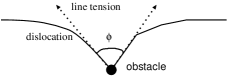
Note that stronger obstacles have smaller critical angles. A dislocation bows out to form an arc between two obstacles until the pinning angle reaches its critical value.
For a periodic array of obstacles whose spacing is , the critical resolved shear stress (CRSS) above which a dislocation can penetrate the array of obstacles is represented by
| (1) |
where denotes the Burgers vector length of the dislocation. (The line tension is given by the elastic theory and is often written as , where represents the shear modulus.)
In more realistic situations, obstacles are distributed randomly on glide planes and the randomness plays a crucial role in dislocation dynamics. In order to incorporate this effect, Foreman and Makin performed computer simulation of the dislocation motion on a glide plane with randomly distributed obstacles which have the same critical angle foreman . They found that the dislocation propagation has two qualitatively different modes depending on the critical angle. For obstacles of a small critical angle (i.e. strong obstacles), the dislocation propagation resembles dendritic growth cieplak , while for a large critical angle (i.e. weak obstacles) the global form does not significantly deviate from the straight line. Also are well described by note1
| (2) |
where denotes the inverse of the square root of the areal density of obstacles on a glide plane kocks .
In this context, the critical angle , which characterizes the obstacle strength, is an important parameter to discuss the extent of hardening. However, estimation of the critical angle is not an easy task, because it involves the core structure of dislocations. In this regard, extensive molecular dynamics (MD) simulations on the interaction between a dislocation and radiation-induced obstacles have been performed: e.g. stacking fault tetrahedra wirth , interstitial Frank loops rodney , voids and copper precipitates in bcc iron osetsky1 ; osetsky2 ; osetsky3 .
On the other hand, there are some experimental attempts to determine the critical angle utilizing transmission electron microscopy (TEM) robach ; nogiwa . They seem to be promising but still should be complemented by MD simulations in terms of the spatial resolution. For example, subnanometer obstacles cannot be seen by TEM.
In this paper, along the line of the above computational and experimental studies, we wish to estimate the critical angle and the critical stress regarding voids in copper. Especially, effects of the dissociation, temperature, and the distance from the void center to a glide plane are studied in detail. Note that we focus on an edge dislocation here. Results on a screw dislocation will be presented elsewhere.
This paper is organized as follows. In the section II, we introduce the computational model; fcc copper including an edge dislocation and a void. In the section III, the nature of the critical stress is investigated. Especially, void size dependence and the temperature dependence is discussed. The section IV deals with the critical angle, which is often measured by experiments (mainly TEM observation) to determine the obstacle strength. The discussion enables us to compare the MD simulation with the experiments. In the section V, effects of the distance between the void center and a glide plane are investigated. In the section VI, we discuss pinning strength of deformed voids in the context of dislocation channeling and plastic flow localization. The last section VII is devoted to discussions and conclusions.
II the model
II.1 the geometry
We treat fcc copper in this paper. As for the interatomic potential, we adopt the embedded-atom method of Finnis-Sinclair type finnis and choose the parameters according to Ackland et al. ackland . The lattice constant Å.
The schematic of our system is shown in FIG. 2.
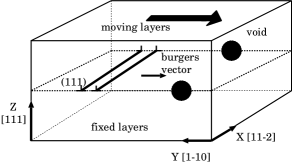
The , , and axes are taken as the , , and directions, respectively. The length of each dimension is nm, nm, and nm. Periodic boundary conditions are employed in the and the directions. That is, we consider dislocations of infinite length in the direction are periodically located in the direction.
Note that we have the surface only in the direction, both for and for . Following osetsky4 , three atomic layers of next to the lowest surface ( are ”the fixed layers” where velocities of the atoms always vanish. Similarly, three atomic layers of next to the upper surface ( are ”the moving layers” where velocities of the atoms are not given by the integration of force acting on them, but are given as a constant to cause the shear stress. Namely, the strain rate is the control parameter: not the shear stress. The moving surface moves to the direction: i.e. .
In order to introduce a void, atoms whose barycentric positions are in the spherical region are removed, where denotes the radius of the void. To introduce an edge dislocation, atoms that belong to one half plane () are removed and the rest of atoms are displaced by the strain field calculated from the elastic theory. This procedure produces a perfect edge dislocation whose Burgers vector is . However, a perfect dislocation in an fcc crystal is energetically unstable to split into two partial dislocations whose Burgers vector length is Å.
| (3) |
Since we wish to prepare two partial dislocations and a void in an initial system, atoms are suitably shifted from the original position by the steepest descent method in order to realize the dissociation. In addition, since our system consists of the periodic array of dislocations due to the periodic boundary conditions in the direction, this procedure also incorporates the excess strain field caused by the next dislocations. After certain time steps, the perfect dislocation dissociates to yield two partial dislocations separated by approximately nm.
Temperature is fixed to be K in this paper, except for the section III.3 where the temperature effect on the CRSS is investigated. Velocities of atoms are given by random numbers which obey the Maxwell-Boltzmann distribution. After a relatively short time required for phonon relaxation, ”the moving layer”, which is explained above, begins to displace to cause strain.
II.2 the strain rate
The strain rate is an important parameter in MD simulations of dislocations. In this paper, we set []. Although it seems still unrealistically fast deformation, the strain rate in MD simulation should not be directly compared with the macroscopic (or experimental) strain rate because the macroscopic strain rate involves only the average dislocation velocity. Namely, both spatial and temporal fluctuations in dislocation velocity are neglected. The complete correspondence of microscopic dislocation velocity to the macroscopic strain rate is not clear at all unless we know the statistical property of space-time fluctuation in dislocation motion.
Calculation of the shear stress is noteworthy. We define the shear stress as the forces in the direction acting on the unit area of the moving layers and the fixed layers. However, this microscopic definition of the shear stress shows a large thermal fluctuation. In addition, the inertial motion of the dislocation due to the high strain rate may enable depinning at lower stress osetsky1 . In order to reduce these effects, simulation is performed twofold. Namely, the representative point in the phase space (spanned by the positions and the momenta of all atoms) are recorded every ps. We then take the point where depinning just begins and restart the simulation with . In this relaxation process, the inertial effect is ruled out and the thermal fluctuation in the shear stress is averaged out. Taking this relaxation process into account, the average strain rate becomes approximately [1/sec].
III Behaviors of the critical resolved shear stress
III.1 temporal behavior
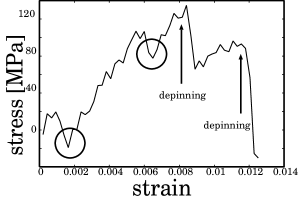
First, we track the time evolution. Under the shear stress caused by the boundary condition, two partial dislocations glide towards the direction: the direction. The Burgers vectors of the leading and the trailing partials are and , respectively. Snapshots of a pinning-depinning process are shown in FIG. 3.

Note that there are two depinning processes of the leading and the trailing partials. In the stress-strain relation (FIG. 4), we can see two peaks which correspond to the each depinning process. We remark that the critical stress for the leading partial is always larger than that of the trailing partial. This is because the leading partial has already escaped from the void and keeps gliding while the trailing partial is pinned by the void. Then the width of the stacking fault ribbon extends to yield attractive force between the partials. Namely, depinning of the trailing partial is assisted by the attractive force from the leading partial. Also, note that the movement of the leading partial leads to the stress relaxation, which appears in the change of modulus in the stress-strain curve in FIG. 4. That is, the modulus is GPa when the leading partial is pinned (), whereas the one after the leading partial is unpinned () is GPa.
III.2 void size dependence
Then the critical stress is calculated for various voids of different radii (from to nm). We measure the depinning stresses both for the leading partial and for the trailing partial. An interesting feature arises from the comparison of the both stresses, which are shown in FIG. 5. We can see that they have different tendencies with respect to the void radius . The depinning stress of the trailing partial shows the well-known logarithmic dependence, while that of the leading partial (i.e. the yield stress) shows a crossover around nm. We will discuss the difference more quantitatively in this subsection.
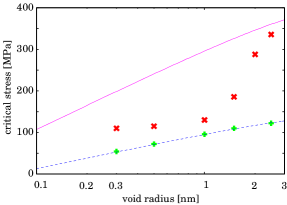
The depinning stress of the trailing partial can be described by the following relation.
| (4) |
where and denote arbitrary constants. The best fit is realized by letting MPa and nm. Note that this logarithmic dependence has also been found in a continuous model by Scattergood and Bacon scattergood , and also in the context of the Orowan mechanism bacon . Since their computation deals with only the critical stresses for pure edge dislocations and screw dislocations, it does not quantitatively apply to the partial dislocations. At least, it can describe the qualitative behavior regarding the trailing partial.
On the other hand, the crossover of the yield stress cannot be explained in the above context. It seems to be describable by piecewise logarithmic behavior;
| (5) |
Note that the extent of hardening becomes much greater when the void radius exceeds nm. Although we cannot show the definite explanation of this phenomenon, a plausible reason lies in the interaction between two partials. When the void radius is larger than nm, the two partials are simultaneously trapped by the void. Then the depinning of the leading partial may be significantly affected by the trailing partial, since the distance between them is very close near the void (a few Burgers vectors). Note that, for nm and nm, depinning of the leading partial takes place before the trapping of the trailing partial; i.e. the depinning of the leading partial is less affected by the trailing partial. We also remark that a similar crossover due to the interaction between dislocations is observed in the critical stress of dislocation nucleation on the void surface hatano .
Regardless of the void radius, the depinning of the trailing partial takes place when the leading partial is completely escaped from the void. Although the trailing partial interacts with the leading partial via stacking fault ribbon and the elastic strain, it is not as strong as the one in the depinning process of the leading partial. Therefore, it is reasonable that the unpinning stress for the trailing partial can be described in the framework of scattergood where a single dislocation involves.
On the other hand, the yield stress for an edge dislocation should be interpreted as the maximum stress during the whole pinning process including two partials: that is, the critical stress for the leading partial. It is interesting to compare the yield stress in the present simulation and the one in scattergood in which the dissociation is not taken into account. The yield stress estimated by Scattergood and Bacon reads
| (6) |
which is also plotted in FIG. 5. We can see that Eq. (6) considerably overestimates the yield stress where nm. Since it does apply to bcc iron osetsky1 ; osetsky2 ; osetsky3 , we can conclude that the dissociation makes depinning easier.
III.3 temperature dependence
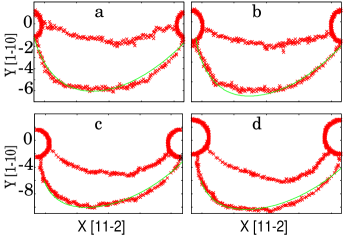
In this section we investigate temperature dependence of the critical stress. We have calculated the critical stress for four different temperatures: K, K, K, and K. However, we cannot find any differences regarding the critical stress between these calculations. In FIG. 6 we show the snapshots of dislocations just before depinning where the temperatures are K and K, respectively. We can see no difference in the dislocation shape. Also, the critical stress is almost the same: MPa for nm and MPa for nm. Namely, temperature plays no role in depinning processes.
Note that this result is opposite to the simulation on bcc iron with a copper precipitate osetsky3 . There, definite temperature dependence was observed from K to K. The reason for the difference lies in the dissociation nature of dislocation. In bcc iron where a dislocation does not dissociate, a perfect dislocation absorbs vacancies from a void (or the precipitate surface) and undergoes climb motion. The climb motion is remarkable for larger voids where temperature dependence of the critical depinning stress is observed. Note that smaller voids show less temperature dependence and the climb motion is weak there. It implies that the climb motion is essential to the temperature dependence. On the other hand, no climb motion is observed in the present simulation. It is known that the climb motion is difficult in fcc crystals since dislocations dissociate. Therefore, no temperature dependence is observed in the present simulation on fcc copper.
Another possible reason lies in the activation energy for depinning. Although the precise estimation of the activation energy is difficult, it is at least larger than the energy of a dislocation whose length is equivalent to the void diameter. (We neglect the step formation energy on the void surface.) Dislocation energy is calculated by the line tension multiplied by the length. The effective line tension is estimated to be nN by Eq. (12). (Please see the next section for the detail.) Therefore, for the void of nm radius, the activation energy is approximately estimated as J. It is equivalent to , where denotes the Boltzmann constant and K. Since this is much larger than the thermal energy of involved atoms on the void surface (less than a hundred), it is plausible that thermal fluctuations cannot assist dislocation depinning. In addition, please recall that the step formation energy is neglected and the actual value may be larger than that. However, in the case of precipitates, the number of involving atoms is larger than in voids. That may be another reason for the difference between the present simulation and the one of osetsky3 .
IV The dislocation shape and the critical angle
IV.1 an orientation dependent line tension model
As can be seen in FIG. 3, the bowing dislocation is asymmetric with respect to . Since the uniform line tension model predicts the symmetric form (an arc), we have to incorporate an orientation dependent line tension in order to explain the asymmetric dislocation shape. Indeed, de Wit and Koehler dewit obtained a solution for the dislocation shape.
| (7) | |||||
| (8) |
where denotes the angle between the tangent line of a dislocation and the axis. An orientation dependent line tension is denoted by , in which represents the angle between the tangent line of the dislocation and the Burgers vector. If the concrete form of is given, these equations can be numerically solved with an appropriate choice of the arbitrary constants and . Here, is given as dewit
| (9) | |||||
| (10) |
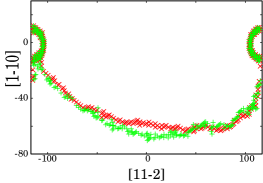
where is the (arbitrary) core cutoff length. In FIG. 7, Eqs. (9) and (10) are fitted with the simulation result. We can see that the fittings are quite satisfactory.
IV.2 determination of the critical angle
In macroscopic materials, random configuration of obstacles plays an important role in the dislocation dynamics, as was discussed in the section I. In order to apply Eq. (2) to a practical situation, we wish to estimate the critical angle from the simulation. Note that the critical angle is defined by the angle between two tangent lines of the dislocation at the void surface. Because the critical angles are slightly different for two partial dislocations, we measure the both.
The pinning strength with respect to the void radius is shown in FIG. 8.
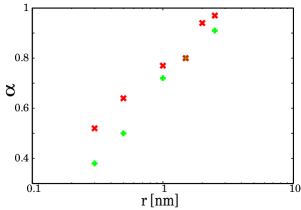
We remark that the pinning strength again obeys a logarithmic law.
| (11) |
The constants are and for the leading partial, and and for the trailing partial. By extrapolation, reaches when the void radius exceeds nm, as shown in FIG. 8. Note that the tendency has also been observed in the previous simulations on bcc iron osetsky1 ; osetsky2 ; osetsky3 .
Meanwhile, it should be remarked that a crossover is not observed in the pinning strength . From Eq. (1), the crossover of should be attributed to that of , which can be written as
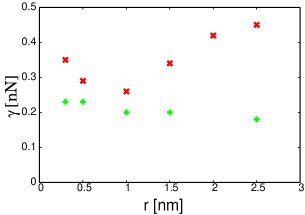
| (12) |
The calculated line tensions are shown in FIG. 9, in which the line tension of the leading partial shows the minimum at nm while that of the trailing partial monotonically decreases. The explanation for the decrease lies in the deformations (i.e. bowouts) of dislocations. As the void gets larger from , the extent of bowout becomes greater. This results in the prevalence of the screw component, since the partial dislocation is initially edge-like. The deformation lowers the effective line tension: i.e. the energy per unit length. (However, the total energy increases due to the elongation.) The above mechanism also explains the decrease of the line tension of the leading partial for nm.
On the other hand, the increase of the line tension of the leading partial for nm results from the interaction with the trailing partial. For larger voids, the trailing partial is also pinned by the void and bends during the depinning process of the leading partial, as can be seen in FIG. 7. That effectively increases the line tension of the leading partial.
V effects of the impact parameter
So far, we have limited ourselves to the situation where a dislocation penetrates the void center. This is rather a special case, because the relative position of a void to a glide plane may be arbitrary. In this section, we change the distance between the void center and a glide plane. We call the distance ”the impact parameter”, which is denoted by . (See FIG. 10.)
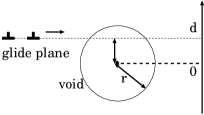
The pinning strength is determined for the various impact parameters. The result is shown in FIG. 11, which shows asymmetric dependence of on . Note that the dislocation is pinned even when it is not in contact with the void. It implies that, as well as the core energy, the elastic strain around the dislocation plays an important role in pinning processes. In addition, the asymmetry regarding comes from the nature of strain field around an edge dislocation: i.e. existence of hydrostatic pressure caused by the extra atomic plane. Especially, the fact that pinning strength for becomes considerably weak suggests that the hydrostatic pressure is dominant over the shear stress.
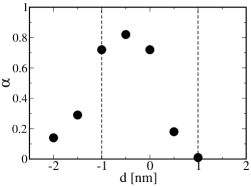
Also, we remark that strong pinning () occurs only where : i.e. the lower half of the void. This area accounts for approximately or percent of the whole pinning region, while the rest involves relatively weak pinning. The large variance of the pinning strength distribution for a single void suggests the reconsideration of the same pinning strength assumption in dislocation dynamics simulations. In the section VII, we discuss how to incorporate this effect into the estimation of the CRSS in the framework of Eq. (2).
VI effects of void deformation after the passage of several dislocations
When a void is sheared by a dislocation, two parts which are divided by the glide plane are displaced to each other by the Burgers vector. After the passages of several dislocations, it may collapse and lose the pinning ability. For example, collapse of stacking fault tetrahedra by the passage of dislocations is both experimentally matsukawa and computationally wirth observed. This phenomenon is believed to be responsible for the formation of dislocation channel and the localization of plastic flow, which recently invokes attention including some computational studies delarubia . In this section, effects of the void deformation on pinning strength are discussed based on the motivation described above.
We remark that another possible mechanism of the void deformation is vacancy absorption by (and the climb motion of) an edge dislocation, as was discussed in the section III.3. However, no climb motion was seen in our simulations, because the climb is difficult in fcc metals due to its dissociation. Hence, we do not consider the void contraction by the vacancy emission to dislocations. We concentrate on the effect of the relative deformation with respect to a glide plane.
We prepare the deformed void as shown in FIG. 12. First we prepare a spherical void. Then, instead of iterating the pinning simulations, atoms located above the glide plane are displaced by the Burgers vector . Iterating this procedure for times is equivalent to the passage of edge dislocations.
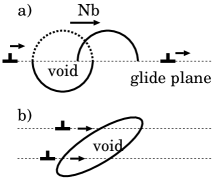
We set two configurations. In the case (a), the glide plane on which the dislocations move is assumed to be at the void center, whereas glide planes are uniformly distributed in the case (b).
In the case (a), we set and . Namely, the void is assumed to be penetrated by dislocations on the same glide plane times or times. The pinning strength is found to be for the both cases, which is almost the same value with the one for the spherical void. This is consistent with the result obtained in the last section that the upper part of the void is dominant in pinning of edge dislocations because of the hydrostatic pressure. In the case (b), we test and cannot find any difference from the non-deformed case regarding the critical angle. Thus, as far as the vacancy absorption mechanism (i.e. climb) is absent, the pinning strength is not seriously altered by the passage of dislocations.
VII discussions and concluding remarks
VII.1 practical applications
Let us estimate the yield stress of copper in which voids are randomly distributed. First, we determine the average spacing between obstacles on a glide plane. The areal density is represented as , where denotes the number density of voids per unit volume. Then the average spacing on a glide plane is written as . Since the expression includes all voids which intersects a glide plane, their impact parameters are randomly distributed from to . Since we have seen that the pinning strength considerably changes with the impact parameter in the section V, we wish to incorporate this result. However, there is no simulation which considers this effect at this point. Therefore, we have to resort a rough approximation here.
From FIG. 11, strong pinning () occurs only where . We neglect the rest. Namely, it is assumed that only this region is responsible for pinning. We use instead of the diameter ; then . We can rewrite Eq. (2) as
| (13) |
where the line tension should be interpreted as the effective one that is determined by the present simulation, FIG. 9.
For example, an irradiated copper specimen includes voids whose average diameter nm, and the number density is nita . From the present simulation, the line tension and the pinning strength are estimated as nN and , respectively. The effective areal density is then calculated as (i.e. the average spacing is nm). This yields MPa, which is quite a reasonable value. In order to give more precise predictions, Eq. (2) should be modified to include the effects of the impact parameter and the orientation dependent line tension.
VII.2 comparison with a continuous model with self-interaction
Scattergood et al. have presented the calculation on the dislocation pinning by a void based on the framework of Bacon et al. bacon . It is a continuous model that incorporates the self-interaction of a dislocation. Since their system also consists of the periodic array of voids, we wish to compare their result to ours.
Let us briefly review their discussion. They have speculated that depinning concerns the line tension near the pinning point, where a dislocation forms a dipole. Since a dislocation rotates by almost there, we regard the effective line tension as that of its counterpart. For example, as for an edge dislocation, the effective line tension upon depinning is that of a screw dislocation. Then the depinning stress for an edge dislocation is expressed by
| (14) | |||||
| (15) | |||||
| (16) |
where should be interpreted as the effective outer cutoff divided by the core cutoff. Note that itself is not the core cutoff but an unknown function of the core cutoff. The above equations yield Eq. (6).
Their discussion can be extended to dislocations of arbitrary orientation.
| (17) |
where and denote Poisson’s ratio and the angle between the dislocation line and the Burgers vector, respectively. In the present case, substituting (for the partials) into Eq. (17) yields [MPa]. Recall that Eq. (17) is an expression for the resolved shear stress with respect to the Burgers vector of a partial dislocation. It is equivalent to [MPa] with respect to the Burgers vector of an original perfect dislocation. Indeed, it shows an excellent agreement with the critical stress of the trailing partial.
However, the problem is the arbitrary parameter . This arbitrariness may vanish if we can calculate the deformed (curved) effect on the dislocation energy, although it is a very complicated problem. At least, we confirm that the extended form of the proportional constant Eq. (17) agrees with the present simulation, if there is no strong interaction between the partials.
VII.3 conclusion
We calculated the critical stress and the critical pinning angle for the interaction between an edge dislocation and a void in fcc copper. Dissociation of a dislocation plays an important role in the behaviors of the critical stress: i) It is much lower than the estimation of Scattergood and Bacon, which does not consider dissociation. ii) It suddenly increases at a certain void radius where two partials can be simultaneously trapped. iii) The depinning stress of the trailing partial does agree with that of Scattergood and Bacon, since the leading partial moves far from the void.
We also found that there is no temperature dependence in the critical stress and the pinning angle. This is opposite to the previous simulation on bcc iron osetsky1 ; osetsky2 ; osetsky3 . The difference comes from the presence (in bcc) or the absence (in fcc) of climb motion.
The pinning strength obeys the empirical logarithmic law which has been found in scattergood ; bacon . The distance between the void center and the glide plane (the impact parameter) is found to affect the pinning strength in asymmetric manner. This is due to the hydrostatic pressure around an edge dislocation. Hence, it is interesting to compare the result with that of a screw dislocation, which is a work in progress.
The impact parameter dependence of the critical angle also suggests the importance of randomness in the pinning strength. Even if the system contains voids of the same radius, the cross section on a glide plane is randomly distributed. Hence we have to incorporate the randomness in the pinning strength. It is not straightforward to deduce this effect from the existing simulations which treats only two kinds of obstacles foreman2 . Investigation of a continuous model with random pinning angles will be interesting to see how the impact parameter dependence affects the macroscopic dislocation motion.
Acknowledgements.
The authors gratefully acknowledge Nobuyasu Nita for useful discussions regarding experimental situations. They also thank Yuhki Satoh and Hideo Kaburaki for discussions and valuable comments.References
- (1) A. J. E. Foreman and M. J. Makin, Phil. Mag. (1966).
- (2) The existence of the two modes in one-dimensional surface propagation was rediscovered by Cieplak and Robbins in the context of fluid invasion in porous media. M. Cieplak and M. O. Robbins, Phys. Rev. B 41, 11508 (1990); Phys. Rev. Lett. 60, 2042 (1988).
- (3) The validity of the definition of critical resolved shear stress in the dendritic-growth mode is questionable because of the considerable inhomogeneity of plastic flow. In addition, the self-interaction can no longer be negligible there.
- (4) U. F. Kocks, Can. J. Phys. 45, 737 (1967).
- (5) B. D. Wirth, V. V. Bulatov, and T. Diaz de la Rubia, J. Eng. Mater. Tech. 124, 329 (2002).
- (6) D. Rodney and G. Martin, Phys. Rev. Lett. 82, 3272 (1999); D. Rodney, Acta Mater. 52, 607 (2004).
- (7) Yu. N. Osetsky and D. J. Bacon, J. Nucl. Mater. 323, 268 (2003).
- (8) Yu. N. Osetsky, D. J. Bacon, and V. Mohles, Phil. Mag. 83, 3623 (2003).
- (9) D. J. Bacon and Yu. N. Osetsky, J. Nucl. Mater. 329-333, 1233 (2004).
- (10) J. S. Robach, I. M. Robertson, B. D. Wirth, and A Arsenlis, Phil. Mag. 83, 955 (2003).
- (11) K. Nogiwa, T. Yamamoto, K. Fukumoto, H. Matsui, Y. Nagai, K. Yubuta and M.Hasegawa, J. Nucl. Mater 307-311, 946 (2002).
- (12) M. W. Finnis and J. E. Sinclair, Phil. Mag. A 50, 45 (1984).
- (13) G. J. Ackland, D. J. Bacon, A. F. Calder, and T. Harry, Phil. Mag. A 75, 713 (1997).
- (14) Yu. N. Osetsky and D. J. Bacon, Modell. Simul. Mater. Sci. Eng. 11, 427 (2003).
- (15) R. O. Scattergood and D. J. Bacon, Acta Metall. 30, 1665 (1982).
- (16) D. J. Bacon, U. F. Kocks, and R. O. Scattergood, Phil. Mag. 28, 1241 (1973).
- (17) T. Hatano, Phys. Rev. Lett. 93, 085501 (2004).
- (18) G. de Wit and J. S. Koehler, Phys. Rev. 116, 1113 (1959).
- (19) T. D. de la Rubia, H. M. Zbib, T. A. Khraishi, B. D. Wirth, M. Victoria, and M. J. Caturla, Nature 406, 871 (2000).
- (20) Y. Matsukawa and S. J. Zinkle, J. Nucl. Mater. 329-333, 919 (2004).
- (21) N. Nita, unpublished data (2004).
- (22) A. J. E. Foreman and M. J. Makin, Can. J. Phys. 45, 511 (1967).