Direct Measurement of Spatial Distortions of Charge Density Waves in K0.3MoO3
Abstract
Using X-ray scattering and the technique of multiple diffreactions, we revisit the dynamical transition of charge density waves (CDWs) in K0.3MoO3 under applied voltages. In addition to the usual transport and half width (of Bragg peaks) measurements, we also measure the triplet phase by three-wave diffraction, which provides, for the first time, the direct evidence for the spatial distortions of CDWs. This novel and sensitive technique developed here can be applied to general periodic media, including stripes in high temperature superconductors, and provide a new perspective into interesting phenomena in these materials.
pacs:
71.45.Lr, 72.15.Nj, 74.25.QtThe homogeneous phases in low dimensional materials, such as K0.3MoO3, NbSe3 and TMTSF molecules, undergo a phase transition to charge density waves (CDWs) at low temperatures. The instability toward spontaneous formation of charge-density modulations is driven by electron-phonon interactions, or sometimes electron-electron ones Overhauser78 . Among many other interesting aspects of CDW, transport property in the presence of finite driving electric field has attracted lots of attentions from both experimental and theoretical sides. It is generally believed that the current is suppressed at small biased voltage, where the CDW is pinned by impurity potential. Above some threshold voltage, the sliding motion along the applied electric field starts and the current increases significantly. It has been known that this dynamic behaviour involves the phase slippage of the density waves. In fact, similar phenomena occurs in many other systems, such as moving vortex lattice Yaron95 , Wigner crystal Andrei88 , charge/spin stripes in CMR, high-TC superconductors Yaron95 ; Xiao01 and La2-xSrxNiO4 Littlewood95 ; Du00 , colloids Murray90 , magnetic bubbles Seshadri92 and so on.
We revisit this well-studied transition in this Letter, attempting to measure the distortions of CDW in pinned and sliding phases directly. In previous studies, the sliding transition is spotted by sudden jump in characteristics at low temperatures Ogawa01 and/or the half-width change of the Bragg peaks Danncau02 . Theoretical investigations Giamarchi95 ; Balents98 predicted that the pinning forces become irrelevant when the system enters the sliding phase. This indeed provides a natural explanation for the dynamical narrowing of the half width above the threshold voltage. However, to understand how the CDW adjusts to the pinning forces at different driving voltages, a direct measurement for the spatial distortions of CDW is desirable. In this Letter, in addition to the usual transport and FWHM (full width at half maximum) measurement of the CDW satellite reflections, we first establish the connection between the lattice distortions and the triplet phase in X-ray scattering and thus demonstrate how the spatial distortions of CDW can be measured directly. While the sliding transition is already well studied, the technique we developed here can be applied to general periodic media driven by external sources and provides a new perspective into many interesting strongly correlated systems.
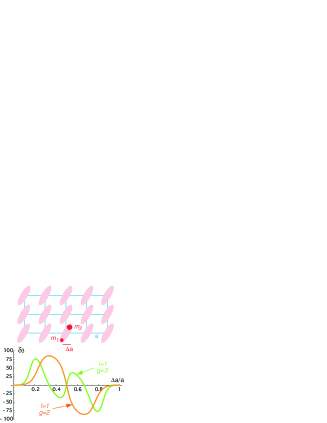
Since the triplet phase plays an essential role in our study, it is helpful to illustrate its physical meaning and connections to lattice distortions first. The triplet phase is defined as the phase of the structure factor triplet , where are reciprocal lattice vectors, satisfying . Chang04 ; Colella74 ; Shen98 . Since they form a closed triangle in the reciprocal vector space, it is straightforward to show that the triplet phase is invariant under arbitrary choices of unit cells Giaco02 . This invariance provides a hint for its connection to some physical quantity, which turns out to be the internal distortion of the unit cell. Experimentally, this triplet phase can be determined by measuring the diffracted intensity profiles of a three-wave diffraction involving the primary , the secondary , and the coupling reflections, where stands for the direct reflection of the incident beam Chang04 . Let’s consider a two-dimensional square lattice with two ions in one unit cell, as shown in Fig. 1. Without distortion , the lattice has inversion symmetry which ensures all structure factors are real (under appropriate choice of the unit cell) and thus gives . Under the driven voltage, the CDW is distorted and twists the underlying lattice as well. For simplicity, let’s assume that it can be described by a lattice twist along direction of CDW (-axis here). Furthermore, let’s choose the reciprocal lattice vectors to be along the direction of CDW, i.e. , and . The resultant triplet phase can be computed straightforwardly,
| (1) |
where and . The other parameters are and . Two particular choices of and are given in Fig. 1 to demonstrate the connection between the triplet phase and the lattice distortion .
In realistic setup, the lattice distortion is rather small at all applied voltages, thus the expression of the triplet phase simplifies, . Note that the cubic dependence is generic due to the inversion symmetry of the undistorted lattice and the close triangle formed by . While this result is derived from the simple model, it captures the generic dependence of the triplet phase even for the more complicated crystal K0.3MoO3 we studied here. Therefore, the triplet phase provides a direct measurement of the spatial distortions of CDWs at different driving voltages.
Now we turn to the experimental details and the observed results of transport and X-ray measurements. A single crystal K0.3MoO3 of good quality was prepared for the transport measurement and X-ray scattering. The crystal structure belongs to the monoclinic with the space group C2/m. The lattice parameters of K0.3MoO3 are Å, Å, Å, and = 117.393∘ Schutte93 . The sample, with transition temperature around 180 K, was characterized with a mosaic width of 0.005∘ and pre-aligned using an X-ray rotating anode source so that the scattering plane coincided with plane. The in-situ measurements were carried out on the Taiwan beamline BL12B2 of SPring-8 synchrotron facility. The incident x-ray wavelength was selected to be 1Å. Two gold stripes spaced about 3 mm were evaporated onto the sample surface as shown in the inset of Fig. 2. The sample was then glued on the cold head of a cryostat mounted on a 6-circle diffractometer. To drive current through the sample, the voltage was applied along axis ([010] direction). A Keithely 2400 source meter was used to generate the driving voltage, and the curve was measured by the two-probe setup. An upper limit of the current was set to 300 mA in order to protect the sample and meter.
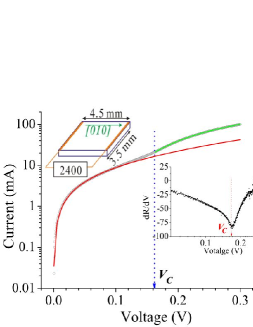
Fig. 2 shows the non-linear conductivity of the sample at T = 70 K, indicating the dynamical transition from the pinned CDWs to sliding motions. While the nonlinearity is not as robust as at low temperatures, the current below the critical voltage V can be fitted remarkably well with the prediction from thermal creep Ogawa01 ; Chauve00 ; Marchetti03 ; Fisher83 ; Chen96 ,
| (2) |
The parameters , and are constants at all applied voltages. To make the critical transition more transparent, one can plot (as shown in the inset of Fig. 2), which show clear singularity near the critical voltage . The nice fit with the thermal creep behavior indicates that our two-probe measurement does not suffer poor contacts or serious current inhomogeneity in the sample. One may notice that there is no switching phenomena in our measured curve due to thermal fluctuations at K Vinokur97 ; Adelman93 .
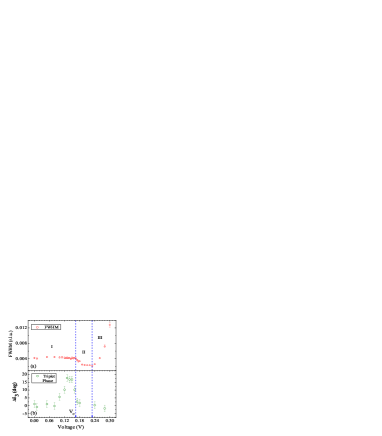
In addition to the transport measurement, the evolution of CDW satellite reflections as a function of applied fields was also probed using X-ray scattering. The width of the CDW peak and triplet phase at different driving voltages are summarized in Fig. 3. In this Letter, we focus on the particular satellite reflection, located at = (13 -6.5) with . Scans were performed along the longitudinal direction of [2 0 -1] and the data were convoluted with resolution function obtained from nearby Bragg peak (12 0 -6). The FWHM of the primary reflection in Fig. 3(a) remains more or less unchanged below the critical voltage V, determined from the transport measurement. Above the critical voltage, where the CDW enters the sliding phase, the FWHM decreasesKoshelev94 ; Reichhardt03 as predicted by previous theoretical investigationsKoshelev94 . This interesting dynamical narrowing of half width is a strong indication that the pinning forces due to random potentials become irrelevant (or less efficient) when the CDW starts to slideChen96 ; Lemay99 ; Danncau02 . In fact, similar motion-induced ordering behavior by external driving force has been reported in NbSe Danncau02 . When the voltage goes beyond 0.22 V, other effects from non-equilibrium dynamics and amplitude fluctuations become important and the Bragg peaks disappear. This is clearly evidenced by the sharp increase of FWHM in Fig 3(a) and diminishing amplitude of the corresponding Bragg peak (not shown here).
Now we come to the central quantity we studied in this Letter – the triplet phase of the 3-wave multiple diffraction at different biased voltages. To set up a 3-wave multiple diffraction experiment, where stands for the direct incident reflection, the crystal is first aligned for a primary reflection . It is then rotated around the reciprocal lattice vector with an azimuthal angle to bring in the secondary reflection which also satisfies Bragg’s law. Namely, both and reflections take place simultaneously. The interaction of the multiply diffracted waves modifies the intensity of the primary reflection. Intensity variation showing asymmetric distribution versus , giving the information about the triplet phase of the three-wave structure factor Chang04 ; Colella74 ; Shen98 . Previously Du04 , we showed how the triplet phase can be probed using multiple diffraction. Here we further demonstrate that measuring the change of the triplet phase allows us to make direct observation of the internal deformations of the CDWs/lattice at different driving voltages.
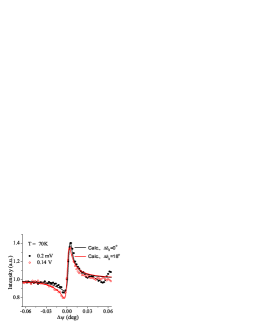
The origin of azimuthal angle (=0) was determined to be the direction where [1 0 0] lay on the scattering plane. This can be verified by finding a mirror position in the multiple diffraction pattern of the primary reflection (6 0 -3). Through the azimuthal scan around the primary reflection = (13 -6.5) at = 70 K, we obtained three-wave diffraction pattern containing lots of multiple diffraction peaksLo04 . In this Letter, we concentrated only on the particular three-wave diffraction, = (13 -6.5) and = (4 -8 4) at =108.53∘. Note that the coupling reflection is = (9 +8 -10.5). The profile asymmetry of the diffraction intensity of versus at V= 0 is typical because the triplet phase due to the centrosymmetry of the undistorted lattice. Upon application of driving voltage, the change of the triplet phase is analyzed based on the dynamical theory for multiple diffractionsChang04 ; Colella74 ; Shen98 . In Fig.4, the profiles with typical asymmetry () and the distorted one () are displayed. Note that the change in the peak profile for indicates that the original centrosymmetry is broken due to lattice deformation caused by ion displacements under the influence of external forces. The measured in Fig. 3(a) is very similar to the simplified calculation of triplet phase in Fig. 1 when the deformation is small . (Note that, in the present case, because the original value of is zero for the undistorted lattice.) The Darwin width of a Bragg reflection was also monitored in order to make sure the crystal was not destroyed by the applied voltage. As shown in Fig. 3(b), the change of the triplet phase hits its maximum at = 0.12 0.14 V. This clearly shows that the internal distortions of CDWs reach saturation just before the sliding motion. Loosely speaking (ignoring spatial inhomogeneity), at low bias voltages, the free energy is minimized by the small cost of elastic energy due to CDW distortions. After threshold voltage, it is energetically favorable to slide (costing kinetic energy) rather than holding up the large elastic energy. The estimated from curve fitting at 0.1, 0.12 0.13, 0.14, 0.15, and 0.16 V are about 6∘, 10∘, 18∘, 17∘, 17∘, and 10∘ respectively, and then back to 0∘ for . As far as we know, this is the first direct observation of the spatial distortions of CDWs from the pinned to sliding states.Gruner94 ; Brazovskii00
In summary, we demonstrate the simultaneous measurements of transport, half-width of the Bragg peak and the triplet phase of CDWs in KMoO3 at different driving voltages. The combination of different measurements provides evidence for the origin of the nonlinearity and dynamical phase transition in periodic media In particular, the phase measurement using three-beam diffraction is demonstrated for the first time as a novel and sensitive method to probe dynamical phenomena in nonlinear systems. While it is already exciting to observe how the internal deformations respond through the dynamical transition of CDW, it also opens up many interesting issues requiring further studies. For instance, the powerful technique developed here can be use to study the crossovers/transitions between different types of dynamical phases and a global phase diagram at different temperatures and voltages can be mapped out without ambiguity. This technique can also been applied to general periodic media, such as stripes/CDWs in high- related perovskites, and possibly deepen our understanding of dynamical motions in these materials.
The authors acknowledge the Ministry of Education, National Science Council in Taiwan and the National Synchrotron Radiation Research Center for financial supports, through the grants No. 90-FA04-AA, NSC 91-2112-M-213-016, NSC 92-2112-M-032-013 and NSC93-2112-M-007-005. The beam time arrangements by the NSRRC and SPring-8 are also gratefully appreciated.
References
- (1) A. W. Overhauser, Adv. Phys. 27, 343 (1978)
- (2) U. Yaron, et al., Nature 376, 753 (1995)
- (3) E. Y. Andrei, et al., Phys. Rev. Lett. 60, 2765, (1988)
- (4) Z. L. Xiao, E. Y. Andrei, P. Shuk, and M. Greenblatt, Phys. Rev. Lett. 86, 2431, (2001)
- (5) P. Littlewood, Nature 399, 529 (1995)
- (6) C.-H. Du, et al. Phys. Rev. Lett. 84, 3911 (2000)
- (7) C. A. Murray, et al., Phys. Rev. B 42, 688, (1990)
- (8) R. Seshadri, ey al., Phys. Rev. B. 46, 5150, (1992)
- (9) N. Ogawa, et al., Phys. Rev. Lett. 87, 256401 (2001)
- (10) R. Danncau, et al., Phys. Rev. Lett. 89, 106404 (2002)
- (11) T. Giamarchi, and P. Le. Doussal, Phys. Rev. B 52, 1242 (1995)
- (12) L. Balents, M. C. Marchetti, and L. Radzihovsky, Phys. Rev. B 57, 7705 (1998)
- (13) S. L. Chang, X-ray multiple-wave diffraction: theory and application, Springer-Verlag, Berlin, (2004)
- (14) R. Colella, Acta Crystallogr. A 30, 413 (1974)
- (15) Q., Shen, Phys. Rev. Lett. 80, 3268 (1998)
- (16) C. Giacovazzo, Fundamentals of crystallography, Oxford University Press, Oxford, (2002)
- (17) W. J. Schutte, and J. L. de. Bore, Acta Cryst. B 49, 579 (1993)
- (18) P. Chauve, et al. Phys. Rev. B 62, 6241 (2000)
- (19) M. C. Marchetti, et al. Phys. Rev. Lett. 91, 107002 (2003)
- (20) D. S. Fisher, Phys. Rev. Lett. 50, 1486 (1983)
- (21) L.-W. Chen, et al., Phys. Rev. B 54, 12798 (1996)
- (22) V. M. Vinokur, and T. Nattermann, Phys. Rev. Lett. 79, 3471 (1997)
- (23) T. L. Adelman, et al., Phys. Rev. B 47, 4033 (1993)
- (24) A. E. Koshelev, and V. M. Vinokur, Phys. Rev. Lett. 73, 3580 (1994)
- (25) C. Reichhardt, et al., Phys. Rev. Lett. 90, 026401 (2003)
- (26) S. G. Lemay, et al., Phys. Rev. Lett. 83, 2793 (1999)
- (27) C.-H. Du, et al., Acta Cryst. A 60, 209 (2004)
- (28) C.-Y. Lo, Master dissertation, National Tsing-Hua University, (2004)
- (29) G. Grner, Density waves in solids, Addison-Wesley, New York, (1994)
- (30) S. Brazovskii, et al., Phys. Rev B. 61, 10640 (2000).