PaperId: cond-mat/0412690
Fiske steps studied with flux-flow resistance oscillation in a narrow stack of Bi2Sr2CaCu2O8+d junctions
Abstract
We have experimentally investigated the fluxon dynamics in a narrow Bi2Sr2CaCu2O8+d stack with junction length 1.8 m. As an evidence of high-frequency excitation by a collective cavity mode, under an (in-plane) external magnetic field, the current-voltage characteristics show prominent Fiske steps with the corresponding resonance frequencies of 75-305 GHz. Further study of flux-flow resistance oscillation with various -axis currents clarifies the correlation with Fiske steps by distinguishing two different regions i.e., static flux-flow region at low bias current level and dynamic Fiske step region at high bias current level.
pacs:
72.30.+q, 74.25.Qt, 85.25.CpIn stacked Bi2Sr2CaCu2O8+d (BSCCO) intrinsic Josephson junctions (IJJs), the mutual interaction between junctions is expected since the superconducting layers, with the layer thickness = 0.3 nm, are much thinner than the London penetration depth L= 170 nmSakai:1998 . Under the applied magnetic field parallel to the layers, Josephson vortices in a stack form lattice configurations that depend on a constant phase shift between neighboring layers, ranging from 0 for the rectangular lattice to for the triangular lattice (see Fig. 1(a)) Bulaevskii:1991 ; Koshelev:2001 ; Kim:2002 .
Under the appropriate conditions, the fluxon lattice will excite the two-dimensional cavity modes in stacked junctions, leading to the emission of electromagnetic wave with characteristic frequency ( is the phase velocity of electromagnetic wave, is the junction length, (=1, 2, 3,…) denotes -direction mode, and (=1, 2, 3,…) denotes the stacking direction mode)Kleiner:1994 . The is given by
| (1) |
with the Josephson penetration depth , the coupling parameter , the junction number and the Josephson plasma frequency Kleiner:1994 ; Sakai:1998 ; Bulaevskii:1991 . Among the different modes along the stacking direction, the mode with the lowest velocity is usually stimulated by a triangular vortex lattice; while for the mode with the highest velocity , a rectangular lattice is favorableUstinov:1996 ; Pedersen:1995 .
Being driven by a -axis bias current, the moving fluxon lattice generates flux-flow resistance (FFR) in the junctions. Recent experimentalOoi:2002 ; Kakeya:2004 ; Hatano:2005 and numericalMachida:2003 ; Koshelev:2002 studies show that the motion of traveling fluxon lattice in the layers is reflected into the periodic oscillation of FFR under the low bias current by considering the dynamical matching between the vortex lattice and the sample edges. The -period oscillation of FFR is interpreted as a result of the formation of triangular lattice in a long-junction stack, where is the field for adding one flux quantum per one junction (, being the flux quantum and the layer periodicity along the axis i.e. 1.5 nm)Ooi:2002 ; Machida:2003 . Recent studies indicate that when the junction size is reduced down to a few m and approaches the short-junction stack limit (), the oscillation period becomes predominantly rather than due to the deformation of the Josephson vortex lattice by strong interaction with junction edgesKakeya:2004 ; Hatano:2005 . The result may suggest a possible existence of collective vortex motion such as a rectangular vortex lattice in a narrow stack. However the recent FFR research is limited at very low bias current levels such as less than 1% of critical current at zero field , and it is still obscure whether the vortex dynamics studied by FFR is related with high-frequency excitation or not.
In this paper, stimulated by the above-mentioned researches, we confine ourselves to study of the singularities in the curves and the correlation with the current-dependent FFR oscillation in the narrow BSCCO stacks with 1.8 m and large junction number , exploring the high-frequency excitation by a possible collective fluxon motion.
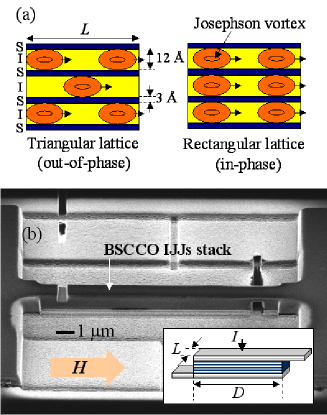
In our experiments, a BSCCO whiskerNagao:2001 with a clean and flat surface was fabricated to be an in-line type of IJJs stack with the length of 1.8 m by a focused ion beam. A schematic diagram of the stack is shown in the inset of Fig. 1(b). Here, and denote the junction length perpendicular to the magnetic field and the depth parallel to the field. The fabricated IJJs stack had a thickness of about 180 nm, i.e., containing about 120 junctions. The values of critical temperature () was 81 K, and the values of were about 350 A at 10 K and about 195 A at 50 K respectively. The electric transport properties were measured with a four-terminal configuration using a Physical Property Measurement System (PPMS, Quantum Design), which can supply magnetic field up to 9 T. In order to enhance the edge effect of the sample on moving Josephson vortices, we applied the magnetic field parallel to the ab-plane along the longer side () of the BSCCO stack (see Fig. 1(b)). The sample was mounted on a rotatable holder with a resolution better than 0.005o. The in-plane alignment was precisely adjusted by the angular dependence of FFR under external magnetic field.
The Josephson penetration depth is given by with the effective values , , the (in-plane) magnetic penetration depth , by assuming =170 nm, the thickness of superconducting layers and insulating layers =0.3 nm and =1.2 nmHechtfischer:1997 . The of our sample was calculated as 0.27 m at 10 K (0.34 m at 50 K). The sample width of 1.8 m is about 6.6 times (about 5.3 times at 50 K) as large as the calculated at 10 K, thus it can be still regarded as a long-junction stack; however, as we applied magnetic fields perpendicular to the narrower side, which is different from the conventional case, we use the term ‘narrow’ to specify our sample.
Figure 2(a) displays the characteristics under various magnetic fields parallel to the layers at 50 K. In order to indicate a periodic modulation of the curves with field, we normalized the magnetic fields in graphs of Fig. 2 by the period =0.765 T, which corresponds to calculated for this sample. Then we can regard the normalized field as Josephson fluxon number per unit junction. The magnetic field was applied in the range from 0.765 T () to 3.825 T () with an interval of 0.0765 T (0.1).
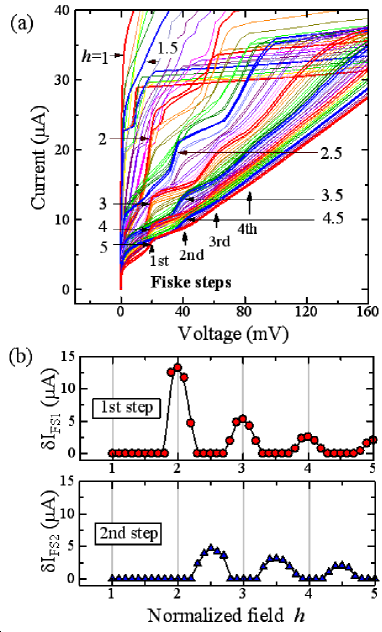
With increasing magnetic field, we found clear current steps that were regularly developed in the curves, as shown in Fig. 2(a). These steps were identified as Fiske steps that had been observed as a strong enhancement of superconducting current when the Josephson frequency () matches the resonant frequency of electromagnetic cavity modes excited in junctionsKulik:1964 ; Cirillo:1998 ; Krasnov:1999 ; Latyshev:2002 . The asymptotic voltage positions of step series are given by
| (2) |
Using the voltage position of the first Fiske step (18.7 mV) defined by local maximum I/V, the characteristic velocity was estimated to be m/sec using Eq. (2) with =1, =120, and =1.8 m. Since the series of Fiske steps are observable up to the 4th order in Fig. 2(a), the corresponding resonance frequency lies in the range of 75-305 GHz.
According to Eq. (1), using a set of the experimental parameters (the current density =1.015 kA/cm2 at 50 K, the thickness of insulating layer =1.2 nm, the coupling constant , and =0.76 m), the velocities of the lowest mode and the highest mode are calculated as m/sec and m/sec, respectively. Our result, estimated from the Fiske step, is comparable with the velocity of the lowest collective cavity resonance mode, in agreement with Refs. Krasnov:1999, and Latyshev:2002, .
The observed odd and even steps obviously have different dependences on the magnetic field. Fig. 2(b) shows the field dependence of the step height () for the first and second steps. With increasing field, each height of the first and the second order steps oscillated with the same period . However, the maxima of the first order step appeared at =integer, and the minima at =half-integer; while the second order step exhibited opposite behavior. Note that this is very similar to the behavior of a single junctionKulik:1964 ; Cirillo:1998 except that large current-step voltage due to the contribution from all junctions. This is very important because such a single junction behavior is possible when all junctions are evenly excited by a collective cavity resonance in stacked junctions.
For further understanding of Fiske steps, we also studied the correlation between Fiske steps and the FFR oscillation as function of magnetic field, which has been regarded as a powerful tool for this purposeOoi:2002 ; Kakeya:2004 ; Hatano:2005 ; Machida:2003 ; Koshelev:2002 .
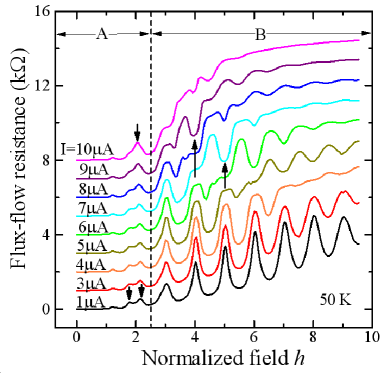
At extremely low -axis current A (0.52 % of ), as shown in Fig. 3, there are two oscillation regimes of FFR: one is below and the other is over with the oscillation period of (see Part A and B in Fig. 3). The details for the change in oscillation period by magnetic field will be elucidated with the model based on the edge current elsewhereHatano:2005 .
Having noticed in Fig. 2(a), there is not any step at such a low current level, we intended to measure the FFR at much high current levels. Surprisingly, we have observed a new anomaly of FFR oscillation at higher bias currents as shown in Fig. 3. In particular, for high field (Part B in Fig. 3) it is found that the peaks and the local minima of FFR oscillation were inverted by varying bias current as marked by the arrows, with the oscillation period unchanged. Note that the inversion from the peaks to the local minima of FFR oscillation implies a change of the matching between the edge and Josephson vortices as well as an enhanced conductance. As is well known, such conductance enhancement in a Josephson junction, usually resulting from resonance in the junction, should manifest itself as a current steps in the characteristics.
To confirm this, we compared the current-dependent anomaly of FFR oscillation in Fig. 3 with the curves in Fig. 2(a). Looking at the FFR curves marked by the arrows at the normalized field and 5 in Fig. 3, the clear inversion from peaks to local minima took place when the bias current was varied from 5 A to 9 A. Considering the corresponding curves in Fig. 2(a) with the same field and bias current range, we see two Fiske steps appearing at the same voltage in the curves, as marked by the arrows at the fields and 5. As one can see in Fig. 3, there are several more inversion points at different normalized fields, and the corresponding steps in Fig. 2(a).
Different from the high field regime where the FFR oscillates with the period , in the low field regime where the FFR oscillation period is smaller than and comparable with , there is neither inversion of the FFR oscillation nor steps up to 10 A. In the case of the field of in Fig. 2(a), the first Fiske step appears at the current around 20 A. The experimental results show the inversion of FFR oscillation near 20 A after FFR becomes -oscillation, i.e., two peaks merge into one peak (see the arrows in Part A of Fig. 3). Accordingly, it is clear that the Fiske steps appear only in the regime that FFR oscillates with a period of and that there is the inversion of FFR oscillation from peaks to local minima.
Noticeably, after the inversion of FFR oscillation, there is distortion of -oscillation with =8 A around =4 and =4.5 where the first and the second steps appear in curves. This can be understood with the following explanation. When the first and the second Fiske steps coexist at same current level, FFR will reflect the behavior of these Fiske steps under magnetic field. Then the product of two (odd and even step’s) field dependence factors (refer to Fig. 2 (b)) should consequently result in -period oscillation of FFR. This is in fact the case at which Ustinov and Pedersen could observe -oscillation in their simulation for a single long-junctionUstinov:2005 . However in our experiments, some steps don’t coexist at the same current due to large voltage intervals between Fiske steps and the reduced step amplitude at 50 K. Therefore the FFR oscillation was mainly affected from one step (odd or even), with the dominant -period at the current near Fiske steps. Nevertheless, the neighboring steps caused observable distortion of FFR.
Having understood the correlation between the FFR oscillation and the characteristics, we can distinguish between the two different regimes divided by dash dot line in Part B of Fig. 3. In the low bias region before the occurrence of inversion of FFR, i.e., before the appearance of Fiske steps, the Josephson fluxon dynamics is mainly determined by the edge pinning effect and the coupling interaction between the layersMachida:2003 ; Koshelev:2002 . Therefore the information of fluxon lattice can be probed by the FFR oscillation measurement to some extent. As a matter of fact, such oscillation of FFR in this regime (especially at the low bias current and high field) is just same as modulation with magnetic field.
On the other hand, in the inversion region of FFR oscillation accompanying the Fiske steps at relatively high bias current range, the dynamic resonant fluxon motion is dominant due to the interaction between the traveling fluxon and the cavity mode excitation. Thus in the high bias region showing the Fiske steps, the fluxon lattice can’t be determined simply by the measurement of FFR oscillation. We can only try to figure out the lattice structure by comparing the characteristic velocity obtained from the Fiske steps measurement and Eq. (1).
With low-temperature scanning electron microscopy (LTSEM), Quenter Quenter:1995 also observed similar different regimes . For the bias points close to origin (in a finite voltage state without Fiske steps), the LTSEM image showed the static distribution of the Josephson current in the presence of an external magnetic field. For the high bias point close to a voltage of Fiske resonance, a clear standing-wave pattern is observed due to the superposition of the traveling wave and the reflected waves. These are consistent with our results.
In summary, the current-voltage characteristics of BSCCO IJJs stacks with 1.8 m under an external magnetic field showed pronounced Fiske steps as an evidence of high-frequency excitation. The alternative appearance of even and odd Fiske steps resembles the behavior of a single junction, although there are more than 100 junctions in one stack. The observed Fiske steps and their mode of the collective cavity resonance suggest that all junctions in such a narrow stack can be synchronized by the Fiske resonance. Further measurements on the field-dependent FFR with various -axis currents clarify the correlation with Fiske steps by distinguishing two different regions i.e., static flux-flow region at low bias current level and dynamic Fiske step region at high bias current level.
The authors would thank N.F. Pedersen, M. Machida, B. Friedman, M. Tachiki and I. Iguchi for valuable discussion.
References
- (1) S. Sakai, P. Bodin, and N. F. Pedersen, J. Appl. Phys. 73, 2411 (1993); S. Sakai, A. V. Ustinov, N. Thyssen, and H. Kohlstedt, Phys. Rev. B 58, 5777 (1998).
- (2) L. Bulaevskii and J. R. Clem, Phys. Rev. B 44, 10234 (1991).
- (3) A. E. Koshelev and I. S. Aranson, Phys. Rev. Lett. 85, 3938 (2000); A. E. Koshelev and I. Aranson, Phys. Rev. B 64, 174508 (2001).
- (4) J. H. Kim, Phys. Rev. B 65, 100509(R) (2002).
- (5) R. Kleiner, P. Müller, H. Kohlstedt, N. F. Pedersen, and S. Sakai, Phys. Rev. B 50, 3942 (1994); R. Kleiner, Phys. Rev. B 50, 6919 (1994).
- (6) A. V. Ustinov and H. Kohlstedt, Phys. Rev. B 54, 6111 (1996).
- (7) N. F. Pedersen and A. V. Ustinov, Supercond. Sci. Technol. 8, 389 (1995).
- (8) S. Ooi, T. Mochiku, and K. Hirata, Phys. Rev. Lett. 89, 247002 (2002).
- (9) I. Kakeya, M. Iwase, T. Yamazaki, T. Yamamoto, and K. Kadowaki, at the conference ”Plasma-2004”, Tsukuba, Japan, (2004).
- (10) T. Hatano , submitted.
- (11) M. Machida, Phys. Rev. Lett. 90, 037001 (2003).
- (12) A. E. Koshelev, Phys. Rev. B 66, 224514 (2002).
- (13) M. Nagao, M. Sato, H. Maeda, S. Kim, and T. Yamashita, Appl. Phys. Lett. 79, 2612 (2001).
- (14) G. Hechtfischer et al, Phys. Rev. B 55, 14638 (1997); G. Hechtfischer et al, Phys. Rev. Lett. 79, 1365 (1997).
- (15) I. O. Kulik, JETP Lett. 2, 84 (1965); M. D. Fiske, Rev. Mod. Phys. 36, 221 (1964).
- (16) M. Cirillo, N. Grønbech-Jensen, M. R. Samuelsen, M. Salerno, and G. Verona Rinati, Phys. Rev. B 58, 12377 (1998).
- (17) V. M. Krasnov, N. Mros, A. Yurgens, and D. Winkler, Phys. Rev. B 59, 8463 (1999).
- (18) Yu. I. Latyshev, A. E. Koshelev, V. N. Pavlenko, M. B. Gaifullin, T. Yamashita, and Y. Matsuda, Physica C 367, 365 (2002).
- (19) A. V. Ustinov and N. F. Pedersen, Phys. Rev. B 72, 052502 (2005).
- (20) D. Quenter, A. V. Ustinov, S. G. Lachenmann, T. Doderer, R. P. Huebener, F. Müller, J. Niemeyer, R. Pöpel, and T. Weimann, Phys. Rev. B 51, 6542 (1995).