Phase diagrams in the lattice RPM model: from order-disorder to gas-liquid phase transition
Abstract
The phase behavior of the lattice restricted primitive model (RPM) for ionic systems with additional short-range nearest neighbor (nn) repulsive interactions has been studied by grand canonical Monte Carlo simulations. We obtain a rich phase behavior as the nn strength is varied. In particular, the phase diagram is very similar to the continuum RPM model for high nn strength. Specifically, we have found both gas-liquid phase separation, with associated Ising critical point, and first-order liquid-solid transition. We discuss how the line of continuous order-disorder transitions present for the low nn strength changes into the continuum-space behavior as one increases the nn strength and compare our findings with recent theoretical results by Ciach and Stell [Phys. Rev. Lett. 91, 060601 (2003)].
pacs:
02.70.Rr, 64.60.Fr, 64.70.FxI Introduction
In spite of the considerable progress made in the last decade in getting a clear picture of critical behavior and phase separation in systems dominated by Coulombic interactions, ionic systems remain the subject of intense interest. For a symmetric 1:1 electrolyte system, for example, recent experiments Wiegand97 ; Wiegand981 ; Wiegand982 ; Weingartner01 ; Bianchi01 and simulations pablo01 ; azp02 ; caillol02 ; Luijten02 ; Kim04 strongly support three-dimensional Ising-like criticality as the asymptotic behavior. One of the most basic and successful models of ionic fluids is the restricted primitive model (RPM), in which the ions are viewed as equisized hard spheres carrying positive and negative charges of the same magnitude. Used for both theoretical and Monte Carlo simulations, the RPM model is able to characterize properly the vapor-liquid phase transition observed in electrolyte solutions Fisher94 ; Stell95 ; Fisher93 , as well the solid-liquid transitions of molten salts Vega03 .
In recent years, in order to understand better criticality in the RPM model, a lattice version of this model has been introduced Dickman99 ; azp99 ; Ciach ; Ciach03 ; Ciach04 ; Kobelev02 ; Kobelev03 ; Diehl03 ; Fisher04 . In this model, the positions of the positive and negative ions are restricted to the sites of an underlying lattice with a spacing equal to the ionic diameter. The most striking feature of this model is the presence of an order-disorder transition, which is absent in the continuous version of the RPM. There is no gas-liquid transition and the coexistence is between a low-density disordered phase and an antiferromagnetically ordered high-density phase; the transition is continuous (Néel-type line) above and first-order below a tricritical point. By contrast, non-ionic fluids have the same critical behavior as the lattice Ising model such that continuum and lattice models are essentially equivalent azp00 .
Although the presence of an underlying lattice naturally favors the appearance of charge ordering, it is not completely obvious why the lattice and continuum models of RPM present such a different critical behavior. A possible explanation has been advanced by Ciach and Stell Ciach ; Ciach03 ; Ciach04 using a formalism based on the Landau-Ginzburg-Wilson approach. They proposed that in contrast to the uncharged systems with short-range interactions, where the long-wavelength fluctuations dominate and the lattice structure is irrelevant, in ionic systems the short-wavelength charge fluctuations are the most important. In this case, the short-distance properties of the system, such as the lattice structure or the shape of the short-range potentials added to the RPM model, become important and different phase diagrams can be obtained, i.e. there is no universality. In fact, Ciach and Stell have predicted that for a model system with additional short-range interactions added to the RPM model both gas-liquid and tricritical points can be thermodynamically stable. Also, more recently Ciach03 ; Ciach04 they proposed that when repulsive nearest neighbor interactions are included to the lattice RPM model, the phase diagram obtained should be qualitatively the same as in the continuum RPM model. These short-range interactions could represent the interaction between the ions and the particles of the solvent in which the ions are dissolved.
In this paper we extend the lattice RPM model for ionic systems introduced in Ref. Diehl03 , where a short-range attractive potential was supplemented to the lattice RPM. Now, in addition to the hard-core and electrostatic interactions, some short-range repulsive interactions between the ions are included. We use grand canonical Monte Carlo simulations, combined with histogram reweighting Ferrenberg88 and mixed-field finite-size scaling Wilding92 techniques, to obtain the coexistence curves and the associated critical points. The paper is organized as follows. The model and the computational details are given in Sec. II. Results are discussed in Sec. III. We close in Sec. IV with summary and conclusions.
II Model system and simulation methods
The model used here is essentially the same as that of Ref. Diehl03 , but with repulsive rather than attractive interactions. We consider a system of charged hard spheres of equal diameter , half of them carrying charge and half charge , interacting through the pair potential
| (1) |
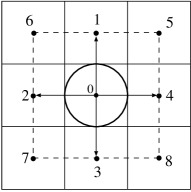
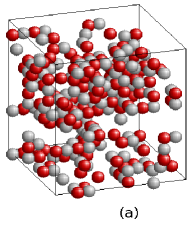
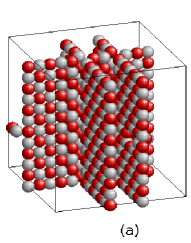
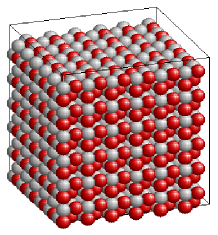
where is the dielectric constant of the structureless solvent in which the ions are immersed. In addition to the electrostatic potential and hard-core given in Eq. (1), we include a short-range repulsive potential of strength between the first (nn) nearest neighbor ions, regardless of their charge. For the lattice RPM model is recovered. These ions are restricted to the sites of a three-dimensional simple cubic lattice with a unit cell length . In Fig. 1 we show a two-dimensional projection of the lattice structure used in our simulations. Reduced quantities are defined as follow
| (2) |
where is the ion diameter, is the volume of the system and is the Coulomb energy between two ions at close contact. The reduced chemical potential, , is defined so that at the limit of high temperatures and low densities, , where the factor 2 comes from the presence of two ions per minimal neutral “molecule” inserted or deleted in the simulations. Using these definitions, the effect of the repulsive interactions on the properties of the lattice RPM model can be monitored by changing the reduced energy parameter, .
The simulations were performed using the discretization methodology introduced by Panagiotopoulos and Kumar azp99 . In this approach the allowed positions for the centers of the ions are on a simple cubic grid of characteristic length . Also, the lattice discretization parameter is defined as , such that the lattice and continuum limits can be reproduced by changing . In fact for the results were nearly indistinguishable from the continuum model and the critical parameters of the RPM were well reproduced azp02 ; Romero00 . In this work we study the lattice RPM model corresponding to . The Ewald sums were performed with conducting boundary conditions, using 518 Fourier-space wave vectors and real-space damping parameter .
We used grand canonical Monte Carlo (GCMC) simulations with pair additions and removals at each time step. To enhance acceptance of the insertion and removal steps we used distance-biased sampling, introduced in Ref. orkoulas94 . Multihistogram reweighting Ferrenberg88 ; Frenkel ; azp002 techniques were used to analyze the simulation data. For the critical region we used mixed-field finite size scaling (FSS) analysis proposed by Bruce and Wilding Wilding92 , which accounts for the lack of symmetry between coexisting phases in fluids. We did not attempt to incorporate corrections for pressure mixing in the scaling fields, as any such effects are expected to be small Young04 . Typical runs involve Monte Carlo steps (MCs) for equilibration and MCs for production. Statistical uncertainties for the critical parameters were produced from 8 to 24 independent runs, depending on system size, at near critical conditions, with different seeds used for the random number generator routine “ran2” of Ref. recipes .
III Results and discussion
In this section we present our results obtained for the lattice RPM model with nn repulsion. Since represents the pure lattice RPM model, for which the phase diagram is known, we begin our discussion analyzing the dependence of the density on the chemical potential when we increase the nn repulsive strength .
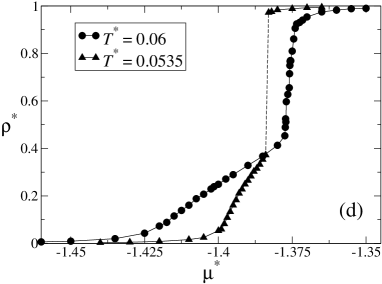
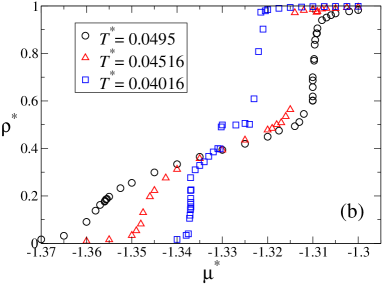
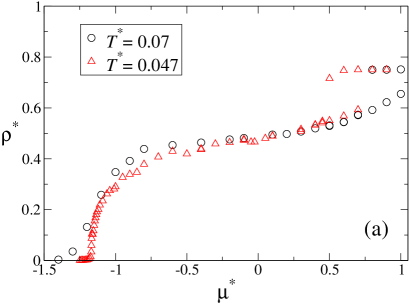
Figure 2 shows some isotherms calculated for different repulsive strength . For , for instance, Fig. 2 (a) shows that the dependence of the density on the chemical potential is smooth for , but for there is a discontinuity at . The same behavior persists until .
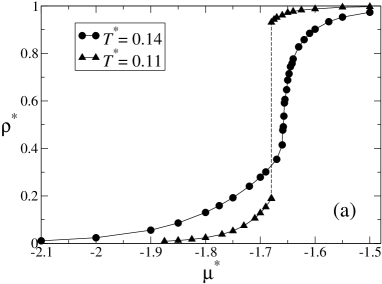
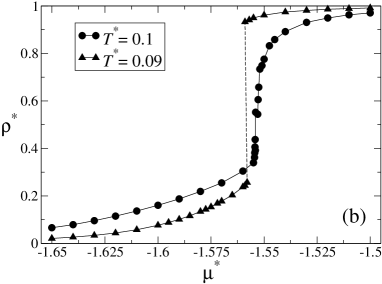
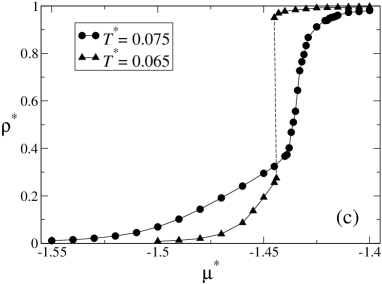
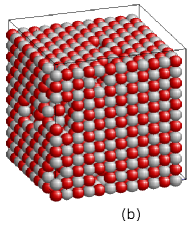
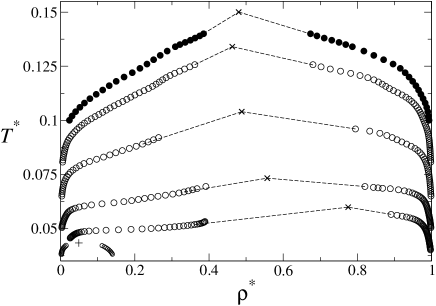
A closer inspection of the configurations generated at this chemical potential, Fig. 3, reveals an order-disorder phase transition. In this regime the electrostatic interaction drives the phase separation and only a tricritical point is observed. The effect of the short-range repulsion can be noticed only as a decrease of the tricritical temperature and increase of the corresponding density, as shown in Fig. 4, our estimate for the phase diagram as a function of the repulsive strength , obtained from histogram reweighting. We give an estimate of the location of the tricritical point, as shown in Fig. 4, based on a linear extrapolation of the coexisting lines, as expected for tricriticality. We did not find any evidence of a gas-liquid phase separation for between 0 and 0.06.
When we increase the repulsive strength the nearest neighbor occupancy becomes less favorable. Consider the reduced electrostatic energy defined as follows:
| (3) |
where is the reduced separation between two ions of valences and . In the lattice model depicted in Fig. 1 the distance between the nearest neighbor sites is , while for the second nearest neighbor ones is , where is the characteristic length of the simple cubic grid we are using in the simulations. Since the lattice RPM model corresponds to , if we consider , the energy between two ions in the first nearest neighbor sites is , while for the second nearest neighbor ones is . Therefore, for , if the site 0 in Fig. 1 is populated by a negative ion (), a positive ion () will be affected by the same energy and can occupy first and second nn sites with equal probabilities. Therefore, we expect competition between first and second nearest neighbor occupancy in the region around . In the limit of the occupation of the first nn sites is prohibited.
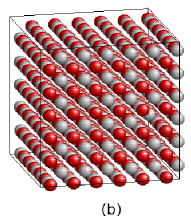

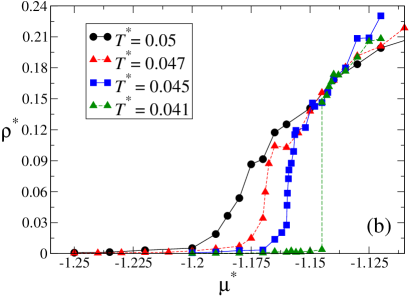
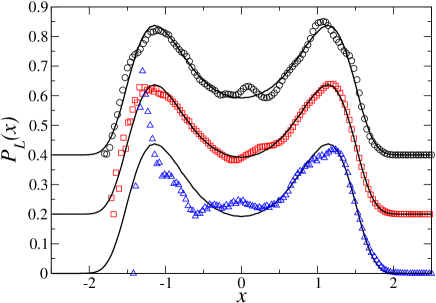
In fact, we have found that above the phase diagram starts to change. While in Fig. 2 we have only a first-order phase transition between a low density disordered state and a high density antiferromagnetically ordered state, the simulations suggest the existence of structured configurations in the intermediate density region, between the disordered and antiferromagnetically ordered states. In Fig. 5 we show some of these configurations. We can see in Fig. 6 that there is a range of chemical potentials over which a plateau at starts to evolve, where the configurations are similar to that of Fig. 5 (b).
A run initiated either at low density disordered state or at a high density ordered state [see e.g. Figs. 3 (a) and (b)] it would convert to this plateau. Although hysteresis loops are expected whenever first-order phase transitions are present, our GCMC method is unable to characterize these configurations properly. Configurations similar to Fig. 5 (b) remain apparently stable even after 1.8 Monte Carlo steps, with a very low acceptance for the Monte Carlo moves (), due to the low temperature and high density. Such structures could represent metastable states, but we cannot determine this conclusively based on our simulations.
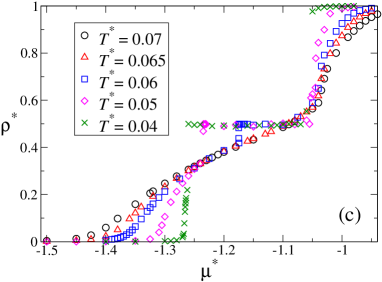
For , on the other hand, the simulations have produced a much clearer picture, as shown in Fig. 7. Once again, hysteresis loops were observed but now for both low and high-density regions. Also, the plateau observed at disappears completely. For the low-density region Fig. 7 (b) shows that the phase separation is between two disordered phases which we identify as a gas-liquid phase transition.
In order to characterize the critical point associated with the gas-liquid transition, we have used FSS Wilding92 analysis, which accounts for the lack of symmetry between coexisting phases in fluids. Briefly stated, for one-component systems we define an ordering parameter , where is the field-mixed parameter, such that at criticality the normalized probability distribution at a given system size, , has a universal form for every fluid in a given universality class, with . As stated in Section II, we did not attempt to incorporate pressure mixing in the scaling fields.
In Fig. 8 we show the collapse of the measured on the universal Ising ordering operator distribution for the system sizes , 15 and 18. The quality of the collapse on the universal three-dimensional Ising critical distribution is better for the intermediate system size. We attribute the discrepancies for the larger system size to inadequate sampling, especially around the less probably states of . For the smaller system size, there are too few particles in the simulation for adequate mapping on the universal distribution, as also observed previously for the RPM azp02 . We suggest that the system presents critical behavior compatible with Ising-like behavior, with a critical point located at , and for a system size . The critical temperature is reduced relative to the continuum RPM estimate azp02 , , mainly due to the addition of nearest neighbor repulsion in our model. The critical density, on the other hand, is considerable lower than , the continuum RPM estimate azp02 . In Fig. 9 we show the gas-liquid coexistence curves for the system sizes used in Fig. 8, along with the continuum RPM result obtained from the finely discretized simulations of Panagiotopoulos and Kumar azp99 .
For the high-density region Fig. 7 (a) suggests a first-order phase transition between a disordered high-density phase and an ordered state. Since these hysteresis loops still persist for a high temperature, we propose that the order-disorder phase transition with a tricritical point, observed for the low region, is replaced by a usual continuum-space behavior (first-order phase transition) as one increases . In Fig. 10 we show a typical configuration for this high density region. Since we are increasing the first nn repulsion, the system evolves to a less denser configuration, instead of the antiferromagnetically ordered state observed for the low domain. This behavior is essentially the same of the theoretical predictions of Ciach and Stell’s approach (see Fig. 1 (d) of Ref. Ciach03 ). We did not include the high density region for in Fig. 4 since GCMC simulations are unable to produce adequately sampled states at this very high densities.
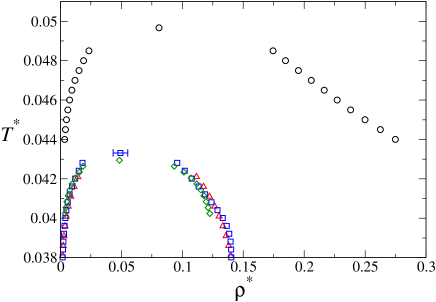
From the phase diagram presented in Fig. 4 we can predict how the line of continuous order-disorder transitions present for the low nn repulsion changes into the continuum-space behavior as one increases . For the low region, the gas-liquid transition remains metastable into the two-phase region associated with the order-disorder phase separation. When the nn strength is increased, the gas-liquid critical temperature increases, while the stable tricritical point decreases. Eventually, these two temperatures become of the same order, and the metastable critical point approaches the coexistence line of the order-disorder phase separation. This is essentially the behavior observed in Fig. 6. From this point, the increase of makes the tricritical point metastable.
Recently Ciach and Stell Ciach03 have proposed a model where the same nn repulsion was added to the lattice RPM model. Using a model based on a Landau-Ginzburg-Wilson field-theoretical approach they have found a phase diagram very similar to Fig. 4 in the limit of strong nn repulsion. Also, they have obtained the evolution of the phase diagram from order-disorder to a fluctuation-induced first-order charge-ordered-charge-disordered transition for high densities Ciach04 . Although GCMC is unable to properly characterize high-density phases, our simulation results predict that the sequence of phase diagrams observed in the Ciach and Stell’s model is (a)(b)(d) in Fig. 1 of Ref. Ciach03 , when we increase the nn strength.
IV Conclusions
In summary, we have used grand canonical Monte Carlo simulation and histogram reweighting techniques to study phase transitions in a lattice RPM model where, in addition to the Coulomb and hard-core interactions, some short-range repulsive interactions between the ions are added to the model. Phase diagrams for different short-range strength have been obtained. Our simulation results reveal a phase diagram strongly dependent on the nn parameter . Specifically, for weak nn repulsion and only order-disorder phase coexistence and a tricritical point are observed, since the phase separation is driven by the electrostatic interactions. Increasing makes the nearest neighbor occupancy becomes less favorable and the phase diagram starts to change. The nn exclusion on the simple cubic lattice used in our simulations prevents the order-disorder phase coexistence and tricriticality and for the low density region a gas-liquid phase separation appears. The critical point was estimated to belongs to the Ising universality class, with critical parameters at the same order of the continuum-space estimates. Thus our simulation results confirm qualitatively most of the theoretical predictions of Ciach and Stell’s approach Ciach03 ; Ciach04 .
Acknowledgments
AD acknowledges financial support of the Brazilian agency CNPq - Conselho Nacional de Desenvolvimento Científico e Tecnológico. Funding by the Department of Energy, Office of Basic Energy Sciences (through Grant No. DE-FG02-01ER15121 to AZP) and ACS-PRF (Grant 38165 - AC9 to AZP) are also gratefully acknowledged.
References
- (1) S. Wiegand, J. M. H. Levelt-Sengers, K. J. Zhang, M. E. Briggs, and R. W. Gammon, J. Chem. Phys. 106, 2777 (1997).
- (2) S. Wiegand, R. F. Berg, and J. M. H. Levelt-Sengers, J. Chem. Phys. 109, 4533 (1998).
- (3) S. Wiegand, M. E. Brigs, J. M. H. Levelt-Sengers, M. Kleemeier, and W. Schröer, J. Chem. Phys. 109, 9038 (1998).
- (4) H. Weingärtner and W. Schröer, Adv. Chem. Phys. 116, 1 (2001).
- (5) H. L. Bianchi and M. L. Japas, J. Chem. Phys. 115, 10472 (2001).
- (6) Q. Yan and J. J. de Pablo, J. Chem. Phys. 114, 1727 (2001).
- (7) A. Z. Panagiotopoulos, J. Chem. Phys. 116, 3007 (2002).
- (8) J. -M. Caillol, D. Levesque, and J. -J. Weis, J. Chem. Phys. 116, 10794 (2002).
- (9) E. Luijten, M. E. Fisher, and A. Z. Panagiotopoulos, Phys. Rev. Lett. 88, 185701 (2002).
- (10) Y. C. Kim and M. E. Fisher, Phys. Rev. Lett. 92, 185703 (2004).
- (11) M. E. Fisher, J. Stat. Phys. 75, 1 (1994).
- (12) G. Stell, J. Stat. Phys. 78, 197 (1995).
- (13) M. E. Fisher and Y. Levin, Phys. Rev. Lett. 71, 3826 (1993); Y. Levin and M. E. Fisher, Physica A 225, 164 (1996).
- (14) C. Vega, J. L. F. Abascal, C. McBride, and F. Bresme, J. Chem. Phys. 119, 964 (2003).
- (15) R. Dickman and G. Stell, in Simulation and Theory of Electrostatic Interaction in Solutions, edited by L. R. Pratt and G. Hummer (AIP, Woodbury, 1999).
- (16) A. Z. Panagiotopoulos and S. K. Kumar, Phys. Rev. Lett. 83, 2981 (1999).
- (17) A. Ciach and G. Stell, J. Mol. Phys. Liq. 87, 255 (2000); J. Chem. Phys. 114, 382 (2001); ibid 114, 3617 (2001); Physica A 306, 220 (2002).
- (18) A. Ciach and G. Stell, Phys. Rev. Lett. 91, 060601 (2003).
- (19) A. Ciach and G. Stell, Phys. Rev. E 70, 016114 (2004).
- (20) V. Kobelev, A. B. Kolomeisky, and M. E. Fisher, J. Chem. Phys. 116, 7589 (2002).
- (21) V. Kobelev, A. B. Kolomeisky, and A. Z. Panagiotopoulos, Phys. Rev. E 68, 066110 (2003).
- (22) A. Diehl and A. Z. Panagiotopoulos, J. Chem. Phys. 118, 4993 (2003).
- (23) J. -N. Aqua and M. E. Fisher, Phys. Rev. Lett. 92, 135702 (2004).
- (24) A. Z. Panagiotopoulos, J. Chem. Phys. 112, 7132 (2000).
- (25) A. M. Ferrenberg and R. H. Swendsen, Phys. Rev. Lett. 61, 2635 (1988); 63, 1195 (1989).
- (26) A. D. Bruce and N. B. Wilding, Phys. Rev. Lett. 68, 193 (1992); N. B. Wilding and A. D. Bruce, J. Phys.: Condens. Matter 4, 3087 (1992).
- (27) J. M. Romero-Enrique, G. Orkoulas, A. Z. Panagiotopoulos, and M. E. Fisher, Phys. Rev. Lett. 85, 4558 (2000).
- (28) G. Orkoulas and A. Z. Panagiotopoulos, J. Chem. Phys. 101, 1452 (1994).
- (29) D. Frenkel and B. Smit, Understanding Molecular Simulation (Academic, New York, 1996).
- (30) A. Z. Panagiotopoulos, J. Phys.: Condens. Matter 12, R25 (2000).
- (31) Y. C. Kim and M. E. Fisher, J. Phys. Chem. B 108, 6750 (2004); M. E. Fisher and G. Orkoulas, Phys. Rev. Lett. 85, 696 (2001).
- (32) W. H. Press, S. A. Teukolsky, W. T. Vetterling, and B. P. Flannery, Numerical Recipes in FORTRAN, 2nd ed. (Cambridge University Press, Cambridge, 1992).