Pulsed-gate measurements of the singlet-triplet relaxation time in a two-electron double quantum dot
Abstract
A pulsed-gate technique with charge sensing is used to measure the singlet-triplet relaxation time for nearly-degenerate spin states in a two-electron double quantum dot. Transitions from the (1,1) charge occupancy state to the (0,2) state, measured as a function of pulse cycle duration and magnetic field, allow the (1,1) singlet-triplet relaxation time (70 s) and the (0,2) singlet-triplet splitting to be measured. The use of charge sensing rather than current measurement allows long relaxation times to be readily probed.
pacs:
73.21.La, 73.23.Hk, 85.35.GvSemiconductor quantum dots are promising systems for the manipulation of electron spin because of the relative ease of confining and measuring single electrons Ciorga_PRB_2000 . In order to make use of the spin degree of freedom as a holder of either classical or quantum information, it is first necessary to understand and characterize the mechanisms that lead to spin relaxation and decoherence.
Previous studies of spin relaxation in quantum dots have focused on systems with large energy splittings of the relevant spin states, either singlet and triplet two-electron states, split by 600 eV Fujisawa_Nature_2002 , or Zeeman states, split by 200 eV Hanson_PRL_2003 ; Elzerman_Nature_2004 ; Kroutvar_Nature_2004 . In these cases, spin-orbit mediated processes are expected to dominate spin relaxation Khaetskii_PRB_2000 ; Golovach_PRL_2004 , while processes involving hyperfine coupling of electron spin to nuclei are relatively ineffective for splittings greater than the hyperfine coupling scale 0.1 meV 1 eV, where is the effective number of nuclei interacting with the electron spin Dobers_PRL_88 ; Erlingsson_PRB_2001 ; Khaetskii_PRL_2002 . Spin relaxation between nearly degenerate electronic states is particularly relevant to the problem of controlled entanglement, as singlet-triplet splitting goes to zero as the entangled spins become spatially separated.
In this Letter, we present pulsed-gate measurements of the singlet-triplet relaxation times and splittings in a two-electron double quantum dot. Spin states of the weakly-coupled (1,1) charge configuration (integer pairs specify the equilibrium charge occupancy on the left and right dot) are nearly degenerate. A spin selection rule impedes the transition from (1,1) spin triplets to the (0,2) singlet. To probe spin relaxation, the double dot is initialized, then loaded into the (1,1) state, then placed in a configuration where (0,2) is the preferred charge distribution in equilibrium. This transition probability is measured from a calibrated charge sensing signal as a function of the period of this three-step cycle. The resulting characteristic time of 70 s sets the time scale for of the spin-blockaded relaxation channels from (1,1) to the singlet state of (0,2). Measurements of the (1,1) to (0,2) transition probability as a function of detuning, , show a strong dependence on perpendicular magnetic field, , reflecting the singlet-triplet splitting of the (0,2) charge state, as discussed below.
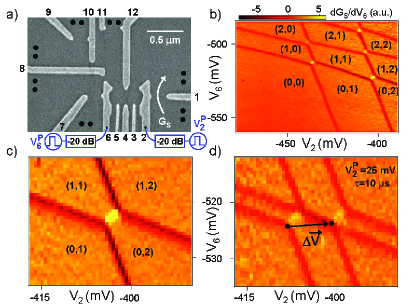
Samples are fabricated from a GaAs/Al0.3Ga0.7As heterostructure grown by molecular beam epitaxy. Electron beam lithography and liftoff are used to create Ti/Au gates that deplete a 100 nm deep two-dimensional electron gas with electron density 21011cm-2 and mobility 2105cm2/Vs. Gates 2–6 and 12 form the double quantum dot [see Fig. 1(a)]. Gates 2 and 6 are connected via bias tees to dc voltage sources and to pulse generators through coax cables with 20 dB of inline attenuation Tektronix . A QPC charge detector is created by depleting gate 1. Gates 7–11 are unused. The QPC conductance, , is measured using standard lock-in amplifier techniques with a 1 nA current bias at 93 Hz. The electron temperature, Te135 mK, was determined from Coulomb blockade peak widths. We present results from a single sample; a second sample with slightly larger lithographic dimensions gave qualitatively similar results Petta_PRL_2004 .
QPC charge sensing is used to determine the absolute number of electrons in the double dot. Figure 1(b) shows a large-scale charge stability diagram for the double dot. As electrons enter or leave the double dot, or transfer from one dot to the other, changes, resulting in sharp features in / (numerically differentiated) Elzerman_PRB_2003 ; Petta_PRL_2004 . In the lower left corner of Fig. 1(b), the double dot is completely empty. As the gate voltages are made more positive, electrons are added to the double dot. We will focus on the two-electron regime near the (1,1) to (0,2) charge transition [Fig. 1(c)]. In this location, charge transport in a double dot shows a striking asymmetry in bias voltage due to spin selection rules (Pauli blocking) Ono_Science_2002 ; Johnson_submitted . At forward bias, transitions from the (0,2) to the (1,1) singlet state (1,1) are allowed. However, for reverse bias, the (1,1) to (0,2) transition can be blocked if the (1,1) state forms a (1,1) because the (0,2) state resides outside the transport window due to the large singlet-triplet splitting in (0,2). This asymmetry results in current rectification, which is used in present pulsed gate measurements.
The double dot is electrostatically driven by applying pulses to gates 2 and 6. Figure 1(d) shows a charge stability diagram acquired with square pulses applied to gate 2 (=25 mV, 50 duty cycle, period =10 s). This results in two copies of the charge stability diagram, the right-most (left-most) charge stability diagram reflects the ground state charge configuration during the low (high) stage of the pulse sequence. The gate-voltage offset between the charge stability diagrams, , is used to calibrate pulse amplitudes. Additional calibrations are performed for gate 6, which primarily shifts the honeycomb in the vertical direction (not shown). A linear combination of pulses on gates 2 and 6 can be used to shift the stability diagram in any direction in gate space.
As a control, we compare a forward pulse sequence, where spin selection rules are expected to be important, with a reversed pulse sequence that does not involve spin selective transitions. The forward pulse sequence (Fig. 2(a)) begins with the gates at point E for 10% of the period, emptying the second electron from the double dot, leaving the (0,1) charge state. The gates then shift to the reset point R for the next 10% of the period, which initializes the system into the (1,1) configuration. The interdot tunnel coupling, , is tuned with so that the (1,1) singlet-triplet splitting /, where is the single dot charging energy. Due to this degeneracy, and at low fields such that (0.44 for GaAs), we expect to load into (1,1) or any of the three (1,1) states with equal probability. For the final 80% of the period, the gates are at the measurement point M where (0,2) is the ground state. Figure 2(b) illustrates the possible (1,1) to (0,2) transitions. If the R step loads the (1,1) state, tunneling to (0,2) occurs on a timescale given by the interdot tunneling rate, (We estimate the slowest (1 s)-1 from finite bias data Johnson_submitted ). If the m=0 (1,1) triplet state (1,1) is loaded, it dephases into (1,1) on a timescale of (expected to be 100 ns Kikkawa_PRL_98 ; Khaetskii_PRL_2002 ; Merkulov_PRB_2002 ) followed by a direct transition to (0,2). About half the time the R step will load the m=1 (1,1) triplet state (1,1) or the m=-1 (1,1) triplet state (1,1). At low , (0,2) is inaccessible, and a transition from (1,1) or (1,1) to (0,2) requires a spin flip and will be blocked for times shorter than the singlet-triplet relaxation time .
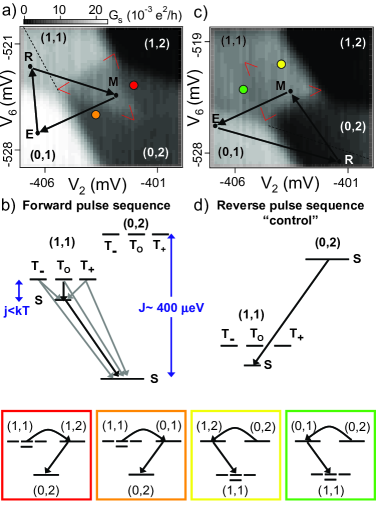
In Fig. 2(a) the average charge sensor signal, , is measured as a function of the dc gate voltages and , while a pulse sequence is repeated. This has the effect of translating the points E, R, and M throughout the charge stability diagram, keeping their relative positions constant. Because most of the time is spent at point M, the grayscale data primarily map out the ground state population for this point, with plateaus at 0.0, 6.0, 16, and 23 10-3e2/h indicating full population of the (1,2), (0,2), (1,1), and (0,1) charge states respectively. The pulse data differs from ground state data only when point M resides in the triangle defined by the (1,1) to (0,2) ground state transition and the extensions of the (1,1) to (0,1) and (1,1) to (1,2) ground state transitions (bounded by the red marks in Fig. 2(a)). Within this “pulse triangle” transitions from (1,1) to (0,2) may be blocked as described above, and the charge sensor registers a conductance intermediate between the (1,1) and (0,2) plateaus. If M moves above the pulse triangle (red dot in Fig. 2(a)), the (1,1) to (0,2) transition can occur sequentially via (1,2) with no interdot tunneling: a new electron enters the right dot, then the electron in the left dot leaves. Likewise, if M moves below the pulse triangle (orange dot in Fig. 2(a)) the transition can occur via (0,1): the left-dot electron leaves, then a new electron enters the right dot. By similar logic, point R must be to the left of the (0,1) to (0,2) transition extension (dotted line in Fig. 2(a)) to avoid resetting through (0,2) and preferentially loading (1,1). Figure 2(a) shows a signal of 1110-3e2/h in the pulse triangle for =10 s, which indicates that approximately 50% of the time the dots remain in (1,1) even though (0,2) is the ground state. This is direct evidence of spin-blocked (1,1) to (0,2) transitions.
If the the pulse sequence is reversed, so that the reset position R occurs in (0,2), where only the singlet state is accessible, and M occurs in (1,1), tunneling from R to M should always proceed on a time scale set by the interdot tunnel coupling, since the (0,2) to (1,1) transition is not spin blocked. As anticipated, no signal is seen in the pulse triangle for this reversed “control” sequence (Fig. 2(c)).
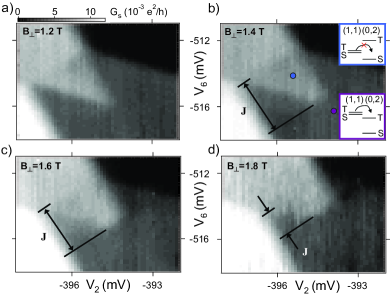
Spin selectivity of the forward pulse sequence in Fig. 3 can be used to measure as a function of Ashoori_PRL_1993 . Figure 3(a) shows as a function of and while applying the forward pulse sequence with 1.2 T and 10 s. For these data, (0,2) resides outside of the pulse triangle (, the mutual charging energy) and the (1,1) to (0,2) transitions are spin blocked. For 1.4 T [Fig. 3(b)] the (0,2) state is low enough in energy that the (1,1) states can directly tunnel to the (0,2) manifold at high detunings. Now (1,1) to (0,2) tunneling can proceed, and there is no longer a (1,1) charge signal in the (0,2) region of the pulse triangle at high detuning. This cuts off the tip of the pulse triangle. The spin-blocked region continues to shrink as is increased. From these data, we find 340, 280, and 180 eV for =1.4, 1.6, and 1.8 T, respectively lever_arm .
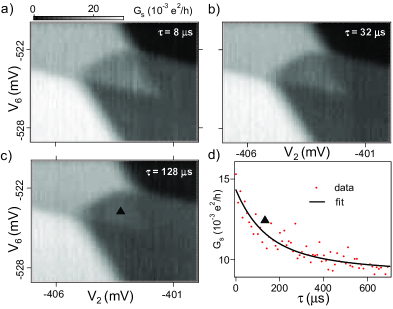
The time dependence of the charge sensing signal can be investigated by varying , the overall period of the cycle. Figure 4(a) shows as a function of and acquired using the forward pulse sequence with =8 s at =100 mT. A clear pulse signal is observed in the pulse triangle. As is increased, the pulse signal decreases as shown in (b–c). is measured inside the pulse triangle (, held fixed at -403,-523.8 mV, respectively) and is plotted as a function of in Fig. 4(d). In (1,1), 2010-3e2/h, whereas outside the pulse triangle in (0,2), 1010-3e2/h. For small , 1510-3e2/h in the pulse triangle. At long , approaches 1010-3e2/h in the pulse triangle, which indicates complete transfer from the (1,1) to (0,2) charge state.
These data are consistent with spin-blocked transitions preventing the (1,1) to (0,2) charge transition. Approximately 50 of the time, the (1,1) R pulse loads into either (1,1) or (1,1). These states may relax into the (1,1) state and then tunnel to (0,2) on a timescale set by . For , we expect that 50 of the (1,1) to (0,2) transitions will be spin-blocked, resulting in 50 (1,1) pulse signal in the (0,2) pulse triangle. For , the (1,1) and (1,1) states have ample time to relax to (1,1), after which a (1,1) to (0,2) transition can take place. Thus, for long compared to ST, the pulse signal to approaches the (0,2) level, indicating full transfer from (1,1) to (0,2). In the intermediate regime, the sensor signal due to spin-blocked transitions decays as a function of time on a timescale that is characteristic of ST.
The experimental data in Fig. 4(d) are fit assuming exponential singlet-triplet relaxation. Due to the slow measurement rate of the charge sensor (100 ms), is proportional to the time-averaged occupation of the left dot. Modeling an exponential decay of the sensing signal weighted over the 80% of the cycle corresponding to the (0,2) measurement gives , where A is the conductance asymptote at long times (full occupation of the (0,2) state) and B is the additional conductance in a short pulse due to the blocked states (approximately 50% of the (0,2) to (1,1) step height). The best fit to the data in Fig. 4(d) gives A=0.009 e2/h and B=0.007 e2/h, consistent with these expectations. In the center of the pulse triangle the best-fit reaches a maximum of 7010 s. Near the (1,1) to (0,2) transition, decreases, to 205 s at =-403.8 mV and =-523.0 mV. Closer to the tip of the pulse triangle, decreases due to thermally activated exchange with the leads (See Fig. 2, red and orange diagrams), thus the 70 s relaxation time represents a lower bound on the spin relaxation time within the (1,1) manifold interdot .
In GaAs quantum dots, spin-orbit and hyperfine interactions are expected to be the dominant mechanisms for spin relaxation. The spin-orbit contribution to T1 depends strongly on and theory predicts 10 ms for 1 T Golovach_PRL_2004 . The hyperfine spin relaxation rate is where 4107s-1 reflects the electron-phonon coupling, =0.135 meV is the nuclear energy for a fully polarized system, =1.25 is derived from the correlation of the nuclear spins, =0.045 depends on wavefunction overlap, the nuclear spin I=3/2, and 104 Erlingsson_PRB_2001 . Our sample is tuned with /. In this case, the Zeeman splitting between the =0 state and =1 states sets the relevant energy scale. Using 2.5eV gives =15 s, roughly consistent with the experimental results. The relaxation times found here can be compared with those obtained by Fujisawa et al. who measured =200 s in a vertical dot Fujisawa_Nature_2002 . In those measurements, the sizable singlet-triplet splitting implies that spin-orbit processes rather than nuclear processes dominant, in contrast to the present experiments.
Acknowledgements.
We acknowledge useful discussions with Jacob Taylor, Hans-Andreas Engel, and Mikhail Lukin. This work was supported by the ARO under DAAD55-98-1-0270 and DAAD19-02-1-0070, DARPA under the QuIST program, the NSF under DMR-0072777 and the Harvard NSEC.References
- (1) M. Ciorga et al., Phys. Rev. B , 16315 (2000).
- (2) T. Fujisawa et al., Nature , 278 (2002).
- (3) R. Hanson et al., Phys. Rev. Lett. , 196802 (2003).
- (4) J. M. Elzerman et al., Nature , 431 (2004).
- (5) M. Kroutvar et al., Nature , 81 (2004).
- (6) A. V. Khaetskii and Y. V. Nazarov, Phys. Rev. B , 12639 (2000).
- (7) V. N. Golovach, A. Khaetskii, D. Loss, Phys. Rev. Lett. , 016601 (2004).
- (8) M. Dobers et al., Phys. Rev. Lett. , 1650 (1988).
- (9) S. I. Erlingsson, Y. V. Nazarov, V. I. Fal’ko, Phys. Rev. B , 195306 (2001).
- (10) A. V. Khaetskii, D. Loss, L. Glazman, Phys. Rev. Lett. , 186802 (2002).
- (11) We use Anritsu K251 bias tees. Tektronix AWG520 pulse generators are used for high speed manipulation of the gate voltages.
- (12) J. R. Petta et al., Phys. Rev. Lett. , 186802 (2004).
- (13) J. M. Elzerman et al., Phys. Rev. B , 161308 (2003).
- (14) K. Ono et al., Science , 1313 (2002).
- (15) A. C. Johnson et al., cond-mat/0410679.
- (16) J. M. Kikkawa and D. D. Awschalom, Phys. Rev. Lett. , 4313 (1998).
- (17) I. A. Merkulov, Al. L. Efros, M. Rosen, Phys. Rev. B , 205309 (2002).
- (18) R. C. Ashoori et al., Phys. Rev. Lett. , 613 (1993).
- (19) The conversion from gate voltage to energy is determined by measuring finite bias triangles.
- (20) is set to be much faster than the characteristic relaxation times that we measure in this experiment. varies strongly with (see ref. 13). The fact that only varies by roughly a factor of three in the pulse triangle also indicates that the (1,1)-(0,2) transitions are spin-blocked and not limited by a slow .