How the Liquid-Liquid Transition Affects Hydrophobic Hydration in Deeply Supercooled Water
Abstract
We determine the phase diagram of liquid supercooled water by extensive computer simulations using the TIP5P-E model [J. Chem. Phys. 120, 6085 (2004)]. We find that the transformation of water into a low density liquid in the supercooled range strongly enhances the solubility of hydrophobic particles. The transformation of water into a tetrahedrally structured liquid is accompanied by a minimum in the hydration entropy and enthalpy. The corresponding change in sign of the solvation heat capacity indicates a loss of one characteristic signature of hydrophobic hydration. The observed behavior is found to be qualitatively in accordance with the predictions of the information theory model of Garde et al. [Phys. Rev. Lett. 77, 4966 (1996)].
pacs:
61.20.Ja, 02.79.Ns, 07.05.Tp, 64.70.FxThe thermodynamical anomalies of liquid water are considered to be caused by a transformation between two different liquid forms of water buried in the deeply supercooled region Debenedetti (2003). The two differently dense liquids have well characterized counterparts in the glassy state: The (very) high density and low density amorphous ice forms Mishima et al. (1984); Loerting et al. (2001). Computer simulation studies have furnished a picture of a first order liquid-liquid phase transition between two liquids ending up in a metastable critical point Poole et al. (1992); Tanaka (1996). Although singularity free scenarios might as well explain the properties of supercooled water Debenedetti (2003), there is experimental support for the liquid-liquid critical point hypothesis from the changing slope of the metastable melting curves observed for different ice polymorphs Mishima and Stanley (1998); Mishima (2000). To make the situation even more puzzling, recent computer simulations provide evidence that there might be even more than one liquid-liquid transition Brovchenko et al. (2003).
One prominent anomaly of liquid water is the increasing solubility of hydrophobic gases with decreasing temperature Wilhelm et al. (1977). This behavior is the consequence of a negative solvation entropy of small hydrophobic particles Pratt (2003). Since the corresponding solvation enthalpy is also negative, the observed low solubility (the large positive solvation free energy) of small hydrophobic particles is due to a dominating entropy effect. The origin of the negative hydration entropy is widely regarded as being due to the bias in the hydration waters orientational space, as the water molecules are trying to preserve their hydrogen bond network Southall et al. (2002). Entropy and enthalpy effects have been shown to be determined by the water in the first hydration shell Paschek (2004a). In addition, the broken hydrogen bond states, with hydrogen bond donors/acceptors pointing towards the hydrophobic particles, are increasingly populated with increasing temperature Southall et al. (2002). Hence, the positive solvation heat capacity of hydrophobic particles is considered as one of the key signatures for hydrophobic hydration Silverstein et al. (2000). A recent experimental study of Souda Souda (2004), investigating alkane layers adsorbed on an amorphous solid water substrate, shows that the alkane phase gets soaked into the water phase in the temperature region close to the suspected glass transition temperature Mishima (2004). One possible explanation (among others) might be that the highly viscous low density liquid form of water provides a significantly increased solubility for hydrophobic molecules. The scope of the present contribution is to monitor hydration of a small hydrophobic particle as we penetrate the deeply supercooled region. Our particular interest is to elucidate how the transformation into a highly tetrahedrally ordered low density liquid (LDL) phase Paschek and Geiger (1999) affects hydrophobic hydration.
An important problem regarding simulations of highly viscous liquids close to the glass transition is to provide proper sampling. To overcome this problem we perform parallel tempering simulations of an extended ensemble of states Frenkel and Smit (2002) using the technique of volume-temperature replica exchange molecular dynamics simulation (VTREMD) Paschek and García (2004). To represent liquid supercooled water, we employ the recently proposed TIP5P-E model for water, which was fitted to reproduce waters density maximum and related thermodynamical anomalies while treating the Coulomb interactions with the Ewald sum Rick (2004). For the VTREMD simulation VTR we consider a grid of 440 (,)-states STA .
Starting from a set of equilibrated initial configurations obtained at ambient conditions, the VTREMD simulation tec was conducted for , providing a total worth of trajectory data. The average time interval between two successful state-exchanges was obtained to be about . During the entire course of the simulation each replica has crossed the whole temperature and density interval several times. After an initial equilibration period of about , the average pressure and potential energies show convergence even for the lowest temperatures and the remaining are used for analysis.
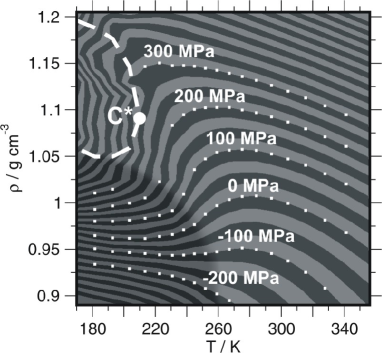
Figure 1 shows the phase diagram of liquid supercooled water in terms of a contour plot of the -data as obtained by the VTREMD simulations. The TIP5P-E phase diagram apparently exhibits a first order phase transition between two metastable liquid phases, ending in a second critical point . The location of the coexistence line, estimated from a Maxwell construction using the subcritical isotherms shown in Figure 2d, has to be seen as a rough guess only, since the exact form of the van der Waals loops in the two phase region might depend on the system size. The location of is close the values reported by Yamada et al. for the original TIP5P model with , and Yamada et al. (2002). Figure 2a compares experimental data Wagner and Pruß (2002) with several selected isobars according to a linear interpolation from the TIP5P-E data-set. Although the location of the density maximum at normal pressure is close to the experimental values, the TIP5P-E model exhibits a considerably larger thermal expansivity as real water and is significantly more compressible.

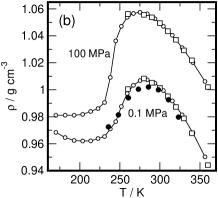

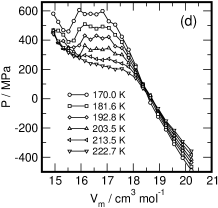
Figure 2b shows that the isobars derived from VTREMD data-set match exactly the data obtained from conventional -simulations. For comparison the isobar according to Rick’s simulation is shown Rick (2004). We denote small, but significant differences. Since both simulations were using Ewald summation, their origin is not quite clear at present. We would like to emphasize one particular detail of the low pressure isobars, indicated in Figures 1 and 2b: The density goes through a minimum after the transformation into the low density liquid has taken place. Apparently at low temperatures the expansivity seems to behave as it would be expected for a conventional liquid. I. Brovchenko et al. Brovchenko et al. (2003) and recently P. H. Poole Poole have made similar observations for the ST2-model. Figure 2c shows the evolution of the composite radial distribution function along the -isotherm. The highlighted patterns obtained for the lowest and highest densities show strong similarity with the functions determined experimentally by Bellissent-Funel et al. for high and low density amorphous ice Bellissent-Funel et al. (1987). The observed low density pattern has been shown to be related to a high tetrahedral order of water’s first hydration shell Paschek and Geiger (1999). Similarities between the local structure of LDA and ice have also been demonstrated recently by Finney et al. from the analysis of neutron scattering experiments Finney et al. (2002).
We do not observe indications for the presence of further liquid-liquid transitions for TIP5P-E, as suggested by Brovchenko et al. for the ST2 model Brovchenko et al. (2003). However, further phase transitions might be present at even lower temperatures. Finally, no signs for crystallization are observed, as denoted by Yamada et al. Yamada et al. (2002). Probably our smaller system size and the random walk of the replicas through state-space, regularly reaching stable regions, prevents the systems from crystallizing.
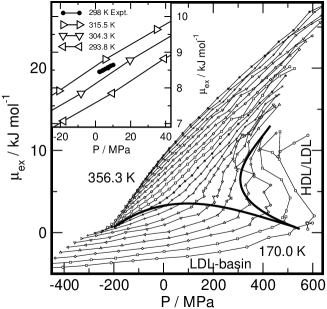
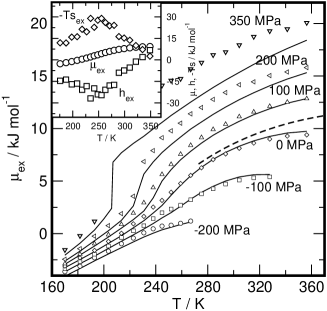
The hydrophobic hydration of a Lennard-Jones Argon particle ( and ) Paschek (2004b) is given as excess chemical potential for infinite dilution, where is the solubility and . We employ the Widom particle insertion method Frenkel and Smit (2002) with , where is the energy of an inserted test-particle. The brackets indicate canonical sampling. Details about the calculation are given elsewhere Paschek (2004b). Figure 3 shows the excess chemical potential for Argon dissolved in TIP5P-E water for all simulated state points. First of all we would like to emphasize that the solubility increases strongly when penetrating the deeply supercooled region with becoming even negative. The insert of Figure 3 compares the experimental data of Kennan and Pollack Kennan and Pollack (1990) with data from our simulation. The pressure dependence is expressed by a positive partial molar volume of , close to the experimental value of vol . The decreasing solubility upon density increase basically reflects the loss of available free volume. A larger partial molar volume in the simulation is hence in line with the increased isothermal compressibility observed for the TIP5P-E model, indicated by Figure 2a. Two regimes of small and strong pressure dependence are denoted, obviously related to the transformation between the high and low density liquid forms of water. We would like to point out that we find an increase of the partial molar volume for Ar around normal pressure for the isotherms. Kennan and Pollack made a similar observation for Xenon around . If, and how these two observations are related has to be further investigated. Figure 4 shows the temperature dependence of for several selected isobars ranging from to the supercritical . The experimental isobar Fernandez-Prini and Crovetto (1989) is given for comparison. From computer simulations of water, S. Garde et al. have derived an information theory (IT) model Garde et al. (1996); Hummer et al. (2000), giving simple analytic expressions for the hydrophobic hydration as a function of temperature and density. The leading term in the IT model strongly suggests a quadratic relation between the excess chemical potential and the water number density according to Hummer et al. (2000), where denotes the volume of a hydrophobic hard sphere particle, while indicates the variance of the number of water molecules in a sphere of volume . The lines in Figure 4 indicate a temperature dependence as suggested by the IT model, assuming the term to be constant and shifting the isobars by a constant offset to account for attractive interactions. Well reproduced is the change in slope when passing the transformation into the low density liquid, qualitatively correct even for the supercritical isotherm at , suggesting a discontinuity of . Hence an important conclusion is that the weak monotonous temperature and density dependence of , as proposed by the IT model, and confirmed for the high temperature regime Garde et al. (1996), is apparently also valid for the deeply supercooled region. This seems to be in line with the continuous structural transformation of water as a function of density (Figure 2c) and temperature (not shown). The thermodynamics of hydrophobic hydration of small solutes is therefore largely predetermined by the location of the water isobars in the -plane. As a consequence, also a waterlike liquid showing a continuous singularity free transition might exhibit a quite similar -dependence (apart from the discontinuous behavior of above ). As shown in the insert of Figure 4, the change in slope of is related to extrema in the temperature dependence of the entropy and enthalpy contributions. The minimum in the enthalpy causes a change in sign of the corresponding heat capacity from positive at high temperatures to negative for the low density liquid. Apparently, a prominent signature of the “hydrophobic hydration” vanishes while passing the transition at about . In addition, an increasing slope of upon approaching , as seen in the insert, and more prominently pronounced with increasing pressure (not shown), is consistent with the experimentally observed increase of the solvation heat capacity upon cooling Silverstein et al. (2000). Following the interpretation of the hydrophobic hydration according to Dill et al. Southall et al. (2002), the change in sign of is explained as follows: In the LDL-regime, water’s coordination number approaches four, while the structure corresponds to a continuous random tetrahedral network. Due to the lack of additional possible hydrogen binding partners, the environment of a water molecule in the LDL-bulk and in the hydrophobic hydration shell has greater similarity than in the “high density liquid” at ambient temperatures. This structural convergence in bulk and hydration shell in the LD-liquid leads to a smaller entropy difference and hence to an increase in . Moreover, a larger hydrophobic particle in the LD-liquid might even introduce disorder and hydrogen bond breaking into the (over) stretched hydrogen bond network and thus might even experience a positive hydration entropy. A further investigation on particle size dependence, hydrophobic aggregates and hydrophobic interaction might reveal a behavior markedly different from that at ambient conditions.
This work was supported by the Deutsche Forschungsgemeinschaft (Forschergruppe 436). I would like to thank Angel E. García, Ivan Brovchenko and Alfons Geiger for valuable discussions.
References
- Debenedetti (2003) P. G. Debenedetti, J. Phys. Cond. Matt. 15, R1669 (2003).
- Mishima et al. (1984) O. Mishima, L. D. Calvert, and E. Whalley, Nature 310, 393 (1984).
- Loerting et al. (2001) T. Loerting, C. Salzmann, I. Kohl, E. Mayer, and A. Hallbrucker, Phys. Chem. Chem. Phys. 3, 5355 (2001).
- Poole et al. (1992) P. H. Poole, F. Sciortino, U. Essmann, and H. E. Stanley, Nature 360, 324 (1992).
- Tanaka (1996) H. Tanaka, Nature 380, 328 (1996).
- Mishima and Stanley (1998) O. Mishima and H. E. Stanley, Nature 396, 329 (1998).
- Mishima (2000) O. Mishima, Phys. Rev. Lett. 85, 334 (2000).
- Brovchenko et al. (2003) I. Brovchenko, A. Geiger, and A. Oleinikova, J. Chem. Phys. 118, 9473 (2003).
- Wilhelm et al. (1977) E. Wilhelm, R. Battino, and R. J. Wilcox, Chem. Rev. 77, 219 (1977).
- Pratt (2003) L. R. Pratt, Annu. Rev. Phys. Chem. 53, 409 (2003).
- Southall et al. (2002) N. T. Southall, K. A. Dill, and A. D. J. Haymet, J. Phys. Chem. B 106, 521 (2002).
- Paschek (2004a) D. Paschek, J. Chem. Phys. 120, 10605 (2004a).
- Silverstein et al. (2000) K. A. T. Silverstein, A. D. J. Haymet, and K. A. Dill, J. Am. Chem. Soc. 122, 8037 (2000).
- Souda (2004) R. Souda, J. Chem. Phys. 121, 8676 (2004).
- Mishima (2004) O. Mishima, J. Chem. Phys. 121, 3161 (2004).
- Paschek and Geiger (1999) D. Paschek and A. Geiger, J. Phys. Chem. B 103, 4139 (1999).
- Frenkel and Smit (2002) D. Frenkel and B. Smit, Understanding Molecular Simulation. From Algorithms to Applications (Academic Press, San Diego, 2002), 2nd ed.
- Paschek and García (2004) D. Paschek and A. E. García, Phys. Rev. Lett. 93, 238105 (2004).
- Rick (2004) S. W. Rick, J. Chem. Phys. 120, 6085 (2004).
- (20) State swapping moves between two states and are accepted with a probability . Here, represents the set of scaled coordinates of the entire -particle system belonging to state . denotes the potential energy of configuration at volume , whereas represents the configurational energy belonging to at volume . Whether a state swapping move or an MD move is executed, is chosen at random with a probability of for selecting state swapping moves.
- (21) , , , , , , , , , , , , , , , , , , , at densities between and with an increment of .
- (22) Each replica represents a MD simulation of 256 molecules in the ensemble. The electrostatic interactions are treated by Ewald summation Essmann et al. (1995) with a cutoff of and a mesh with 4th order interpolation. Lennard-Jones cutoff corrections for energy and pressure were considered. A timestep was used. The simulations were carried out with GROMACS 3.2 (www.gromacs.org), modified by us to allow -state-swapping. The temperature tiling has been chosen to maintain an acceptance ratio of about for state swapping.
- Yamada et al. (2002) M. Yamada, S. Mossa, H. E. Stanley, and F. Sciortino, Phys. Rev. Lett. 88, 195701 (2002).
- Wagner and Pruß (2002) W. Wagner and A. Pruß, J. Phys. Chem. Ref. Data 31, 387 (2002).
- (25) P. H. Poole, private communication.
- Bellissent-Funel et al. (1987) M. C. Bellissent-Funel, J. Teixeira, and L. Bosio, J. Chem. Phys. 87, 2231 (1987).
- Finney et al. (2002) J. L. Finney, A. Hallbrucker, I. Kohl, A. K. Soper, and D. T. Bowron, Phys. Rev. Lett. 88, 225503 (2002).
- Kennan and Pollack (1990) R. P. Kennan and G. L. Pollack, J. Chem. Phys. 93, 2724 (1990).
- Fernandez-Prini and Crovetto (1989) R. Fernandez-Prini and R. Crovetto, J. Phys. Chem. Ref. Data 18, 1231 (1989).
- Paschek (2004b) D. Paschek, J. Chem. Phys. 120, 6674 (2004b).
- (31) When fitting the -data for Argon of Ref. Kennan and Pollack (1990).
- Garde et al. (1996) S. Garde, G. Hummer, A. E. García, M. E. Paulaitis, and L. R. Pratt, Phys. Rev. Lett. 77, 4966 (1996).
- Hummer et al. (2000) G. Hummer, S. Garde, A. E. García, and L. R. Pratt, Chem. Phys. 258, 349 (2000).
- Essmann et al. (1995) U. Essmann, L. Perera, M. L. Berkowitz, T. A. Darden, H. Lee, and L. G. Pedersen, J. Chem. Phys. 103, 8577 (1995).