Relaxation measurements in the regime of the second magnetization peak in Nb films
Abstract
We report on magnetic measurements as a function of field, temperature and time (relaxation) in superconducting Nb films of critical temperature K. The magnetic measurements as a function of field exhibited a ”second magnetization peak” (”SMP”) which in general is accompanied by thermomagnetic instabilities (TMIs). The lines where the ”SMP” occurs and the where the first flux jump in the virgin magnetization curves is observed, end at a characteristic point K, Oe). Relaxation measurements showed that for K the activation energy and the normalized relaxation rate exhibit non-monotonic behavior as a function either of temperature or field. The extrema observed in and coincide with the points or of the ”SMP”. In the regime K both and present a conventional monotonic behavior. These results indicate that the ”SMP” behavior observed in our Nb films is promoted by the anomalous relaxation of the magnetization.
pacs:
74.78.Db, 74.25.Ha, 74.25.Fy, 74.25.OpI Introduction
Recent magnetic studies in Nb films Esquinazi99 ; Kopelevich98 ; Stamopoulosnew reported the existence of a structure that reminisces of the second magnetization peak (SMP) which is usually observed in high- superconductors Zhukov95 ; Stamopoulos01 ; Stamopoulos02 ; Stamopoulos03 ; Sun00 ; Kupfer94 ; Janossy96 ; Pissas99 ; Pissas00 ; Sun02 ; Chowdhury03 ; Abulafia96 ; Miu00 ; KhaykovichPRL ; Kokkaliaris00 ; Giller97 . These studies concluded that for the case of Nb films the ”SMP” is probably motivated by thermomagnetic instabilities (TMIs) that occur in the low-temperature regime, far below the upper-critical field Esquinazi99 ; Kopelevich98 ; Stamopoulosnew . From the theoretical point of view, the understanding of the fundamental differences between the ”SMP” observed in Nb films and in high- superconductors is of great importance. In addition, the detailed experimental study of the TMIs that accompany the ”SMP” in Nb films is also very important, because these undesirable flux jumps constitute a serious limitation for basic practical applications.
Today, a detailed study of the dynamic response of vortices in the regime of the ”SMP” in Nb films is lacking. In this work we present detailed magnetic data and especially we study the relaxation of vortices in sputtered thick Nb films that exhibit the ”SMP”. We systematically recorded the lines where the ”SMP” occurs, where the first flux jump takes place in the virgin magnetization curves and where the first peak is observed. These three lines connect at a characteristic point K, Oe). For no flux jumps are observed and the magnetic curves are absolutely smooth. Interestingly, below a second characteristic point K, Oe) the line changes slope. In the regime TMIs are pronounced and the ”SMP” faints as the characteristic temperature is approached. In contrast, for TMIs are strongly suppressed. As a consequence, in this regime the magnetic curves are almost regular and the ”SMP” strongly resembles the respective feature observed in high- compounds. Detailed relaxation measurements, showed that the activation energy (normalized relaxation rate ) exhibits a maximum (minimum) as a function of temperature or field for K. The observed extrema are located exactly at the or points. In contrast, in the regime K a monotonic behavior is observed for both and . Although our results indicate that in Nb films the ”SMP” feature is simply motivated by an anomalous relaxation mechanism, the similarities of the observed behavior with the behavior observed in high- compounds calls for further theoretical and experimental work.
II Preparation of the films and Experimental details
The samples of Nb were sputtered on Si substrates as they were annealed during the deposition. Details on the preparation of the films are presented elsewhere Stamopoulosnew . The critical temperature of the film under discussion is K, equal to the one of high purity single crystals Finnemore66 . The residual resistance ratio is R( K)/R( K)= ( cm just above ). The thickness of the film is Å. Our combined x-ray diffraction (XRD) and transmission electron microscopy (TEM) data revealed that by annealing the films during deposition, a larger mean size of the grains is produced, which in this case is Å. Furthermore, the grains of the annealed films are oriented, in some degree, with direction perpendicular to the film’s surface. Our magnetic measurements either as a function of field, temperature or time were performed by means of a commercial SQUID magnetometer (Quantum Design). In all magnetic data presented below, the magnetic field was always normal to the surface of the film (). All the magnetic measurements were performed under zero field cooling (ZFC), so that we always obtained the virgin magnetization curves. In relaxation measurements the magnetization of the sample was recorded for a time window of sec sec. We examined the whole temperature-magnetic-field regime accessible by our SQUID ( kOe, K).
III Experimental results and discussion
III.1 TMIs and the ”SMP” in magnetic measurements
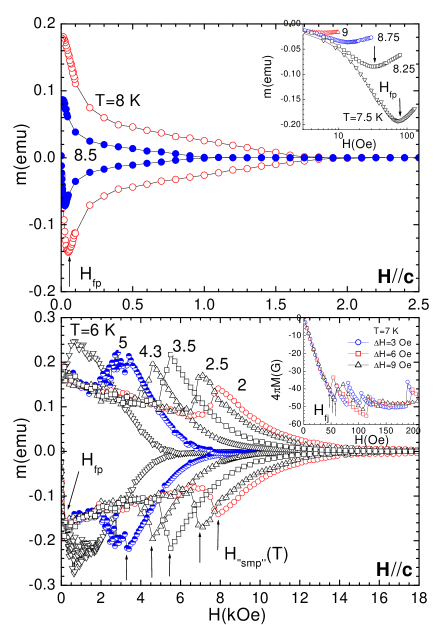
We start the presentation of our experimental results with the magnetic measurements as a function of field. Figures 1(a) and 1(b) present data in the high (upper panel) and in the low-temperature regime (lower panel). We see that close to (upper panel) the magnetic curves are smooth, while the loops at low temperatures (lower panel) are anomalous. More specifically, below the characteristic temperature K a ”noisy” first peak shows up which is accompanied by strong TMIs. As the temperature is gradually reduced this broad peak transforms into two separate peaks: a first maximum which occurs in low-field values, and a distinct second peak which is placed in high magnetic fields. We note that the magnetic loops performed in the interval K K exhibited strong TMIs. In this regime the ”SMP” is hardly observed. In contrast, for even lower temperatures K, the ”SMP” is pronounced and the TMIs are strongly suppressed. As a result the magnetic curves are more regular. The overall behavior resembles the SMP observed usually in high- superconductors Zhukov95 ; Stamopoulos01 ; Stamopoulos02 ; Stamopoulos03 ; Sun00 ; Kupfer94 ; Janossy96 ; Pissas99 ; Pissas00 ; Sun02 ; Chowdhury03 ; Abulafia96 ; Miu00 ; KhaykovichPRL ; Kokkaliaris00 ; Giller97 . For this reason we ”loosely” refer to these characteristic fields as . However, there are noticeable differences between the magnetic behaviors observed in our Nb film and in high- superconductors. In our case, below the ”SMP” () the response is ”noisy”, while above it () we observed smooth magnetic curves. In contrast, in point disordered high- superconductors the magnetization curves are smooth, both below and above the SMP. In addition, the peak value of the slightly decreases as we lower the temperature. In high- superconductors for lower temperatures the peak value of the SMP strongly increases. Finally, in our Nb film the resulting line ends on the first peak line at (see Fig. 3 below), while in high- superconductors the respective line ends near the irreversibility/melting line, or extends almost up to the critical temperature. In the respective inset of the upper (lower) panel we present measurements at low magnetic fields, for the demonstration of the first peak field (first flux jump field ).
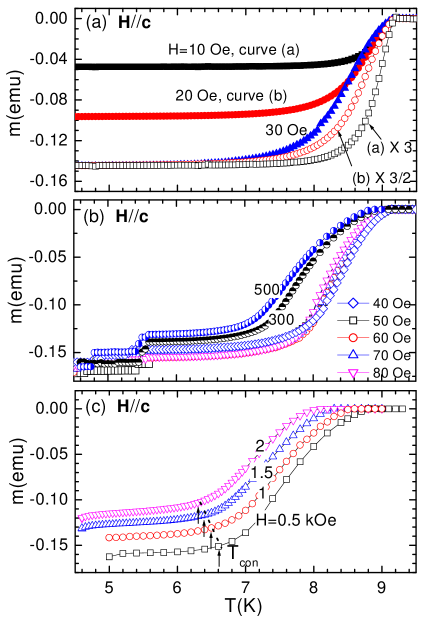
In Figs. 2(a)-(c) we present magnetic data as a function of temperature in various magnetic fields. In Fig. 2(a) we present data at low applied fields of the order of the first critical field. In addition to the raw data we also present two more curves that resulted after multiplying the original curves (a) and (b) (referring to and Oe) by a factor of and respectively. We clearly see that the behavior of the low temperature regime is the one expected in the Meissner state since the resulting curves coincide with the curve that refers to field Oe. In Fig. 2(b) we present data for intermediate field values. These data exhibit TMIs in the low temperature regime. Finally, in Fig. 2(c) we show representative results for comparatively high magnetic fields. We see that until some characteristic temperature the magnetic moment is almost constant, while above it () is strongly reduced. The characteristic points that come from these isofield measurements as a function of the temperature, coincide with the boundary above which TMIs are no longer observed as determined from isothermal magnetic loop measurements (see Fig. 3).
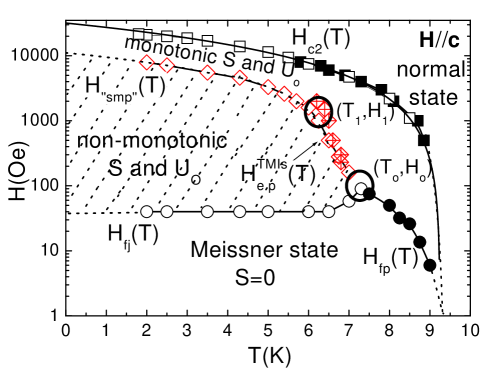
The resulted ”phase diagram” of vortex matter for the Nb film is presented in Fig. 3. Presented are the lines (rhombi), the first peak field (solid circles) and the first flux jump field (open circles). In addition, the upper-critical fields (squares) are presented. The upper-critical points were determined by comparative magnetic and magnetoresistance measurements (not shown here) Stamopoulosnew . As we see the , and lines connect at a characteristic point . We clearly see that in the temperature range K, where the line tends to overcome the first peak line , TMIs are no longer observed. In addition, in the regime K the experimental data for can’t be described by any of the proposed theoretical curves Stamopoulosnew . Interestingly, at the line changes slope. We must underline that as we move close to the point the ”SMP” is hardly observed. As a result, the part of the line that lies above the point K, simply refer to the boundary above which TMIs are not observed. Below K the line is placed in high fields, while the line takes the constant value Oe. This experimental result, of a temperature independent line, is in contrast to theoretical predictions Swartz68 ; Wipf6791 ; Mints81 ; Mints96 that treat the line as a simple boundary above which TMIs occur Stamopoulosnew .
III.2 Relaxation measurements in the regime of the ”SMP”
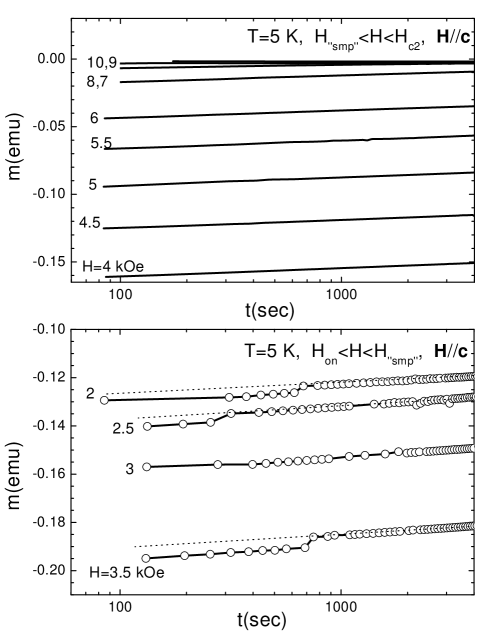
By measuring the magnetic moment as a function of time (relaxation measurements) new information may be gained about the pinning mechanism. Furthermore, additional information at (very short or long) times not accessible by a realistic experiment may be obtained, by extrapolating the measured curves. Of course, this is permitted under the assumption that the relaxation mechanism doesn’t change. Our main aim was the study of the dynamic behavior of vortices in the regime of the ”SMP”. To this end, we performed detailed relaxation measurements at temperatures . In addition, relaxation measurements were performed at temperatures where the ”SMP” is not observed, in order to be compared with the respective ones at . In Fig. 4 we show representative data at K for various fields kOe. In the upper (lower) panel we present results in the field regime above (below) the ”SMP” (see Fig. 6(a) below). It is clear that the magnetic moment relaxes according to a logarithmic law, as this is evident by its linear variation on a semilogarithmic plot. The curves of the upper panel are smooth and their slope changes slowly as the upper-critical field is approached. In the lower panel, where the measurements were performed in the regime of TMIs (see Fig. 6(a) below), small flux jumps are observed. These jumps are restricted in short measuring times. Interestingly, the slope of the curves below and above each jump is almost the same. Nevertheless, in such cases, in the processing of the data we took into account only the part of the curves placed above the jump.
Since we study a low- superconductor which exhibits logarithmic relaxation we used the classical Anderson-Kim model Anderson62 for the estimation of the activation energy and the respective normalized relaxation rate . For Anderson-Kim flux creep the potential barrier that vortices experience is linear on the applied current according to the relation . It comes out that the bulk screening currents that exist in the superconductor due to the pinning of vortices, relax according to a logarithmic law. The relaxation of the magnetization of a thin disk under a perpendicular magnetic field has been also treated analytically in Ref. Gurevich94, . In that work it was pointed out that in the regime of steady state relaxation (at times much higher than a characteristic transient time) the relaxing magnetization is independent of the initial conditions of the sweep rate of the applied field. The result obtained for the steady state relaxation is
| (1) |
where , and . In the above quantities is a characteristic microscopic attempt time, and are the thickness and the ”diameter” of the sample respectively and finally, is a threshold value of the electric field. By fitting the relaxation data we estimated the related pinning parameters and . In our fitting procedures we assumed that the attempt time is sec.
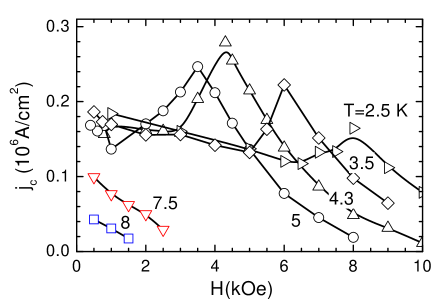
Figure 5 presents the estimated critical current density at various temperatures. We clearly see that for K presents a non-monotonic behavior, while at K a regular monotonic behavior is recovered. From these data we see that the ”SMP” feature is present even for the ”unrelaxed” magnetization (at very small times of the order of sec).
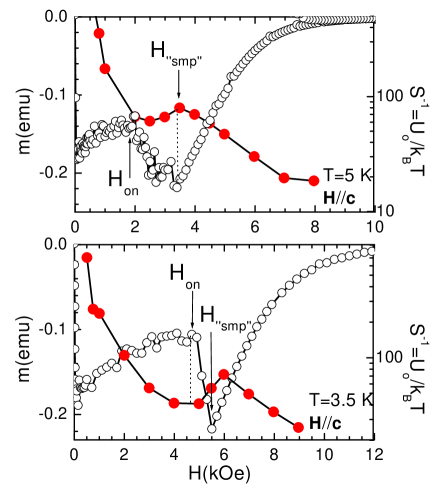
In Fig. 6 we present comparatively the magnetic loops and the estimated activation energy for various magnetic fields at K (upper panel) and K (lower panel). As we clearly see at very low magnetic fields, takes very high values (consequently takes very low values). When increasing the field, exhibits a non-monotonic behavior. More specifically, for K presents a maximum at exactly the point. At lower temperatures the maximum in was shifted in higher fields. For example, at K the maximum in is placed above the point, while the local minimum of is located at the onset point of the ”SMP”. The appearance of these extrema in (and also in ) means that there is an enhancement of the effective pinning in the regime of the ”SMP”. In a recent article H. Kupfer et al. Kupfer94 discussed relaxation as a possible origin of the SMP in YBa2Cu3O7+δ single crystals. They proposed that the SMP could originate from a crossover between different relaxation mechanisms. Faster relaxation in the low field regime could lead to a suppression of the measured curves (that relax during the measurement), while slower relaxation at higher fields would restore higher values of the measured magnetization. As a consequence a SMP could be obtained. Under this point of view, if was determined mainly by relaxation, a maximum of should correspond to a minimum in and a maximum in . In the experiments of Ref. Kupfer94, the minimum in (maximum in ) was observed at a characteristic field , placed well below the maximum point of the SMP. As a result the relaxation origin of the SMP in YBa2Cu3O7+δ single crystals remained a doubtful possibility. In our case, we see that both extrema of are closely related to the onset and the maximum of the ”SMP”. This could indicate that in contrast to YBa2Cu3O7+δ, in our case the ”SMP” feature could originate from an anomalous relaxation process as the magnetic field increases. Soon after, Y. Abulafia et al.Abulafia96 proposed that the anomalous behavior of and could be ascribed to a change in the dynamic response of vortices at . They proposed that for the response of vortex system was elastic, while for the increase of (decrease of ) should be caused by plastic deformations of the vortex solid Abulafia96 . Since then, many experimental works confirmed this notion in YBa2Cu3O7+δ and in other high- compounds as HgBa2CuO4+δ and Tl2Ba2CaCu2O8 Kupfer94 ; Janossy96 ; Pissas99 ; Pissas00 ; Sun02 ; Chowdhury03 . More specifically, in high- compounds for fields the activation energy follows a negative power-law with Abulafia96 ; Pissas99 ; Miu00 ; Sun02 ; Chowdhury03 . In our case we observed that above the ”SMP” the activation energy may be described by a power-law with . This value is very high and probably inconsistent with the notion of plastic vortex creep. The differences between the relaxation process observed in Nb films and in high- compounds as discussed above, may give additional evidence that the feature of the second peak effect is motivated by different physical mechanisms.
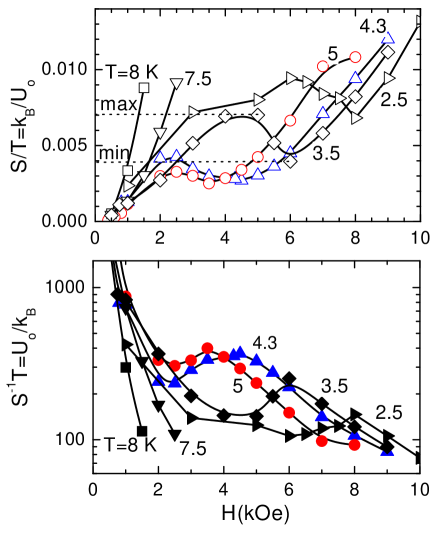
The relaxation measurements performed in temperatures K showed different behavior. In Fig. 7 we present comparative data for (upper panel) and (lower panel) at K (below ) and at K (above ). In the upper panel we observe that the difference of the two extrema (as presented for example for the curve referring to K) is higher at low temperatures. We may then conclude that as the characteristic temperature K is approached, the extrema in and are suppressed and eventually disappear at . Furthermore, we observe that both and exhibit opposite dependence on in the regimes below and above the ”SMP” points. For () is an increasing (decreasing) function of temperature, while for both and are non-monotonic as a function of temperature. This means that for both and exhibit extrema not only as a function of field but also as a function of temperature. In contrast, in the temperature regime above the behavior is completely different. As we see at and K both and present a conventional monotonic behavior as they approach the upper-critical field .
IV conclusions
In summary, we presented magnetic measurements as a function of field, temperature and time in films of the isotropic Nb superconductor prepared by annealing during the deposition. In measurements as a function of field we observed a ”SMP” feature, while TMIs in the magnetic moment were observed either as a function of field, temperature and time. The three lines , and connect at a characteristic point K, Oe). Below K, Oe) the line changes slope. Pronounced TMIs are observed for K K, while below the magnetic curves are almost regular. Interestingly, in this low-temperature regime , the first flux jump field preserves a constant value Oe. This is in strong disagreement to theoretical proposals for thin film, or even bulk samples and remains to be explained.
Relaxation measurements showed that below K both the activation energy and the normalized relaxation rate present a non-monotonic behavior either as a function of temperature or the applied field. The observed extrema in and are located at the onset or the peak points of the ”SMP”. This is a noticeable difference comparing to high- superconductors where the respective features are observed at a characteristic field placed well below the SMP point. This could give additional evidence that the ”SMP” observed in Nb films is of different origin than the respective feature observed in high- compounds. Although we are not able to reveal the underlying mechanism that motivates the ”SMP”, our results indicate that the ”SMP” in Nb films is accompanied by an anomalous relaxation of vortices. In contrast to high- compounds, in Nb films this anomalous relaxation could even be the driving cause of the observed ”SMP”.
Although of different underlying physical mechanisms, the similarities of the presented phase diagram of vortex matter of our Nb disordered film with the phase diagrams observed in high- compounds calls for further experimental and theoretical investigation.
Acknowledgements.
A. Speliotis should be gratefully acknowledged for useful contribution in the preparation of samples.References
- (1) P. Esquinazi, A. Setzer, D. Fuchs, Y. Kopelevich, E. Zeldov and C. Assmann, Phys. Rev. B 60 (1999) 12454.
- (2) Y. Kopelevich, and P. Esquinazi, J. Low Temp. Phys. 113 (1998) 1.
- (3) D. Stamopoulos, A. Speliotis, and D. Niarchos, Supercond. Sci. Technol. 17 (2004) 1261.
- (4) H. Kupfer, S.N. Gordeev, W. Jahn, R. Kresse, R. Meier-Hirmer, T. Wolf, A.A. Zhukov, K. Salama, and D. Lee, Phys. Rev. B 50 (1994) 7016.
- (5) A.A. Zhukov, H. Kupfer, G. Perkins, L.F. Cohen, A.D. Caplin, S.A. Klestov, H. Claus, V.I. Voronkova, T. Wolf and H. W hl, Phys. Rev. B 51 (1995) 12704.
- (6) B. Janossy, L. Nguyen, and P. Wyder, Phys. Rev. B 53 (1996) 11845.
- (7) Y. Abulafia, A. Shaulov, Y. Wolfus, R. Prozorov, L. Burlachkov, Y. Yeshurun, D. Majer, E. Zeldov, H. W hl, V.B. Geshkenbein, and V. M. Vinokur, Phys. Rev. Lett. 77 (1996) 1596.
- (8) B. Khaykovich, E. Zeldov, D. Majer, T.W. Li, P.H. Kes, and M. Konczykowski Phys. Rev. Lett. 76 (1996) 2555.
- (9) D. Giller et al., Phys. Rev. Lett. 79 (1997) 2542; D. Giller, A. Shaulov, Y. Yeshurun, and J. Giapintzakis, Phys. Rev. B 60 (1999) 106.
- (10) M. Pissas, D. Stamopoulos, E. Moraitakis, G. Kallias, D. Niarchos, and M. Charalambous, Phys. Rev. B 59 (1999) 12121.
- (11) M. Pissas, E. Moraitakis, G. Kallias, and A. Bondarenko, Phys. Rev. B 62 (2000) 1446.
- (12) Y.P. Sun, Y.Y. Hsu, B.N. Lin, H.M. Luo, and H.C. Ku, Phys. Rev. B 61 (2000) 11301.
- (13) L. Miu, E. Cimpoiasu, T. Stein, and C.C. Almasan, Physica C 334 (2000) 1.
- (14) S. Kokkaliaris, A.A. Zhukov, P.A.J. de Groot, R. Gagnon, L. Taillefer, T. Wolf, Phys. Rev. B 61 (2000) 3655.
- (15) D. Stamopoulos and M. Pissas, Supercond. Sci. Technol. 14 (2001) 844.
- (16) D. Stamopoulos and M. Pissas, Phys. Rev. B 65 (2002) 134524.
- (17) D. Stamopoulos, M. Pissas, and A. Bondarenko, Phys. Rev. B 66 (2002) 214521.
- (18) Y.P. Sun, W.H. Song, J.J. Du, and H.C. Ku, Phys. Rev. B 66 (2002) 104520.
- (19) P. Chowdhury, Heon-Jung Kim, W.N. Kang, Dong-Jin Zang, Sung-Ik Lee, and H. Kim, Phys. Rev. B 68 (2003) 134413; P. Chowdhury, Heon-Jung Kim, In-Sun Jo, and Sung-Ik Lee, Physica C 384 (2003) 411.
- (20) D.K. Finnemore, T.F. Stromberg, and C.A. Swenson, Phys. Rev. 149 (1966) 231.
- (21) R.G. Mints and E.H. Brandt, Phys. Rev. B 54 (1996) 12421.
- (22) S.L. Wipf, Phys. Rev. 161 (1967) 404;ibid Cryogenics 31 (1991) 936.
- (23) R.G. Mints and A.L. Rakhmanov, Rev. Mod. Phys. 53 (1981) 551.
- (24) P.S. Swartz and C.P. Bean, J. Appl. Phys. 39 (1968) 4991.
- (25) P. W. Anderson, Phys. Rev. Lett. 9, (1962) 309; P.W. Anderson and Y.B. Kim., Rev. Mod. Phys. 36 (1964) 39.
- (26) A. Gurevich and E. H. Brandt, Phys. Rev. Lett. 73 (1994) 178.