[
Uncorrelated and correlated nanoscale lattice distortions in the paramagnetic phase of magnetoresistive manganites
Abstract
Neutron scattering measurements on a magnetoresistive manganite La0.75(Ca0.45Sr0.55)0.25MnO3 show that uncorrelated dynamic polaronic lattice distortions are present in both the orthorhombic (O) and rhombohedral (R) paramagnetic phases. The uncorrelated distortions do not exhibit any significant anomaly at the O-to-R transition. Thus, both the paramagnetic phases are inhomogeneous on the nanometer scale, as confirmed further by strong damping of the acoustic phonons and by the anomalous Debye-Waller factors in these phases. In contrast, recent x-ray measurements and our neutron data show that polaronic correlations are present only in the O phase. In optimally doped manganites, the R phase is metallic, while the O paramagnetic state is insulating (or semiconducting). These measurements therefore strongly suggest that the correlated lattice distortions are primarily responsible for the insulating character of the paramagnetic state in magnetoresistive manganites.
pacs:
PACS numbers: 71.38.Ht, 71.30.+h, 72.10.Di]
I Introduction
Transition metal oxides exhibit a number of unusual phenomena, such as high-temperature superconductivity, colossal magnetoresistance (CMR), and phases possessing charge or orbital order. In many of these cases, competition between various magnetic and electronic ground states gives rise to electronically inhomogeneous states, with characteristic length scales varying from microns to nanometers [1]. The physical properties of these states are often sensitive to small changes in the external conditions, such as an applied magnetic field or pressure, thus giving rise to a number of the “colossal” effects. One of the best known examples of such an effect is the CMR effect in perovskite manganites MnO3 [2]. In these compounds, application of a magnetic field induces a transition from a paramagnetic insulating (PI) to a ferromagnetic metallic (FM) state. The large difference between the resistivities of these two phases lies at the heart of the CMR effect. The metallic nature of the FM phase has been explained within the framework of the double-exchange mechanism [3]. The physical properties of the PI state, however, still remain poorly understood.
It is now well established that nanoscale inhomogeneities resulting from electron-lattice coupling play a key role in the PI state in manganites [1]. There is a significant amount of experimental evidence that small lattice polarons are present in this state [4, 5, 6, 7]. In a simplified model, a lattice polaron forms when an electron localizes on a Mn3+ ion, and the surrounding oxygen octahedron distorts due to the Jahn-Teller (JT) effect. Mn4+ ions, which contain three localized electrons in the orbitals, are JT inactive, and Mn4+O6 octahedra remain undistorted. In the vicinity of the “optimal” doping 0.3, at which the CMR effect is large, the nominal concentrations of the Mn3+ and Mn4+ ions (1- and , respectively) are comparable. Thus, it is natural to expect that at these dopings the polarons will interact with each other through their overlapping long-range lattice distortions. Structural correlations attributed to such an interaction have indeed been observed in neutron and x-ray diffraction experiments in a broad range of doping levels 0.20.5 [8, 9]. These correlations are very short-range, with a correlation length of several lattice constants (10-30 ). It was proposed that the correlated regions exhibit CE-type and striped charge and orbital ordered structures similar to those found in manganites possessing long-range charge and orbital order [9]. However, some recent experiments are inconsistent with this simple model [10], and the detailed structure of the correlated regions has not been established thus far.
Both correlated and uncorrelated polaronic distortions are believed to affect the transport properties of CMR manganites [1]. In particular, these distortions have been associated with the enhanced electrical resistivity of the PI state in orthorhombic manganites. It was found that the polaronic distortions disappear on the transition from the PI to the FM state, which can be induced either by decreasing temperature, or by an applied magnetic field. However, the specific roles of the correlated and uncorrelated distortions in the PI state have not been determined thus far.
To study these roles, one needs to compare paramagnetic phases with and without polaronic correlations, preferably in the same sample. An elegant way to carry out such a study is made possible by the fact that the paramagnetic state in CMR manganites exhibits two different pseudo-cubic perovskite structures: an orthorhombic (O) and a rhombohedral (R) phase [2, 11, 12]. The MnO6 octahedra in the O phase are distorted, and this distortion is usually explained by electron-lattice coupling via the Jahn-Teller effect. The MnO6 octahedra in the average structure of the R phase determined by powder diffraction, on the other hand, are undistorted [11]. There is evidence, however, that dynamic JT distortions are still present in the R phase [6, 12, 13]. Interestingly, polaronic correlations have been found thus far only in the orthorhombic PI phase [10]. Therefore, a sample exhibiting an O-to-R transition in the paramagnetic state provides an ideal system for investigation of effects of polaronic correlations on various physical properties.
In this work, we investigate properties of correlated and uncorrelated polaronic distortions in La0.75(Ca0.45Sr0.55)0.25MnO3 using elastic and inelastic neutron scattering. This compound undergoes an O-to-R transition within the paramagnetic state. We find that uncorrelated polaronic distortions are present in both the O and R insulating phases. These distortions are dynamic (quasielastic) with the characteristic lifetime 120 fs, and do not show any significant anomaly at the O-to-R transition temperature . Single polarons, therefore, do not appear to play any significant role in this transition. The polaronic correlations exhibit a significantly larger lifetime 600 fs. According to recent x-ray measurements, these correlations are present only in the O phase, and disappear abruptly at [10]. Since structural changes at are small, we argue that the drop in the electrical resistivity at the O-to-R transition can be explained by the disappearance of the slowly fluctuating polaronic correlations. At doping levels near the optimal level of 0.3, the paramagnetic R phase is usually described as metallic, while the O state is insulating or semiconducting. Thus, our data strongly suggest that the correlated lattice distortions play the primary role in the microscopic mechanism explaining the insulating character of the paramagnetic state in the CMR manganites.
II Experimental Procedures
A single crystal of La0.75(Ca0.45Sr0.55)0.25MnO3 was grown using the floating zone technique. Polycrystalline La0.75(Ca0.45Sr0.55)0.25MnO3 was prepared using standard solid state reaction techniques. With increasing temperature, La0.75(Ca0.45Sr0.55)0.25MnO3 undergoes two transitions: firstly a FM to orthorhombic PI transition at 300 K, and then a structural transition to a paramagnetic rhombohedral state at 360 K. The electrical resistivity shows an abrupt drop of approximately 20% at the first-order O-to-R transition [10].
Neutron scattering measurements were performed using the BT-2 thermal triple-axis spectrometer at the NIST center for neutron research. 60′-40′-S-40′-80′ collimation and fixed final energies of 14.8 meV (inelastic measurements) and 30.5 meV (elastic measurements) were used. PG filters were used when appropriate to suppress higher-order wavelength contamination. Powder diffraction measurements were performed using the BT-1 powder diffractometer. A Cu (311) monochromator, =1.5403(2) , and 15′-20′-S-7′ collimation were utilized. The samples were mounted in a closed-cycle refrigerator (30-400 K). Crystal structure refinements were carried out using the GSAS program [14]. Refinements with isotropic temperature parameters for all atoms, and with anisotropic parameters for oxygens were performed. In this paper, we use the orthorhombic notation, in which the , , and axes run along the (1,1,0), (1,-1,0), and (0,0,1) cubic perovskite directions, respectively. Scattering vectors (,,) are given in reciprocal lattice units.
III Results
A Powder Diffraction
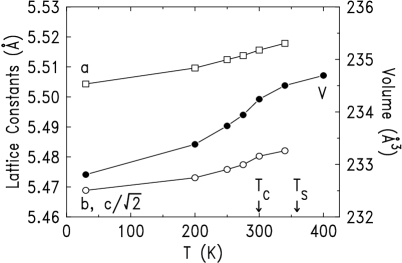
As shown in the next Section, general crystallographic data are needed to understand the results of the experiments with single crystals. Therefore, we first discuss the temperature-dependent parameters of the average structure obtained in the powder diffraction experiments. Figure 1 shows temperature dependence of the lattice parameters and of the unit cell volume. The observed anomaly at is consistent with previously reported results [15]. In Fig. 2, temperature parameters for the apical oxygen atom O(1) and the in-plane oxygens O(2) are shown (see the inset in Fig. 2 for the explanation of this notation). In a perfect crystal, these parameters reflect thermal vibrations of the atoms, and therefore grow with temperature. However, it is well known that in CMR manganites, the observed temperature dependence of the temperature parameters cannot be accounted for by the lattice expansion [12, 15]. According to the phenomenological model discussed in Ref. [15], the Debye-Waller factors in a non-anomalous crystal are related to volume by . Here , is the rms thermal displacement, and is the Grüneisen constant, which for most materials is between 2 and 3. Using the values of and shown in Figs. 1 and 2, we find unphysically large values of the effective Grüneisen constant 50.
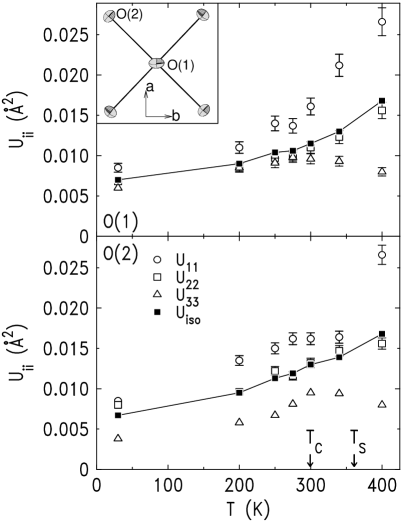
Thus, the volume expansion is too small to account for the anomalously large change of the thermal parameters with temperature. Anomalous enhancement of the thermal parameters in the PI phase is usually attributed to the dynamic JT effect [12, 15]. It can also result from presence of static nanoscale lattice distortions. Irrespective of the exact origin of this anomalous behavior, it reflects the presence of local imperfections (static or dynamic) in the crystal structure. We conclude, therefore, that both the O and R insulating states are inhomogeneous. Importantly, the thermal parameters continue their anomalous increase above . Thus, local lattice distortions, most likely dynamic JT polarons, are present in the R state, even though the MnO6 octahedra are undistorted in the average long-range R structure.
In addition to the isotropic parameters , we show in Fig. 2 anisotropic temperature parameters . To illustrate the true anisotropy of the thermal ellipsoids, the parameters shown in Fig. 2 are calculated in the basis of the major axes of these ellipsoids. Thus, represent the lengths of the major axes. The exact values of the often depend on the details of the structural refinement, and therefore may be unreliable. However, they may provide valuable qualitative information about the character of the thermal motion in the system. Specifically, the data of Fig. 2 show that the apical oxygens O(1) exhibit conventional isotropic thermal displacements at low temperature in the FM state. However, these displacements quickly become very anisotropic in the PI state. The inset in Fig. 2 shows that the largest thermal displacements of O(1) at T=340 K occur along the orthorhombic direction. It also shows that the smallest dispacements of the O(2) in-plane atoms are approximately collinear with the Mn-O bonds. These data suggest that the JT polarons are accommodated in the crystal lattice via tilts of the MnO6 octahedra in which the apical oxygens shift in the direction bisecting the Mn-O-Mn angle. Interestingly, the large JT distortions of the MnO6 octahedra characteristic to the static orbital order found in the half-doped manganites are also accommodated via staggered tilts in the same direction [16]. Combined together, these observations indicate that the most energetically favorable way to accommodate a polaron in the perovskite structure of a CMR manganite is via the tilt of the MnO6 octahedron in the cubic (110) direction. Finally, we note that strong anisotropy of the oxygen thermal motions is also found in the R phase. At this stage, we do not present any simple model describing thermal displacements in this phase.
In summary, the above results show that the paramagnetic state exhibits significant local distortions (static or dynamic) of the crystal lattice. This is in agreement with previously reported measurements [12, 15]. Interestingly, the local distortions are clearly present in the R phase, even though the JT distortions are not present in the average crystallographic structure. Below, it is shown that the local distortions in this phase are associated with the dynamic JT effect. Finally, the atomic positions and temperature parameters are determined at various temperatures. We use these data to analyze the results discussed in the following Sections.
B Single Crystal Experiments
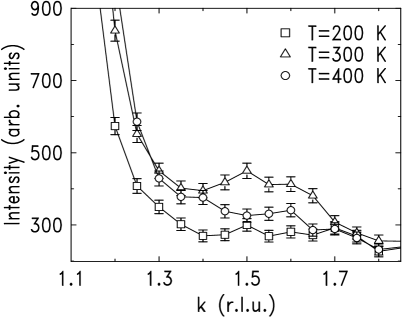
To investigate the temperature-dependent properties of the correlated and uncorrelated local lattice distortions, single crystal elastic and inelastic neutron scattering measurements were carried out. Figure 3 shows elastic scans in the (5, , 0) direction taken in all the three phases found in La0.75(Ca0.45Sr0.55)0.25MnO3: FM (=200 K), orthorhombic paramagnetic (=300 K), and rhombohedral paramagnetic (=400 K). A broad peak at 1.5 at =300 K is attributed to polaronic correlations [8, 9]. In agreement with a recent x-ray diffraction study [10], we observe this peak only in the orthorhombic phase. For , additional scattering intensity centered at =1 (reduced =0) and extending over most of the Brillouin zone is observed. This scattering is conventionally attributed to scattering from uncorrelated polaronic distortions described as Jahn-Teller polarons [7].
To characterize temperature-dependent dynamic properties of the local lattice distortions, we have carried out fixed-energy -scans in the vicinity of =(4, 0.5, 0), and energy scans at the fixed scattering vector =(4, 0.45, 0) using fixed final energy =14.8 meV. These parameters were chosen to maximize the experimental resolution and signal intensity. Unfortunately, elastic -scans were unobtainable at this configuration because of instrumental limitations.
We first address the dynamic properties of the correlated lattice distortions. Figure 4 shows scans in the (4, , 0) direction taken at various energy transfers . The peak due to the correlated distortions is clearly observed in the =0.5 meV scan. This scan contains a significant elastic contribution (the instrumental energy half-width for elastic scattering is approximately 0.75 meV). The data of Fig. 4 were fitted to a sum of a Gaussian line shape and a monotonically sloping background, the latter described by a power-law function. The width and the position of the peak were determined at =0.5 meV and then kept fixed for higher energies. The inset in Fig. 4 shows the intensity of the correlated peak extracted from these fits at various energy transfers. The data shown in the inset were fitted to a Lorentzian peak shape convoluted with the experimental resolution. The solid line in the inset shows the result of this fit. The obtained intrinsic Lorentzian width for the correlated scattering is =0.90.15 meV. This fit gives the =0 intensity that is only 10% larger than that for =0.5 meV. On the other hand, the inelastic scans shown in Fig. 5 indicate that the intensity for =0 is typically about 30-40% larger than that for =0.5 meV. One can, therefore, speculate that the fit of Fig. 4 overestimates the value of . Leaving the speculations aside, our measurements set an upper limit for at 1.1 meV. Thus, the structural correlations, while not completely static, exhibit the characteristic lifetime exceeding 600 fs. We note that in bi-layered manganites, the corresponding lifetime was found to be an order of magnitude smaller [17]. The correlated regions, therefore, fluctuate quite slowly in our sample.
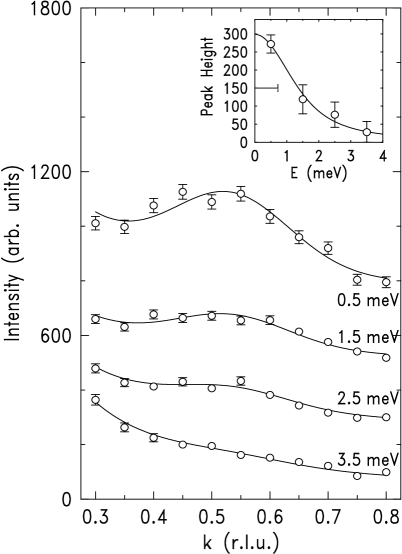
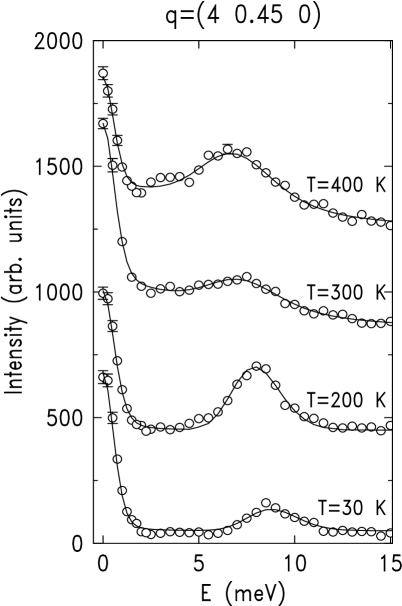
Figure 5 shows energy scans at several representative temperatures at =(4, 0.45, 0). At this , a significant signal from the correlated distortions is observed (see Fig. 4), while no background due to possible /2 contamination is present. Also, because of the proximity of a strong Bragg peak (4, 0, 0), a significant signal due to the uncorrelated distortions should be present at this . For , the scans of Fig. 5 show only an elastic peak at =0, and a resolution-limited transverse acoustic (TA) phonon peak at 8 meV. This scattering pattern changes dramatically as temperature is increased above . Firstly, a broad quasielastic scattering signal appears. Secondly, the TA phonon peak broadens, indicating that the phonons are damped. To analyze these data, one therefore should consider contributions from truly elastic scattering, from the TA phonon, and two quasielastic contributions: one from the correlated distortions with 1 meV, and the second from the broad peak appearing for . Fits containing all these contributions did not converge well. Instead, we fitted the data to a sum of a nearly elastic peak whose Lorentzian width was refined in the fits, a broad Lorentzian quasielastic peak, and a TA phonon peak. The fits were convoluted with the instrumental resolution. The obtained fits are shown as solid lines in Fig. 5. In this procedure, the correlated scattering is effectively included in the nearly-elastic peak, as shown below. Importantly, the temperature-dependent properties of the broad quasielastic feature are not affected significantly by the choice of the fitting algorithm at low energies. This feature is the main subject of interest below, and therefore the adopted fitting procedure is adequate for the purposes of this paper.
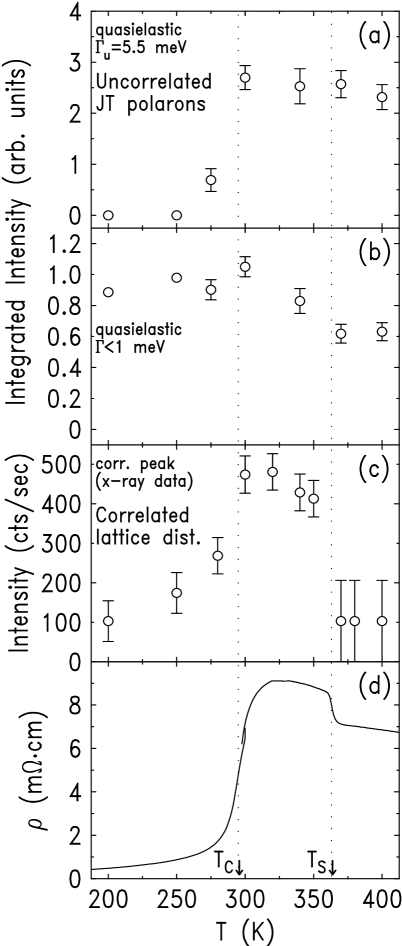
The Lorentzian width of the broad quasielastic feature determined from the data of Fig. 5 is =5.50.5 meV. The energy-integrated intensity of this feature is shown in Fig. 6(a). The quasielastic scattering is present only for . Importantly, it does not exhibit any appreciable anomaly at . Energy-integrating x-ray experiments, on the other hand, show that the structural correlations abruptly disappear at the O-to-R transition [10]. Thus, the quasielastic intensity shown in Fig. 6(a) does not contain any significant contribution from the structural correlations. We therefore conclude that this intensity originates from the uncorrelated structural distortions.
The temperature dependence of the nearly-elastic integrated intensity is shown in Fig. 6(b). The Lorentzian width of this feature was found to be 0.1 meV for and , and 0.2-0.3 meV for . This intensity contains contributions from the correlated lattice distortions, temperature-dependent incoherent scattering, as well as a possible contribution due to static uncorrelated polarons. This temperature dependence exhibits a certain resemblance to the temperature-dependent x-ray intensity of the correlated peak shown in Fig. 6(c). In particular, the nearly-elastic intensity in the R phase is smaller than that in the O state. Such a drop in intensity cannot be caused by the variation in the incoherent scattering. Indeed, using the Debye-Waller factors determined in our powder diffraction measurements, we find [18] that the incoherent scattering changes linearly with temperature, decreasing by less than 10% as the temperature increases from 300 K to 400 K. However, while a certain measurable contribution of the correlated scattering appears to be present in the data of Fig. 6(b), the nearly-elastic component is clearly dominated by the background effects. Nevertheless, the data of Fig. 6(b) can be used to make an estimate of the upper limit for the integrated intensity due to the correlated distortions by measuring the difference between the intensities in the O and R phases. The combined data of Figs. 6 (a) and (b) clearly show that the integrated intensity due to the dynamic uncorrelated distortions exceeds this upper limit by at least a factor of 5. The uncorrelated dynamic polarons are, therefore, the dominant component of the local lattice distortion for .
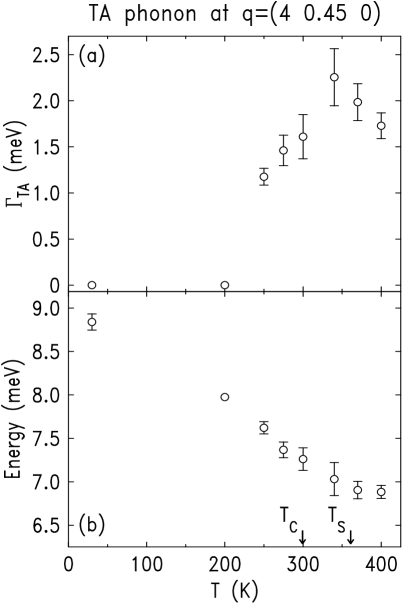
Finally, we show the intrinsic width and the energy of the TA phonon at =(4, 0.45, 0) in Fig. 7. The phonon acquires finite lifetime for . As discussed below, this is the result of the presence of the structural inhomogeneities in the paramagnetic phase.
IV Discussion
The above measurements indicate that dynamic single polarons are the dominant component of the local lattice distortion in the paramagnetic state in our sample. We cannot exclude that some of the uncorrelated polarons are static, but the comparison of the raw integrated intensities of the elastic and inelastic scattering (Fig. 6) shows that the large majority of the uncorrelated polarons are dynamic. The characteristic lifetime of the polaronic distortions is 120 fs. Both the O and R paramagnetic phases exhibit the uncorrelated lattice distortions, and no significant anomaly in the quasielastic scattering is observed at . The dynamic polarons are absent in the FM phase.
The physical properties showing anomalous behavior in both the O and R paramagnetic states should, therefore, be associated with the effects of the dynamic uncorrelated polarons. Firstly, these are the anomalously large Debye-Waller factors. The second anomalous effect observed only in the paramagnetic state is damping of the acoustic phonons, that acquire a finite lifetime of 300-400 fs for (see Fig. 7). Because acoustic phonons provide a major contribution to the thermal conductivity in manganites [20, 4], this damping may be an important factor leading to its strong reduction in the paramagnetic phase [21]. We note that an even more dramatic damping of the optical Jahn-Teller phonon modes in related manganite compounds has been reported [17, 22]. All these effects are, of course, natural consequences of the presence of local inhomogeneities in the crystal lattice. In fact, phonon anomalies similar to those found in the manganites have been seen in several other systems exhibiting nanoscale inhomogeneities. In perovskite ferroelectric relaxors [23], for example, anomalous phonon spectrum and phonon damping effects have been explained by the presence of nanoscale lattice inhomogeneities described as “polarized nanoscale regions” [24].
Another anomalous property of our sample is a very significant dependence of the TA phonon energy on temperature in both the ferromagnetic and the paramagnetic phases (see Fig. 7). It is unclear whether this effect can be associated with the local structural inhomogeneities. Indeed, the temperature dependence of the phonon energy does not exhibit any significant anomaly at , at which both the correlated and uncorrelated local lattice distortions appear. At this stage, we can only note that the observed phonon softening cannot be explained by the conventional effects of lattice unharmonicity. Thermal expansion of a crystalline lattice does give rise to a shift in the phonon frequency , where is the Grüneisen constant, is the linear expansivity, and is the phonon frequency [18]. However, using the data of Figs. 1 and 7, we obtain unphysically large values for the Grüneisen constant 20. The origin of the observed softening of the TA phonon, therefore, remains to be clarified.
We now discuss the correlated lattice distortions. Compared with the uncorrelated polarons, these distortions fluctuate very slowly. Indeed, their characteristic lifetime is larger than 600 fs, thus exceeding the lifetime of the uncorrelated polarons by more than a factor of 5. As the x-ray data of Fig. 6(c) show, the correlated distortions are present only in the O phase. The increased electrical resistivity of the O phase [Fig. 6(d)] should therefore be associated with the presence of the correlated distortions. Indeed, the uncorrelated polarons do not show any anomaly at , and the differences between the average structures of the O and R phases are too small to explain the observed changes of at . To provide a quantitative estimate of the possible effects of the structural change on the electrical resistivity, we note that the electronic bandwidth in manganites is proportional to , where =(Mn-O-Mn)/2, is the Mn-O bond length, and Mn-O-Mn is the Mn-O-Mn angle [19]. Using the structural data obtained in our powder diffraction measurements, we find that the difference in the bandwidths of the R and O phases due to their structural differences is smaller than 0.3%. While this argument is not strict in the case of the nonmetallic paramagnetic state, it does show that the structural changes that take place at have a negligible effect on the overall electronic band structure. In principle, it should also be possible to make a numerical estimate for the effects of the structural correlations on the electrical resistivity [25]. Such estimates require, however, knowledge of the exact structure of the correlated regions and their concentration, which are unknown at this stage.
Summing up, it is the presence of the correlated lattice distortions that distinguishes the O and R paramagnetic phases in our sample on the microscopic level [10]. While both the uncorrelated and the correlated distortions should contribute to the increased electrical resistivity of the paramagnetic state, the larger resistivity of the O phase stems from the presence of the correlated distortions. This is the central result of our work.
To understand the significance of this result, we consider the relationship between the average lattice symmetry and bulk properties of the “optimally-doped” CMR manganites (0.3). Our sample has composition La1-x(Ca1-ySry)xMnO3 with =0.25 and =0.55. The phase diagram of this compound family [26] for 0.3 is sketched in Fig. 8(a). As increases from 0 to 1, the average structure changes from the orthorhombic to rhombohedral in a first-order transition at 0.5. The paramagnetic state is insulating (semiconducting) in the O phase, while it is metallic on the R side of the phase boundary [26]. Recent x-ray data [10] show that the correlated distortions are present only in the O state. Thus, the insulator-metal transition that the paramagnetic phase undergoes with increasing is associated with the destruction of the correlated lattice distortions. These data, combined with our characterization of the uncorrelated distortions and the structural changes at , strongly suggest that it is the presence of the correlated lattice distortions that renders the paramagnetic phase insulating.
Further experiments are needed to establish whether these results can be generalized to all the perovskite manganites. We believe, however, that there is sufficient evidence in hand to warrant a proposal for the microscopic mechanism explaining the observed variation of the properties of the paramagnetic phase in optimally doped (0.3) manganites. In Fig. 8(b), a sketch of the general phase diagram of 0.3 perovskite manganites is shown [27, 28]. As the tolerance factor (defined as ) increases, the system undergoes a structural transition from the orthorhombic to the rhombohedral phase. Extensive measurements of bulk properties [28] indicate that electron-lattice coupling effects play a much more significant role on the orthorhombic side of the phase diagram. A large number of anomalous properties, such as large volume and magnetic entropy changes at , high magnetostriction, and the largest values of magnetoresistance (CMR) are observed in the orthorhombic phase. These anomalies are absent or strongly reduced in the rhombohedral state [28]. Correlated lattice distortions have been found in a large number of orthorhombic perovskite manganites with different compositions [8, 9]. No significant lattice correlations have been reported thus far in the rhombohedral state [10]. These observations cover a significant part of the phase diagram of Fig. 8(b), from the narrow-bandwidth Pr0.7Ca0.3MnO3 (0.905) to the large-bandwidth La0.7Sr0.3MnO3 (0.93). In addition, combined results of Ref. [10] and this work clearly show that it is the correlated distortions, and not single polarons, that distinguish the R and O states on the microscopic level in a sample undergoing the O-to-R transition in the paramagnetic phase. We believe that these observations allow us to propose that the observed drastic differences between the properties of the paramagnetic O and R states in hole-doped manganites stem from the presence of the correlated lattice distortions in the O phase.

If this proposal is valid, the question arises: does the presence of the correlated lattice distortions distinguish the metallic and the insulating paramagnetic states in manganites? Indeed, for 0.3, the R phase is usually described as a metal, while the O phase is considered an insulator [2]. These conclusions are made on the basis of the temperature dependence of the electrical resistivity. We note that in our sample, the resistivity exhibits an insulator-like behavior, decreasing with increasing temperature in both the O and the R phases, see Fig. 6(d). One possible explanation for this behavior is that the doping level in our sample, =0.25, is lower than the optimal level. In addition, the temperature dependence of the resistivity at high temperatures may not be a good indicator of whether the state can be considered metallic or not. In fact, it may not even be possible to clearly distinguish a bad metal from a bad insulator based only on the high-temperature data. A Mott insulator, for example, shows a continuous crossover from bad metal to bad insulator with decreasing band width at high temperatures [29]. Thus, the scenario in which the structural O-to-R transition in the paramagnetic state is associated with an insulator-metal transition, and in which the metal is distinguished from the insulator by the absence of the correlated distortions, clearly deserves further investigation.
Finally, we note that there is a number of basic questions about the role of nanoscale inhomogeneities in manganites that still remain to be answered. Firstly, the structure of the correlated regions is still unknown [10]. Secondly, it is unclear why the correlations are observed only in the O state. A possible explanation will likely invoke the effects of the favorable elastic response of the O structure to the long-range strains [30] produced by the local distortions. Even though interesting theoretical results on the role of long-range strains in manganites have recently been achieved [31, 32], realistic models taking into account the long-range elastic effects are yet to be developed. Thus, while clear connection between the nanoscale structural inhomogeneities and the bulk properties in manganites has been now established, further work is needed to determine the nature of these inhomogeneities and the physical mechanism of their formation.
V Conclusions
We present a neutron scattering investigation of the paramagnetic phase in La0.75(Ca0.45Sr0.55)0.25MnO3. The obtained results can be summarized as follows. (i) Both the orthorhombic (O) and the rhombohedral (R) paramagnetic phases exhibit dynamic single polarons. The polarons strongly affect the dynamics of the crystal lattice, as evidenced by the anomalous Debye-Waller factors and damped acoustic phonons in the paramagnetic phase. The damping of the acoustic modes may be responsible for the reduced thermal conductivity characteristic of this phase. (ii) Nanoscale structural correlations fluctuate much more slowly than the uncorrelated polarons. In agreement with previous x-ray diffraction measurements [10], the correlations are observed only in the orthorhombic phase. Thus, it is the presence of the structural correlations that distinguishes the O phase from the R phase on the microscopic level. (iii) Single polarons do not show any sharp anomaly at the O-to-R transition, and the structural changes at this transition are not large enough to affect the electrical properties significantly. Thus, the increased electrical resistivity of the O phase should be attributed to the presence of the correlated lattice distortions. (iv) Based on these results, as well as on previously published work, we propose that the insulating character of the orthorhombic paramagnetic phase in CMR manganites stems from the presence of the correlated lattice distortions.
VI Acknowledgements
We are grateful to J. P. Hill for important discussions. This work was supported by the NSF under Grant No. DMR-0093143, and by the NSF MRSEC program, Grant No. DMR-0080008.
REFERENCES
- [1] For a review, see E. Dagotto, Nanoscale Phase Separation and Colossal Magnetoresistance, (Springer-Verlag, Berlin, 2002).
- [2] For a review, see Colossal Magnetoresistance Oxides, edited by Y. Tokura (Gordon and Breach, London, 1999).
- [3] C. Zener, Phys. Rev. 81, 440 (1951); C. Zener, ibid. 82, 403 (1951); P.W. Anderson and H. Hasegawa, ibid. 100, 675 (1955).
- [4] M.B. Salamon, M. Jaime, Rev. Mod. Phys. 73, 583 (2001).
- [5] S.J.L. Billinge, R.G. DiFrancesco, G.H. Kwei, J.J. Neumeier, and J.D. Thompson, Phys. Rev. Lett. 77, 715 (1996); K.H. Kim, J.Y. Gu, H.S. Choi, G.W. Park, and T.W. Noh, ibid. 77, 1877 (1996); M. Jaime, H.T. Hardner, M.B. Salamon, M. Rubinstein, P. Dorsey, and D. Emin, ibid. 78, 951 (1997); C.H. Booth, F. Bridges, G.H. Kwei, J. M. Lawrence, A.L. Cornelius, and J.J. Neumeier, ibid. 80, 853 (1998); D. Louca, T. Egami, E.L. Brosha, H. Röder, and A.R. Bishop, Phys. Rev. B 56, R8475 (1997).
- [6] N. Mannella, A. Rosenhahn, C.H. Booth, S. Marchesini, B.S. Mun, S.-H. Yang, K. Ibrahim, Y. Tomioka, and C.S. Fadley, Phys. Rev. Lett. 92, 166401 (2004).
- [7] S. Shimomura, N. Wakabayashi, H. Kuwahara, and Y. Tokura, Phys. Rev. Lett. 83, 4389 (1999); L. Vasiliu-Doloc, S. Rosenkranz, R. Osborn, S.K. Sinha, J.W. Lynn, J. Mesot, O.H. Seeck, G. Preosti, A.J. Fedro, and J.F. Mitchell, ibid. 83, 4393 (1999).
- [8] C.P. Adams, J. W. Lynn, Y.M. Mukovskii, A.A. Arsenov, and D.A. Shulyatev, Phys. Rev. Lett. 85, 3954 (2000); P. Dai, J.A. Fernandez-Baca, N. Wakabayashi, E.W. Plummer, Y. Tomioka, and Y. Tokura, ibid. 85, 2553 (2000).
- [9] C.S. Nelson, M.v. Zimmermann, Y.J. Kim, J.P. Hill, Doon Gibbs, V. Kiryukhin, T.Y. Koo, S-W. Cheong, D. Casa, B. Keimer, Y. Tomioka, Y. Tokura, T. Gog, and C.T. Venkataraman, Phys. Rev. B 64, 174405 (2001); V. Kiryukhin, T.Y. Koo, A. Borissov, Y.J. Kim, C.S. Nelson, J.P. Hill, D. Gibbs, S-W. Cheong, ibid. 65, 094421 (2002).
- [10] V. Kiryukhin, T.Y. Koo, H. Ishibashi, J.P. Hill, S-W. Cheong, Phys. Rev. B 67, 064421 (2003).
- [11] J.F. Mitchell, D.N. Argyriou, C.D. Potter, D.G. Hinks, J.D. Jorgensen, and S.D. Bader, Phys. Rev. B 54, 6172 (1996).
- [12] P.G. Radaelli, M. Marezio, H.Y. Hwang, S-W. Cheong, and B. Batlogg, Phys. Rev. B 54, 8992 (1996).
- [13] A.J. Millis, P.B. Littlewood, and B.I. Shraiman, Phys. Rev. Lett. 74, 5144 (1995); A.J. Millis, B.I. Shraiman, and R. Mueller, ibid. 77, 175 (1996).
- [14] A.C. Larson and R.B. Von Dreele, Los Alamos National Laboratory Report No. LA-UR-86-748 (unpublished).
- [15] P. Dai, J. Zhang, H.A. Mook, S.-H. Liou, P.A. Dowben, E.W. Plummer, Phys. Rev. B 54, R3694 (1996).
- [16] P.G. Radaelli, D.E. Cox, M. Marezio, and S-W. Cheong, Phys. Rev. B 55, 3015 (1997).
- [17] D.N. Argyriou, J.W. Lynn, R. Osborn, B. Campbell, J.F. Mitchell, U. Ruett, H.N. Bordallo, A. Wildes, and C.D. Ling, Phys. Rev. Lett. 89, 036401 (2002).
- [18] S.W. Lovsey, Theory of Neutron Scattering from Condensed Matter (Clarendon Press, Oxford, 1984).
- [19] P.G. Radaelli, G. Iannone, M. Marezio, H.Y. Hwang, S-W. Cheong, J.D. Jorgensen, and D.N. Argyriou, Phys. Rev. B 56, 8265 (1997); M. Medarde, J. Mesot, P. Lacorre, S. Rosenkranz, P. Fischer, and K. Gobrecht, Phys. Rev. B 52, 9248 (1995).
- [20] J.L. Cohn, J.J. Neumeier, C.P. Popoviciu, K.J. McClellan, Th. Leventouri, Phys. Rev. B 56, R8495 (1997).
- [21] K.H. Kim, M. Uehara, C. Hess, P.A. Sharma, and S-W. Cheong, Phys. Rev. Lett. 84, 2961 (2000).
- [22] J. Zhang, P. Dai, J.A. Fernandez-Baca, E.W. Plummer, Y. Tomioka, and Y. Tokura, Phys. Rev. Lett. 86, 3823 (2001); W. Reichardt, M. Braden, Physica B 263-264, 416 (1999).
- [23] For a review, see L.E. Cross, Ferroelectrics 76, 241 (1987).
- [24] P.M. Gehring, S.-E. Park, and G. Shirane, Phys. Rev. Lett. 84, 5216 (2000); P.M. Gehring, S.B. Vakhrushev, and G. Shirane, in Fundamental Physics of Ferroelectrics 2000, edited by R.E. Cohen (American Institute of Physics, Melville, NY, 2000), Vol. 535, p. 314; T.Y. Koo, P.M. Gehring, G. Shirane, V. Kiryukhin, S.-G. Lee, and S-W. Cheong, Phys. Rev. B 65, 144113 (2002).
- [25] S. Uhlenbruck, R. Teipen, R. Klingeler, B. Büchner, O. Friedt, M. Hücker, H. Kierspel, T. Niemöller, L. Pinsard, A. Revcolevschi, R. Gross, Phys. Rev. Lett. 82, 185 (1999); P. Wagner, I. Gordon, S. Mangin, V.V. Moshchalkov, Y. Bruynseraede, Phys. Rev. B 61, 529 (2000).
- [26] Y. Tomioka, A. Asamitsu, and Y. Tokura, Phys. Rev. B 63, 024421 (2000).
- [27] H.Y. Hwang, S-W. Cheong, P.G. Radaelli, M. Marezio, and B. Batlogg, Phys. Rev. Lett. 75, 914 (1995).
- [28] J. Mira, J. Rivas, L.E. Hueso, F. Rivadulla, M.A. Lópes Quintella, M.A. Señaris Rodrigues, C.A. Ramos, Phys. Rev. B 65, 024418 (2001).
- [29] M.J. Rozenberg, G. Kotliar, H. Kajueter, G.A. Thomas, D.H. Rapkine, J.M. Honig, P. Metcalf, Phys. Rev. Lett. 75, 105 (1995); A. Georges, G. Kotliar, W. Krauth, M. Rozenberg, Rev. Mod. Phys. 68, 13 (1996).
- [30] D.I. Khomskii, and K.I. Kugel, Europhys. Lett. 55, 208 (2001); B.J. Campbell, S.K. Sinha, R. Osborn, S. Rosenkranz, J.F. Mitchell, D.N. Argyriou, L. Vasiliu-Doloc, O.H. Seeck, and J.W. Lynn, Phys. Rev. B 67, 020409(R) (2003).
- [31] J. Burgy, A. Moreo, and E. Dagotto, Phys. Rev. Lett. 92, 097202 (2004).
- [32] K.H. Ahn, T. Lookman, and A.R. Bishop, Nature 428, 401 (2004).