Correlation between superfluid density and of underdoped YBa2Cu3O6+x near the superconductor-insulator transition
Abstract
We report measurements of the ab-plane superfluid density (magnetic penetration depth, ) of severely underdoped films of YBa2Cu3O6+x, with from 6 to 50 K. is not proportional to ; instead, we find . At the lowest dopings, is as much as 5 times larger than the upper limit set by the KTB transition temperature of individual bilayers.
pacs:
74.25.Fy, 74.40.+k, 74.78.Bz, 74.72.BkThe problem of high- superconductivity at severe underdoping is complicated by admixtures of different physics, intrinsic or extrinsic to superconductivity itself, e.g., stripes, pseudogap, metal-insulator transition. In particular, the relationship between the pseudogap and superconductivity is perhaps the central issue in the field PLee . There is now a wide variety of theories available that attempt to explain the coexistence of the pseudogap and superconductivity. At the mean-field level, most of them fail to account for the observed decrease of to zero with underdoping, and they appeal to thermal phase fluctuations to do the job. EmeryKivelsonPRL ; EmeryKivelsonNature ; Carlson1 ; CurtyBeck ; IoffeMillis ; Muller ; Scalapino ; Timm ; Hirschfeld ; Tesanovic . This is reasonable if interlayer coupling in underdoped cuprates is weak enough that samples are quasi-2D, and is approximately the 2D-XY (or, KTB KTB ) transition temperature. After all, this relationship holds, at least approximately, for cuprates that are moderately underdoped Uemura .
In some models, EmeryKivelsonPRL ; EmeryKivelsonNature ; Carlson1 the pseudogap arises from quasi-2D phase fluctuations. Electron pairing occurs at the pseudogap temperature, which increases with underdoping, but phase fluctuations delay phase coherence to a much lower temperature, the observed transition temperature. In this framework, the measured is approximately the KTB transition temperature for a single superconducting layer. Thus, . Therefore, the empirical Uemura proportionality between and finds a natural explanation.
In this paper we show that is not proportional to superfluid density for severe underdoping. Near the superconductor-to-insulator transition, is roughly proportional to , implying that phase fluctuations do not suppress as has been conjectured.
Experimental progress in this area is impeded mostly by the absence of severely underdoped specimens of high quality. High quality in this case would mean high degree of homogeneity and consequently narrow superconducting transition. The problem is that because the slope vs. is large near the superconductor-to-insulator transition, small oxygen composition variations across the sample can cause a wide transition. We have made progress on reducing transition widths to where the conclusions of this paper are insensitive to them.
To optimize oxygen homogeneity, we grew our YBCO films sandwiched between two PrBa2Cu3O6+x (PBCO) layers, so that there is no free surface of the YBCO anywhere and no surface barrier for oxygen diffusion into YBCO. PBCO/YBCO/PBCO trilayers were deposited on (001) SrTiO3 substrates by pulsed laser ablation with a Kr-F excimer laser (Lambdaphysik 305i, 248 nm wavelength, pulse energy 150 mJ). For the first PBCO layer, 10 unit cells thick, the heater was at 820∘C and oxygen pressure was 140 mTorr. After deposition, this layer was fully oxidized at 500∘ C for 10 minutes in 760 torr O2. Then a 20 or 40 unit cell (235 or 470Årespectively) layer of YBCO and 20 or 40 unit cell cap layer of PBCO were deposited at 760 ∘C and 140 mTorr of O2.
After deposition, the films were annealed in situ for 12 to 24 hrs in 10 to 200 torr O2 at 600∘C or 700∘C and then either quenched by dropping them onto crumpled aluminum foil or slowly cooled with the heater turned off. It took about an hour to cool from 600∘C to under 200∘C, where oxygen kinetics becomes negligibly slow. Our samples had ’s down to 6 K, and even at this low the peak in was well-defined, if broad, whereas in previous attempts the peak in extended nearly to .
Samples annealed for 12 hours showed lower and superfluid density than those annealed for 24 hours at the same (or even slightly lower) oxygen pressure and same temperature. From this we conclude that 12 hours is not enough to reach equilibrium with atmosphere. For the same anneal time, lower oxygen pressure results in lower . From we infer oxygen content using a canonical phase diagram (see, e.g. Jorgensen ). The films have .
From our mutual inductance measurements at about 50 kHz we determine the sheet conductance of the film. From the imaginary part, , we extract the magnetic penetration depth , and hence the superfluid density, . The details are given in references 2coil1 ; 2coil2 . Inhomogeneities in oxygen content contribute to the natural width of the peak at in the real part of the conductivity, . It is this spread that was in the way of observing subtle details in the data near . Our best samples have full width of this peak of , while others have several Kelvin wide peaks.
All measurements for this study were performed in doubly -metal shielded cryostats to eliminate the effect of the Earth’s magnetic field. For comparison, one data set was taken in both shielded and unshielded cryostats. The latter showed slightly lower , therefore the -metal shields were an important precaution.
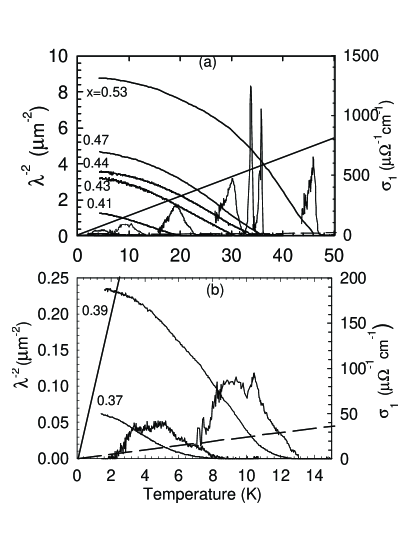
We start with overall look at the superfluid density of severely underdoped YBCO films, Fig. 1
.
This figure presents a series of films with s from 6 to 46 K. The narrowest transitions are about 2 K wide, as given by the width of the peak. For purposes of determining , we consider these transitions sufficiently narrow because at the lowest temperatures of the experiment condition is satisfied. Moreover, we have measured many more films than are presented here, and all gave the same results for , unless the width of the peak in extended to . Films that were optimally oxygenated typically had s near 90 K, and , and was quadratic in at low T. These results are consistent with the films being slightly disordered d-wave superconductors. Assuming that the scattering rate does not change significantly with underdoping, and that the superconducting gap is the pseudogap when , then the underdoped films are actually cleaner than optimally doped films in the sense that the scattering rate is a smaller fraction of the superconducting gap energy.
In quasi-2D layered superconductors we expect the observed transition to occur just a little above the 2D-XY transition temperature of a single CuO2 layer, which is related to the measured magnetic penetration depth by the familiar relation:
| (1) |
where is the flux quantum and 11.7Åis the thickness of 1 unit cell. (Note that if we use the film thickness in the above equation, we get an upper limit on the temperature at which thermal phase fluctuations must become important.) In fig. 1, intersections of the solid straight lines with the measured curves give . Quite obviously, does not vanish only a little above that temperature. In fact, for the two most severely underdoped films, the observed s are 5 times larger than . On the other hand, intersections of the dashed lines with are the 2D transition temperatures predicted by using the full film thickness in the above equation. The so-derived s closely match the positions of the peaks in . We conclude that the characteristic length for the Kosterlitz-Thouless transition is the film thickness and not a single unit cell thickness; severely underdoped films are not quasi-2D insofar as thermal phase fluctuations are concerned. Present results on many films augment our earlier report on the Kfilm Zuev
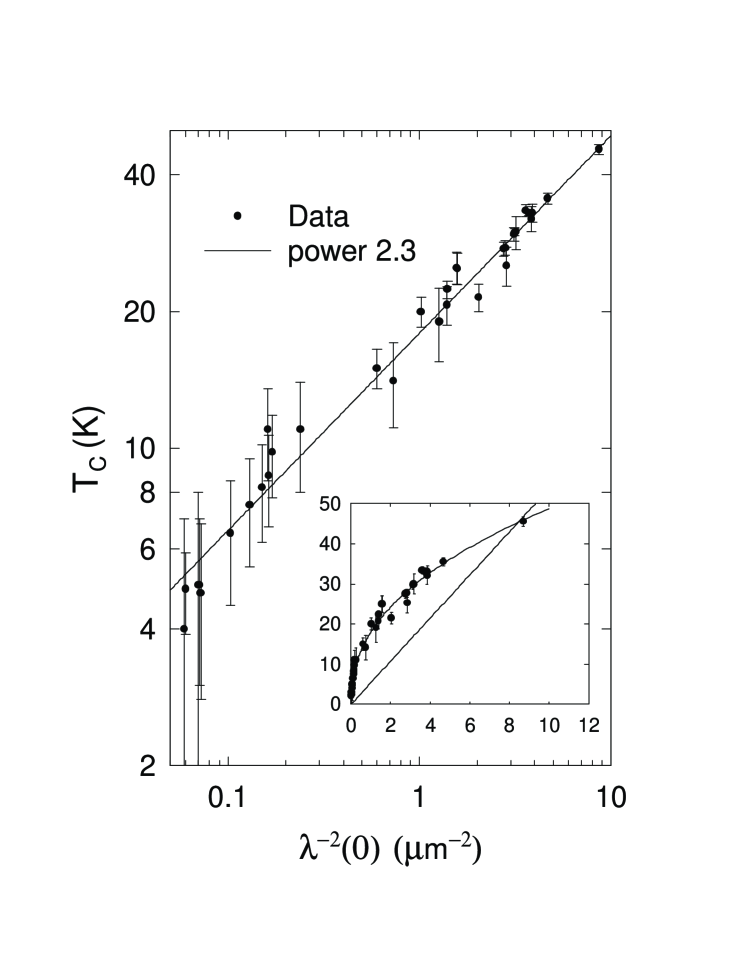
We now turn to the central result of this report, which is the comparison of our data with the famous Uemura plot Uemura . Figure 2 shows vs. extrapolated values in log-log and linear-linear (inset) scale. We have measured many more samples than appear in Fig. 1, and all of them fall on single line, irrespective of annealing procedure or transition width. In particular, samples with same oxygen content, but with different degree of Cu-O chain disorder (and hence different and ) fall on the same curve as samples with different oxygen contents. It is clear that is not proportional to . Instead, we find . The straight line in the inset to Fig. 2 shows prediction for from quasi-2D thermal phase fluctuations, Eq. 1, with 1.17nm. Below about 40 K the observed is larger than this upper limit. We conclude that thermal phase fluctuations are not responsible for the decrease in of underdoped cuprates.
Values of in underdoped YBCO films are about 5 times smaller than is seen in the cleanest YBCO crystals with the same UBC2 . Nevertheless, both sets of samples reveal the same dependence of on . This is important because YBCO films are much more similar to other cuprates, e.g., BiSrCaCuO and LaSrCuO, than are YBCO crystals. Ultraclean YBCO crystals are special. At optimal doping, they possess the highest superfluid density of all hole-doped cuprates by a factor of 4.
Our central result is the finding that for heavily underdoped YBCO films. This result disagrees with expectations based on the idea of cuprates as quasi-2D layered superconductors and with the phenomenological proportionality, , implied by the Uemura plot. Regarding the latter, it is worth noting that most of the data in the original Uemura plot come from samples that are not as severely underdoped as the samples presented here. A secondary result is that is not limited by quasi-2D thermal phase fluctuations, as they are understood from simulations of Josephson-coupled superconducting grains. Coupling between CuO2 planes is apparently strong enough to make fluctuations firmly 3D and therefore relatively unimportant up to temperatures few K below .
Why does decrease so rapidly with underdoping? If the pseudogap is due to an order parameter unrelated to superconductivity, like the -density wave order parameter of Chakravarty et al., chakravarty then one can appeal to disorder (scattering) and a decreasing gap, to account for the reduction in with underdoping. If the pseudogap is the superconducting gap, then the films become cleaner with underdoping, and scattering cannot be the explanation. It is possible that percolation of some sort is important. If superconductivity is confined to localized regions, like malformed stripes, then the measured superfluid density may be determined by coupling between regions. Finally, it has been speculated that electronic charge is renormalized to zero away from -wave nodes in underdoped cuprates UBC1 ; UBC3 . In the end, currently there is no reliable model that we are aware of, that predicts or explains our finding.
In conclusion, at severe underdoping critical temperature and superfluid density are not proportional. Instead, they are related by power law: . This is contrary to understanding of the pseudogap as a suppression of due to thermal phase fluctuations.
References
- (1) P. A. Lee, cond-mat/0307508
- (2) Y. J. Uemura et al. Phys. Rev. Lett. 62, 2317 (1989)
- (3) J.M. Kosterlitz and D.J. Thouless, J. Phys. C 6, 1181 (1973); J.M. Kosterlitz, ibid 7, 1046 (1974); V.L. Berezinskii, Sov. Phys. JETP 32, 493 (1971).
- (4) V. J. Emery and S. A. Kivelson, Phys. Rev. Lett, 74, 3253, (1995)
- (5) V. J. Emery, S. A. Kivelson, Nature, 374, 434-437 (1995)
- (6) E. W. Carlson, S. A. Kivelson, V. J. Emery, , E. Manousakis, Phys.Rev. Lett, 83, 612, (1999)
- (7) P. Curty and H. Beck, Phys Rev. Lett. 91, 257002 (2003).
- (8) D. Mihailović, V.V. Kabanov, and K.A. Müller, Europhys. Lett. 57, 254-259 (2002).
- (9) L.B. Ioffe and A.J. Millis, J. Phys. Chem. Solids 63, 2259-2268 (2002).
- (10) T. Eckl, D.J. Scalapino, E. Arrigoni, and W. Hanke, Phys. Rev. B 66, 140510(R) (2002).
- (11) C. Timm, D. Manske, and K.H. Bennemann, Phys. Rev. B 66, 094515 (2002).
- (12) H.J. Kwon, A.T. Dorsey, and P.J. Hirschfeld, Phys. Rev. Lett. 86, 3875-3878 (2001).
- (13) Z. Tesanović, Phys. Rev. B 36, R2364 (1987).
- (14) J. D. Jorgensen, B. W. Veal, A. P. Paulikas, L. J. Nowicki, G. W. Crabtree, H. Claus and W. K. Kwok, Phys. Rev. B 41,1863 (1990)
- (15) S. Chakravarty, R.B. Laughlin, D.K. Morr, and C. Nayak, Phys. Rev. B 63, 094503 (2001).
- (16) S. J. Turneaure E. R. Ulm and T. R. Lemberger, J. Appl. Phys. 79, 4221, 1996
- (17) S. J. Turneaure, A. A. Pesetski and T.R. Lemberger, J. Appl. Phys.,83, 4334, 1998
- (18) Y. Zuev, J. A. Skinta, M.S. Kim, T. R. Lemberger, E. Wertz, K. Wu, and Q. Li, cond-mat/0407113
- (19) D. Bonn, Private Communication.
- (20) A. Hosseini, D. M. Broun, D. E. Sheehy, T. P. Davis, M. Franz, W. N. Hardy, R. Liang, and D. A. Bonn, Phys. Rev. Lett. 93, 107003 (2004)
- (21) D. E. Sheehy, T. P. Davis, and M. Franz, Phys. Rev. B 70, 054510 (2004)