New address: ]European Synchrotron Radiation Facility, BP 220, F-38043 Grenoble Cedex, France
Author for correspondence; new address: ]Physical and Theoretical Chemistry Laboratory, Oxford University, South Parks Road, Oxford, OX1 3QZ, United Kingdom; email address: frank.schreiber@chem.ox.ac.uk
Late growth stages and post-growth diffusion in organic epitaxy: PTCDA on Ag(111)
Abstract
The late growth stages and the post-growth diffusion of crystalline organic thin films have been investigated for 3,4,9,10-perylenetetracarboxylic dianhydride (PTCDA) on Ag(111), a model system in organic epitaxy. In situ x-ray measurements at the anti-Bragg point during the growth show intensity oscillations followed by a time-independent intensity which is independent of the growth temperature. At 350 K, the intensity increases after growth up to a temperature-dependent saturation value due to a post-growth diffusion process. The time-independent intensity and the subsequent intensity recovery have been reproduced by models based on the morphology change as a function of the growth temperature. The morphology found after the post-growth diffusion processes has been studied by specular rod measurements.
pacs:
68.55.Ac, 81.10.Aj, 61.66.HqI Introduction
Crystalline small-molecule organic semiconductors such as perylene and phthalocyanine derivatives show interesting electrical and optical properties, which can be exploited in electronic and optoelectronic devices based on thin films deposited by organic molecular beam epitaxy (OMBE). However, the intrinsic properties of the organic crystals are closely related to the molecular and crystalline anisotropy, and the crystalline quality of the organic thin film has a strong impact on the resulting device performance. In order to control the properties of organic thin films, the understanding of the basic growth processes is necessary.
While the structure and epitaxy has been thoroughly studied for several model systems, such as PTCDA Forrest (1997); Hooks et al. (2001); Glöckler et al. (1998); Krause et al. (2002); Seidel et al. (2001); Stöhr et al. (2002); Schmitz-Hübsch et al. (1999); Fenter et al. (1997), on Ag(111) the growth dynamics and evolution of the resulting morphology have been less systematically investigated. Importantly, even for a system with well-defined monolayer epitaxy, the later stages of the growth (after a certain threshold thickness) can, of course, exhibit islanding (Stranski-Krastanov (SK) growth) and a very rough resulting morphology. It was recently found that PTCDA on Ag(111), one of the structurally best characterized OMBE systems, exhibits a relatively smooth morphology (kinetically limited) at low temperatures ( K), but that the growth behavior undergoes a transition to a very clear SK scenario at high temperatures ( K). In this paper, we present a real-time study of the later stages of the growth (islanding process) and the post-growth diffusion processes, which have a profound impact on the resulting morphology. We attempt a comprehensive discussion of the effects related to the temperature dependent transition of the morphology.
PTCDA (C24O6H8, see Fig. 1 (a)) is an archetypal system for OMBE Forrest (1997). It is a flat molecule which crystallizes in two monoclinic bulk polymorphs, the and the phase Lovinger et al. (1984); Kaplan et al. ; Möbus et al. (1992); Ogawa et al. (1999). In the following, we will always refer to the bulk notation. For both polymorphs, the 2 molecules of the unit cell order in a herringbone structure with the molecular plane parallel to the PTCDA(102) plane. At room temperature, the stacking distance between subsequent molecular sheets is Å and Å in PTCDA(102) direction.
On Ag(111), PTCDA forms well-ordered epitaxial films Glöckler et al. (1998); Krause et al. (2002). It has been found that the binding between the commensurate first monolayer and the substrate is much stronger than the binding between the subsequent layers Taborski et al. (1995). The structure and the morphology of PTCDA films vary significantly with the growth temperature, Krause et al. (2002); Chkoda et al. (2003). For K, the films are strained and have a relatively homogenous thickness. For K, the films consist of relaxed islands on top of two wetting layers. For a variety of growth conditions, a coexistence of both bulk polymorphs has been observed.
A detailed study of the epitaxy and the post-growth morphology of the PTCDA films studied here has been published elsewhere Krause et al. (2001, 2002, 2003, 2003). In this paper, we focus on the results of specular intensity measurements (with the momentum transfer perpendicular to the sample surface) during and directly after the growth of thin PTCDA films. This type of x-ray measurement is very suitable for studying the evolution of the out-of-plane structure and morphology of organic thin films in real time. It contains the laterally averaged information about the thin film structure in -direction.
Two types of experiments are reported in the following: measurements of a section of the specular rod, i.e. intensity measurements as a function of , after the growth, and time-dependent intensity measurements at one specific point of the specular rod during and after the deposition of the PTCDA films. For this, the anti-Bragg point of the film with has been chosen (see below).
The first type of experiment gives insight into the crystalline structure of the films. It will be shown how the growth temperature dependence of the morphology influences the specular intensity. The second type of experiment gives time-dependent information about the material distribution between the different layers. It contains information about the growth process and the post-growth diffusion. The initial stages of the growth are described in detail elsewhere Krause et al. (2003). Here, the later stages of the growth (after the growth of the wetting layer) and the post-growth diffusion are discussed.
The paper is organized as follows. In Sec. II the details about the sample preparation are given. The experiments are described in Sec. III. In Sec. IV, the results are discussed, and theoretical models for the observations are developed. The main results and conclusions of the paper are summarized in Sec. V.
II Experimental

The organic thin films have been deposited by molecular beam epitaxy in a portable UHV chamber (base pressure mbar) equipped for x-ray experiments Ritley et al. (2001). A Ag(111) single crystal with an out-of-plane mosaicity of has been used as a substrate. Prior to deposition, the substrate has been cleaned by repeated cycles of sputtering (30 min at room temperature, Ar+ energy 500–600 eV, Ar pressure mbar) and annealing at K for at least 15 min. The purified and thoroughly outgassed PTCDA has been evaporated from a Knudsen cell kept at approximately 575 K.
Two sets of samples with the average film thickness Å and growth temperatures in the range of 197 – 473 K have been studied, one with a flux (growth rate) Å/min (low ), the other with Å/min (high ).
The experiments have been performed at the Hamburger Synchrotronstrahlungslabor (HASYLAB) at the beamline W1 with the wavelength Å.
III Results
III.1 Specular rod measurements
Fig. 1 shows examples of the specular rod measurements including the PTCDA(102) reflection for samples grown at low . The measurements have been performed at the respective growth temperature of the samples. Independent of , the PTCDA(102) plane is parallel to Ag(111). For K, 1–3 Laue oscillations around PTCDA(102) have been observed. In this temperature range, the width of the PTCDA(102) peak corresponds to the average film thickness and is independent of . For K, the peak width of the Bragg peak decreases with increasing , and the Laue oscillations reduce to two shoulders on the Bragg peak or disappear completely. With increasing , the rod develops a pronounced minimum at Å-1. While the rod measurements show a strong temperature-dependence, the rocking scans through PTCDA(102) are independent of and show the same peak width of corresponding to the mosaicity of the substrate. A detailed discussion of the modelling of the data is presented in Sec. IV.2.
The measurements for the high samples (not shown here) show a similar behavior, but the changes in the rod measurements and the peak shape are shifted to higher temperatures by about 15 K. The Laue oscillations and the peak width expected for the average film thickness are still observed for K, where the oscillations are already damped out for the low samples.
III.2 In situ experiments

In order to follow the growth of thin PTCDA films, the x-ray diffraction intensity from the molecular layers has been measured in real-time. In kinematic approximation the specular x-ray scattering is the sum of the scattering contributions from the film and the substrate,
| (1) | |||||
Here, is the difference between and the nearest specular Bragg peak of the substrate with . and are the lattice spacings of the film and the substrate, and are the corresponding form factors, is the lattice spacing of the topmost layer of the substrate, is the distance between the substrate and the first layer of the film, is the fractional coverage of the th layer within the film, and is the Gaussian roughness of the substrate. At the anti-Bragg point of the PTCDA film () the contribution of the substrate (the second term in Eq. 1) equals , which can be written as , where is defined as
| (2) |
This is the difference between the material (in fractions of monolayers) deposited in odd layers (i.e. the coverage of layer 1 the coverage of layer 3 …) and the material deposited in even layers. This simplification is possible since at the anti-Bragg point the scattering amplitude of all even and all odd layers has the same phase. It has been assumed here that the lattice parameter of the film is constant across the entire film thickness. This assumption is supported by the specular rod measurements.
The scattered intensity at the anti-Bragg point, normalized to the scattering of the substrate, is
| (3) |
with
| (4) |
The parameters and depend on the materials involved. For PTCDA on Ag(111), inserting the atomic form factors and the lattice parameters determined from the rod measurements (see Sec. III.1) leads to the values and .
In the case of layer-by layer growth, characteristic intensity oscillations with the minimum intensity and the maximum intensity are observed as a function of the deposition time Vlieg et al. (1988); Dai et al. (1999); Krause et al. (2003); Kaganer et al. (2003) (see Fig. 2).
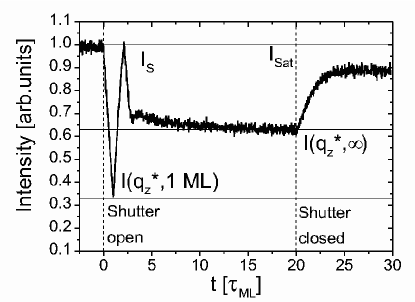
Fig. 3 shows a typical intensity measurement during the deposition of a PTCDA film, normalized to the intensity scattered by the substrate measured before deposition. The time is given in units of the monolayer deposition time, , of the first few layers as derived by the observed intensity oscillations. The temperature-dependence of the intensity oscillations during the deposition of the initial monolayers has been described in detail elsewhere Krause et al. (2003). In the following we briefly summarize the most important observations, and then focus on the analysis of the later stages of the growth and the post-growth changes.
Before opening the shutter of the evaporation cell, the constant intensity, , scattered by the substrate is measured. During deposition, the intensity oscillates between the maximum value and the minimum value for . is the deposition time for 1 ML. For K the intensity oscillations for are damped, for K they are undamped and show no temperature dependence. Interestingly, during further deposition, the intensity approximates the asymptotic value , independent of .
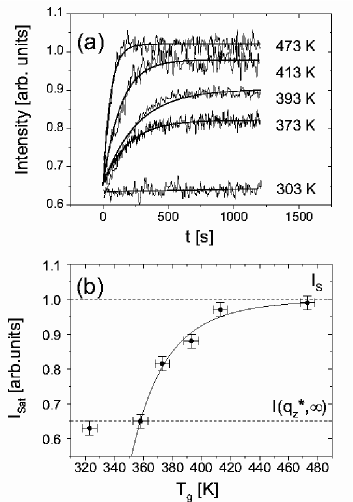
After the shutter has been closed, the intensity increases with up to a saturation value, , indicative of post-growth structural changes. Fig. 4 (a) shows this intensity recovery as a function of the growth temperature. For K, remains constant after deposition, while for K, the intensity increases as a function of the time after interrupting the deposition. The saturation intensity shown in Fig. 4 (b) increases with up to , while the characteristic time, , for the saturation process decreases with (see Sec. IV for a quantitative analysis).
IV Discussion
For the PTCDA films discussed here, a morphology change from a smooth or facetted film to islands on a wetting layer has been observed as a function of Krause et al. (2002, 2003). The transition to the island morphology has been found around K which is comparable to the temperature where the changes in the rod measurements and in the in situ intensity measurements have been observed. This suggests that the observations reported here are related to the morphology change.
IV.1 Rod measurements
Qualitatively, the observed features of the rod measurements correspond to the following scenario. The PTCDA films grown at low temperatures (for the low samples, this corresponds to K) are relatively smooth as indicated by the Laue oscillations. The films cover essentially the entire substrate surface since the width of the Bragg peak corresponds to the average film thickness. For higher temperatures, the Laue oscillations vanish indicating an increasing roughness of the film. The decreasing width of the Bragg peak corresponds to high islands, and the intensity minimum at Å-1 indicates a 2 ML thick wetting layer between the islands. The observations agree with the morphology observed by AFM Krause et al. (2002), implying that the entire PTCDA film is ordered.
For all films, only a single PTCDA out-of-plane Bragg peak around Å-1 has been observed, even if the in-plane measurements have confirmed the coexistence of the and the phase Krause et al. (2002). The expected splitting between the (102) Bragg reflections of both polymophs is Å-1. For K, is much smaller than the observed width of the PTCDA(102) reflection and cannot be resolved. For the narrow peaks observed at higher , the peak splitting is not observed due to the dominance of the phase at these temperatures.
IV.2 Modelling of the rod measurements
Based on the morphological features observed with the AFM Krause et al. (2002), the following model for the X-ray data has been developed.
In kinematic approximation the specular x-ray scattering intensity of each mosaic block of the substrate covered by a thin film is with as described in Eq. 1. Since the morphology discussed in this section is observed long after the growth process and therefore time-independent, the parameter of Eq. 1 has been omitted.
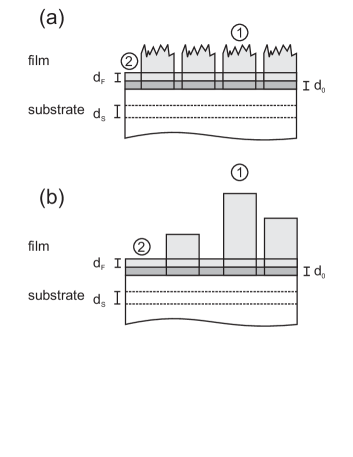
Fig. 5 (a) shows a schematic of the model applied to the rod measurements with a temperature-independent peak width (comparatively smooth film). Two types of mosaic blocks have been introduced to describe this low- morphology: (1) mosaic blocks with film layers and a Gaussian roughness , described by
| (5) |
and (2) mosaic blocks covered by a film of only a few monolayers and
| (6) |
where is the layer index. The total intensity scattered from the illuminated area is
| (7) |
where and are the scattering amplitudes of the different types of mosaic blocks, and is the fraction of the substrate surface covered by the type-(2) mosaic blocks.
For the rod measurements with a decreasing peak width (islands on a wetting layer, high- films), the model is slightly modified (see Fig. 5 (b)). The islands (i.e. the PTCDA film of the type (1) mosaic blocks) are assumed to be molecularly flat with
| (8) |
They have a Gaussian height distribution with the average height and the standard deviation . The scattered intensity of the film is
| (9) | |||||
where is the area covered by the type-(2) mosaic blocks corresponding to the wetting layer, and and are the scattering amplitudes of the different types of mosaic blocks.

These two models describe all specular X-ray measurements. The results of the calculations are shown as straight lines in Fig. 1. Fig. 6 summarizes the parameters used for the simulations. For K, the lattice parameter varies as expected from the thermal expansion of PTCDA in (102) direction Krause et al. (2003). For K, the effective lattice parameter seems to be approximately temperature independent instead of decreasing further. A possible explanation for this is that the ratio of the PTCDA phase with a slightly larger lattice parameter than the phase increases for K as already indicated by in-plane measurements of thin PTCDA films Krause et al. (2002).
The area covered by the wetting layer and the island height increase with for K, as observed in a similar AFM study Krause et al. (2002). Since the island density increases with increasing deposition rate and decreasing growth temperature, the islands grown at high are always smaller than the islands grown at the same but lower .
The thickness of the wetting layer is approximately 2 ML and the lattice spacing between the topmost layer of the substrate and the first layer of the PTCDA film is Å, independent of .
For PTCDA on Au(111), similar measurements of the specular rod have been performed Fenter et al. (1997). These measurements have been modeled as the coherent scattering of a film with a laterally averaged density. In contrast to this, here the incoherent addition of the intensity has been chosen since the AFM images of PTCDA/Ag(111) show that the morphology varies on a length scale much larger than the average mosaic block size of 500 Å, and the scattering of different mosaic blocks adds up incoherently.
IV.3 In situ growth experiments
In the following, two aspects of the real-time growth observations will be discussed in detail, the asymptotic intensity, , and the intensity increase observed immediately after the deposition. Both features are related to the morphology of the films.
IV.3.1 Asymptotic intensity
For all samples, a constant asymptotic intensity has been observed after the initial growth stages. With Eq. 3, the experimentally observed value corresponds to .
In the following a model for this asymptotic intensity is developed. For simplicity only the coherent scattering from one mosaic block is discussed. Strictly, this model only applies to the case where the roughness of the film is much smaller than the length scale of the mosaic block, as observed for the later growth stages of the relatively homogenous films grown at K. At higher growth temperatures, the scattering from the PTCDA films after the initial growth stages is a superposition of the incoherent scattering of different types of mosaic blocks, as already discussed in Sec.IV.2. However, the incoherent addition does not change significantly the value for the asymptotic intensity, and the calculations can be performed in analogy to the coherent case.
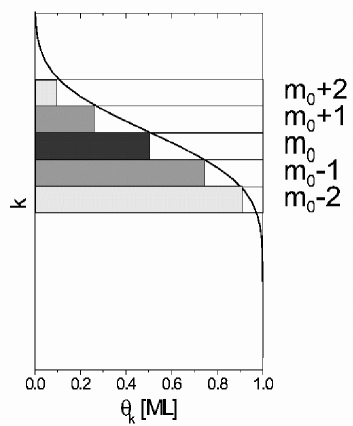
For a Gaussian height distribution (which has been found on a length scale of the x-ray coherence length, approximately 1 m, for films with K after growth Krause et al. (2002)), the coverages of a film with an average layer number are determined by (see Eq. 5)
| (10) |
(Fig. 7). For sufficiently large , Eq. 10 can be characterized by
| (11) |
A function with these features leads to and thus , which is shown in the Appendix.
For the system PTCDA/Ag(111), two cases have to be distinguished: The growth at K, and the growth at K.
For K, the layer-by-layer growth of the initial layers (indicated by the oscillations) changes with increasing deposition time to a Gaussian height profile explaining the asymptotic intensity during and the specular rod measurements after deposition (see Sec. IV.2). This case is consistent with the above model.
At K, separate islands on top of a wetting layer are observed after growth. This morphology deviates clearly from a symmetric roughness profile. The dominant part of the sample is covered by two monolayers (), corresponding to . The islands give only a negligible contribution to the measured intensity since they cover only a small part of the area. In addition to this, only the topmost layer of the island contributes to the scattering since the scattering of all lower layers interferes destructively at the anti-Bragg point. However, one possible explanation for the observed intensity corresponding to is that during growth the third layer is partially filled with a coverage of approximately 0.5 ML. This coverage is not stable, and after growth, the molecules diffuse to the islands and only the 2 wetting monolayers observed in the rod measurements remain. In the next section, we will see that this model is consistent with the observation of the intensiy recovery after growth.
IV.3.2 Intensity recovery after deposition
For samples deposited at growth conditions corresponding to islands on a wetting layer, a post-growth intensity recovery has been observed, while for samples grown at lower temperatures the intensity does not change after growth (on accessible time scales of several hours). During growth, the coverage changes of the different layers are due to deposition and diffusion. The post growth intensity changes are a sign for interlayer diffusion after growth (desorption is a negligible effect in the temperature range studied here).
The following model is consistent with the temperature dependence of the intensity recovery. For K, after growth the samples have a Gaussian roughness on a scale much smaller than the mosaic block size. This roughness is not significantly changed by surface diffusion because is too low. Therefore, the scattered intensity does not change after growth. For K, post-growth diffusion of molecules from the top of the wetting layer to the islands takes place.

To model the x-ray scattering of the inhomogeous morphology at K, the scattered intensity of 3 types of mosaic blocks is added incoherently: (1) Mosaic blocks belonging to islands with even layer number, the coverage difference , and the normalized scattering intensity according to Eq. 3; (2) mosaic blocks belonging to islands with odd layer number, the coverage difference , and the normalized scattering intensity ; (3) mosaic blocks covered by the wetting layer and some additional molecules, with the time-dependent scattering intensity and the coverage difference covering the area . is an effective parameter comprising the surface diffusion barrier, the size of the critical nucleus, and the temperature dependence of the surface diffusion. We assume that the islands with even and odd layers each cover half of the remaining area, which is . The total scattered intensity is
| (12) |
Fig. 8 shows the fit results of the intensity measurements after deposition. The area covered (only) by the wetting layer (Fig. 8 (a)) increases with the deposition temperature up to nearly the entire sample surface. This is consistent with the result from specular rod measurements, also shown in Fig. 8 (a), and the AFM observations Krause et al. (2002). The characteristic time, , for the recovery process is shown in Fig. 8 (b). It decreases with increasing , as expected for a diffusion-related process, from s at K to s at K.
Similar to the x-ray intensity recovery after growth reported here, an intensity recovery after the growth of GaAs has been observed by Reflection High Energy Electron Scattering Lewis et al. (1985); Joyce (1990). In this case, the recovery corresponds to a smoothening of the surface after the interruption of the Ga flux due to the post-growth surface diffusion. In contrast to this, the post-growth intensity recovery of PTCDA is explained as the result of the interplay between post-growth surface diffusion processes and the morphology of the PTCDA films.
V Summary and Conclusions
The later growth stages, the post growth diffusion, and the structure of thin films of PTCDA/Ag(111) have been studied. The specular rod data are strongly influenced by the temperature-dependent morphology of the films.
The thickness of the wetting layer (2 ML), the area covered by the islands, and the binding distance between the first monolayer and the substrate have been determined. In-situ measurements at the anti-Bragg point have been used to derive information about the growth of PTCDA. After the intensity oscillations during the deposition of the wetting layer (indicating layer-by-layer growth), a constant intensity has been observed, followed by an increase of intensity after growth for K. The measurements have been analyzed quantitatively using the following growth model: At K, after the deposition of the wetting layer the growth mode changes to 3D growth with a Gaussian roughness which is stable after growth. At K, the growth of the wetting layer is followed by island growth. During growth, the third layer is partially filled. After growth, due to the strong surface diffusion this material is also incorporated into the islands, and the temperature dependence of the time scales of the post-growth diffusion has been determined.
Morphology changes as a function of the growth temperature have a strong impact on the performance of optoelectronic devices. The observed post-growth diffusion may be of special interest for multilayer structures since the interface quality can be improved by growth interruptions allowing for the incorporation of residual surface molecules. Also, the resulting island morphology might be exploited similar as in the Stranski-Krastanov growth of inorganic semiconductors.
Acknowledgements.
We are grateful to N. Karl for providing the purified material. Partial support from the DFG (Schwerpunktprogramm “Organische Feldeffekt-Transistoren”) is gratefully acknowledged. We thank the HASYLAB staff for excellent support.Appendix A Asymptotic intensity
It is shown that a function with the features described in Eq. IV.3.1 leads to and thus . can be written as
| (13) | |||||
Here, the sum has been separated into the contribution of the layers with , the layers with , and the contribution of the layer . With , we get
| (14) | |||||
With Eq. IV.3.1 and it follows
| (15) | |||||
For , and with this reduces to
| (16) |
for both even and odd.
The physical reason for this is the following: If enough layers contribute to the Gaussian surface roughness, a layer can always be chosen with , as indicated in Fig. 7. The X-rays scattered by the layer interfere constructively with the X-rays scattered by the layer .
If the coverage of the layer is shifted to the layer , the specularly scattered intensity at the anti-Bragg point does not change. Because of the symmetry of the Gaussian lineshape, the coverage of the layer fills exactly the vacancies of the layer , and all layers can be filled with the coverage of a corresponding layer with . If is large enough compared to the roughness of the film, the layers with have the coverage 0. The total specular intensity at the anti-Bragg point scattered by the rough film is equivalent to the intensity scattered by layers with the coverage 1 (corresponding to Eq. 16), and by the layer with the coverage 0.5. Therefore, always equals 0.5.
References
- Forrest (1997) S. R. Forrest, Chem. Rev. 97, 1793 (1997).
- Krause et al. (2002) B. Krause, A. C. Dürr, K. Ritley, F. Schreiber, H. Dosch, and D. Smilgies, Phys. Rev. B 66, 235404 (2002).
- Hooks et al. (2001) D. E. Hooks, T. Fritz, and M. D. Ward, Adv. Mater. 13, 227 (2001).
- Stöhr et al. (2002) M. Stöhr, M. Gabriel, and R. Möller, Europhys. Lett. 59, 423 (2002).
- Schmitz-Hübsch et al. (1999) T. Schmitz-Hübsch, T. Fritz, R. Staub, A. Back, N. R. Armstrong, and K. Leo, Surf. Sci. 437, 163 (1999).
- Glöckler et al. (1998) K. Glöckler, C. Seidel, A. Soukopp, M. Sokolowski, E. Umbach, M. Böhringer, R. Berndt, and W.-D. Schneider, Surf. Sci. 405, 1 (1998).
- Seidel et al. (2001) C. Seidel, R. Ellerbrake, L. Gross, and H. Fuchs, Phys. Rev. B 64, 195418 (2001).
- Fenter et al. (1997) P. Fenter, F. Schreiber, L. Zhou, P. Eisenberger, and S. R. Forrest, Phys. Rev. B 56, 3046 (1997).
- Lovinger et al. (1984) A. J. Lovinger, S. R. Forrest, M. L. Kaplan, P. H. Schmidt, and T. Venkatesan, J. Appl. Phys. 55, 476 (1984).
- (10) M. L. Kaplan, C. S. Day, A. J. Lovinger, P. H. Schmidt, and S. R. Forrest, private communication.
- Möbus et al. (1992) M. Möbus, N. Karl, and T. Kobayashi, J. Cryst. Growth 116, 495 (1992).
- Ogawa et al. (1999) T. Ogawa, K. Kuwamoto, S. Isoda, T. Kobayashi, and N. Karl, Acta Cryst. B 55, 123 (1999).
- Taborski et al. (1995) J. Taborski, P. Väterlein, H. Dietz, U. Zimmermann, and E. Umbach, J. Electron Spectrosc. Relat. Phenom. 75, 129 (1995).
- Chkoda et al. (2003) L. Chkoda, M. Schneider, V. Shklover, L. Kilian, M. Sokolowski, C. Heske, and E. Umbach, Chem. Phys. Lett. 371, 548 (2003).
- Krause et al. (2003) B. Krause, F. Schreiber, H. Dosch, A. Pimpinelli, and O. H. Seeck, Europhys. Lett. 65, 372 (2004).
- Krause et al. (2003) B. Krause, A. C. Dürr, F. Schreiber, H. Dosch, and O. H. Seeck, J. Chem. Phys. 119, 3429 (2003).
- Krause et al. (2001) B. Krause, A. C. Dürr, K. A. Ritley, F. Schreiber, H. Dosch, and D. Smilgies, Appl. Surf. Sci. 175–176, 332 (2001).
- Ritley et al. (2001) K. Ritley, B. Krause, F. Schreiber, and H. Dosch, Rev. Sci. Instr. 72, 1453 (2001).
- Vlieg et al. (1988) E. Vlieg, A. W. D. van der Gon, and J. F. van der Veen, Phys. Rev. Lett. 61, 2241 (1988).
- Dai et al. (1999) P. Dai, Z. Wu, T. Angot, S.-K. Wang, H. Taub, and S. N. Ehrlich, Phys. Rev. B 59, 15464 (1999).
- Kaganer et al. (2003) V. M. Kaganer, W. Braun, B. Jenichen, L. Däweritz, and K. H. Ploog, Phys. Rev. Lett. 90, 016101 (2003).
- Salvan et al. (2000) G. Salvan, D. A. Tenne, A. Das, T. U. Kampen, and D. R. T. Zahn, Organic Electronics 1, 49 (2000).
- Lewis et al. (1985) B. F. Lewis, F. J. Grunthaner, A. Madhukar, T. C. Lee, and R. Fernandez, J. Vac. Sci. Technol. B 3, 1317 (1985).
- Joyce (1990) B. A. Joyce, J. Cryst. Growth 99, 9 (1990).