El Farol Revisited
Abstract
This article is concerned with the global behavior of agents in the El Farol bar problem. In particular, we discuss the global attendance in terms of its mean and variance, and show that there is a strong dependence of both on the externally imposed comfort level. We present a possible interpretation for the observed behavior, and propose that the mean attendance converges to the perceived threshold value as opposed to the actually imposed one.
1 Background and Problem statement
Modeling inductive reasoning and bounded rationality was the subject of the influential article by Arthur[1], wherein the author investigated the global behavior of a group of agents that independently decided, at each week, whether to go to a bar. This prototype of agent based modeling, which became known as the El Farol bar problem, has since been the subject of many studies, either in its original form or in the context of the Minority Game (see, e.g., the works by Challet and Zhang[2, 3], Johnson et al.[4], Challet et al.[5], Cara et al.[6], and the references therein).
Here we go back to the original form of the El Farol bar problem and discuss some issues regarding the global behavior of the agents in terms of how they perceive the imposed comfort levels. Our computer experiments simulate the following situation: At each week , people independently decide whether to go to the bar. Their decisions are based on their individual forecasts of attendance for that week, such that if their estimate is greater than a specified threshold value they refrain from going (discomfort), whereas they visit the bar if they expect less people than to show up. Each agent (person) chooses her estimator from a set of number of predictors. If the predictor they used on a specific week leads them to take the wise decision (i.e., she goes and finds the attendance to be indeed less than , or she does not go and the attendance turns out to be greater than ), then they use that same predictor for the following week as well; otherwise, they randomly choose another predictor from the available set. The whole past time history of attendance is available to all the agents.
The setup we investigate is very similar to those previously discussed in the literature (e.g. the experiments discussed by Arthur[1], Johnson et al.[4], and Challet et al.[5], among others), with either all or some of the following differences: (i) The agents are free to choose their predictors from the whole pool as opposed to each having a smaller set of her own. Our preliminary investigations have suggested that these two approaches lead to qualitatively similar results. (ii) Our predictors employ various schemes that include arithmetic and weighted averages of various consecutive/non-consecutive weekly data, mirror images, curve fittings using various number of previous data, observed min/max values, same value as that of a previous week, etc. Each predictor may require a different length of past data. (iii) Each agent uses her most recent predictor as long as it leads to wise decisions, and randomly chooses a new one when it fails; in other words, the agents do not keep records of past performances of the predictors expect for the most recent one. (iv) The initial attendance data required to start each simulation is provided randomly. We have observed that the steady state behavior of the group is independent of these initial conditions, provided that the predictors are able to represent a wide variety of behavior patterns.
The main question we aim to discuss is: Is the collective behavior of the agents affected by the comfort level, i.e. the ratio ?
2 Behavior for various thresholds
We use a pool consisting of predictors, and analyze the problem for various values of and people. We consider both and time steps in the simulations; we should note, however, that the statistics do not differ significantly as we extend the time horizon. We denote by the time history of attendance (and also the value of attendance at week , depending on the context), and try to quantify the collective behavior in terms of the sample average and the sample variance where denotes the expected value operator.
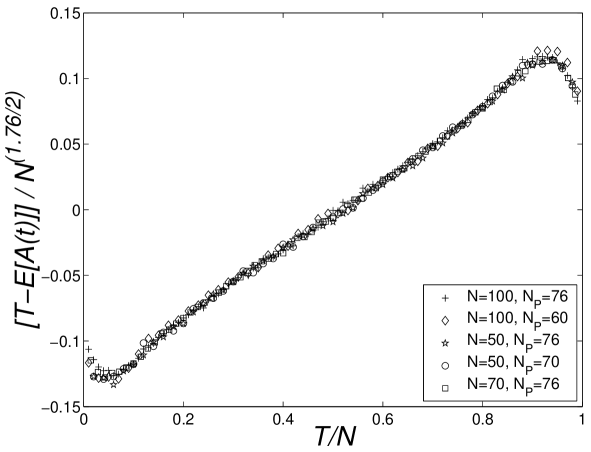
Figure 1 shows that the global attendance has a mean near, but not equal to, . The deviations are a function of the ratio ; moreover, the relationship is almost perfectly linear except for the end regions and . It is noteworthy that the mean converges to the threshold only when ; whenever the mean exceeds , and whenever the mean is smaller than . Note that the scaling is for the vertical axis: This scaling turns out to be (intuitively) necessary since the absolute deviations depend on the number of people. What is perhaps more interesting is that the scaling that yields the best overlap is not but rather some other power of it.
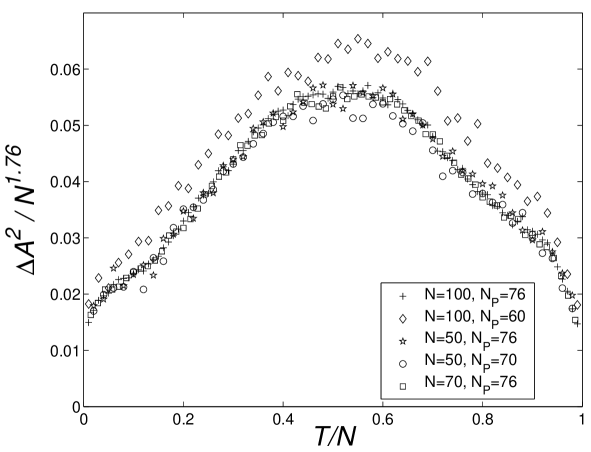
In Figure 2 we present the sample variances as a function of . For all cases considered, the curves are suggestive of a quadratic relation. Here the effects of the number of predictors used may be observed in the outlier results for people and algorithms. Our simulations led us to conclude that as long as the number of predictors used is not (significantly) small when compared with the number of people, has no pronounced effect neither on vs. nor on vs. . When, however, is significantly small, then there form somewhat large groups of people that use the same predictor and behave in the same way. These groups, in turn, increase the variance, such that the smaller the number of predictors, the larger the number of people that behave identically and the larger the variance. The limit, of course, is for which we would have .
Finally, we strongly emphasize that we can not claim any physical significance for the number ; as it is, it is just a scaling factor we use, which leads to patterns that are visually overlapping. Our numerous simulations suggest that keeping constant and varying or vice versa (subject to aforementioned conditions) does not alter the value of this constant, as implied by Figures 1 and 2.
3 Discussions and Conclusions
These global patterns are somewhat surprising in light of some previous comments in the literature [1, 5, 6], except for the analysis by Johnson et al. [4] wherein the authors mention that the mean attendance is near, but not equal to, the threshold. We now try to formulate an interpretation for the observed phenomena as follows: Let denote some (unknown) function which leads to
| (1) |
We immediately note that for , the function should be linear. This is a macro (global) condition, and as it is it can not be imposed directly on the agents (micro), even though the threshold itself is imposed globally. Therefore the convergence of to is not guaranteed. Our results in fact suggest that the system as a whole adjusts itself so as to impose a perceived threshold to which converges. To dwell further into the details of this behavior, let us expand both sides of eq.(1) about and keep only the small order terms to get
| (2) |
which leads to
| (3) |
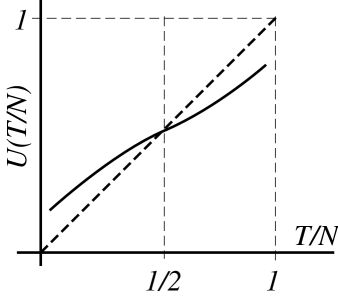
The expansion given in eq.(2) is reminiscent of the approach discussed by Pratt[7]. Provided that is a monotonically non-decreasing function, the sign of the right hand side of eq.(3) is governed by the sign of ; implies a concave , and implies a convex . We could interpret the observed behavior by focusing on the relation of the global attendance with respect to the applied threshold, and say that mean attendance converges to the perceived threshold instead of the actually imposed value, and that the global perception is defined by a function of the form shown in Figure 3.
References
- [1] W.B. Arthur. Inductive reasoning and bounded rationality. Amer. Econ. Rev. 84, 406, 1994.
- [2] D. Challet and Y.-C. Zhang. Emergence of cooperation and organization in an evolutionary game. Physica A 246, 407, 1997.
- [3] D. Challet and Y.-C. Zhang. On the minority game: Analytical and numerical studies. Physica A 256, 514, 1998.
- [4] N.F. Johnson, S. Jarvis, R. Jonson, P. Cheung, Y.R. Kwong, and P.M. Hui. Volatility and agent adaptability in a self-organizing market. Physica A 258, 230, 2001.
- [5] D. Challet, M. Marsili, and G. Ottino. Shedding light on El Farol. Physica A, 332, 469, 2003.
- [6] M.A.R. de Cara, O. Pla, and F. Guinea. Competition, efficiency, and collective behavior in the “El Farol” bar model. Eur. Phys. J. B 10, 187, 1999.
- [7] J.W. Pratt. Risk aversion in the small and in the large. Econometrica 32, 122, 1964.